| Param | Original file | Final file |
|---|---|---|
| Filename | modeM0/AS1A12_022T01_9000005494_39769cztM0_level2.fits | modeM0/AS1A12_022T01_9000005494_39769cztM0_level2_quad_clean.evt |
| Size (bytes) | 394,349,760 | 92,165,760 |
| Size | 376.1 MB | 87.9 MB |
| Events in quadrant A | 3,010,908 | 630,947 |
| Events in quadrant B | 3,046,711 | 617,838 |
| Events in quadrant C | 4,809,836 | 588,659 |
| Events in quadrant D | 3,298,121 | 564,361 |
| Mode SS | |||
|---|---|---|---|
| Quadrant | BADHDUFLAG | Total packets | Discarded packets |
| A | 0 | 114 | 0 |
| B | 0 | 114 | 0 |
| C | 0 | 114 | 0 |
| D | 0 | 114 | 0 |
| Mode M0 | |||
|---|---|---|---|
| Quadrant | BADHDUFLAG | Total packets | Discarded packets |
| A | 0 | 12541 | 3 |
| B | 0 | 12810 | 2 |
| C | 0 | 18090 | 2 |
| D | 0 | 13599 | 2 |
| Mode M9 | |||
|---|---|---|---|
| Quadrant | BADHDUFLAG | Total packets | Discarded packets |
| A | 0 | 28 | 0 |
| B | 0 | 28 | 0 |
| C | 0 | 28 | 0 |
| D | 0 | 29 | 0 |
| Quadrant | Total seconds | Saturated seconds | Saturation percentage |
|---|---|---|---|
| A | 5557 | 18 | 0.323916% |
| B | 5557 | 219 | 3.940975% |
| C | 5557 | 301 | 5.416592% |
| D | 5557 | 59 | 1.061724% |
Noise dominated data is calculated using 1-second bins in cleaned event files. If a bin has >2000 counts, and if more than 50% of those come from <1% of pixels, then it is considered to be noise-dominated and hence unusable.
| Quadrant | # 1 sec bins | Bins with >0 counts | Bins with >2000 counts | High rate bins dominated by noise | Noise dominated (total time) | Noise dominated (detector-on time) | Marked lightcurve |
|---|---|---|---|---|---|---|---|
| A | 7140 | 5558 | 12 | 12 | 0.17% | 0.22% | 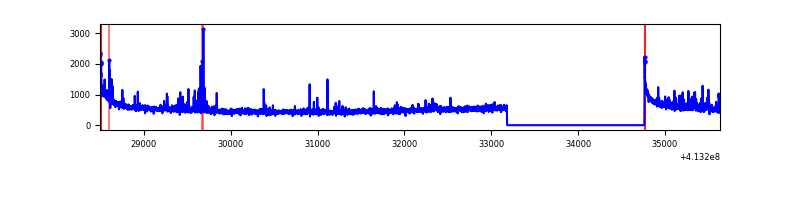 |
| B | 7140 | 5558 | 165 | 165 | 2.31% | 2.97% | 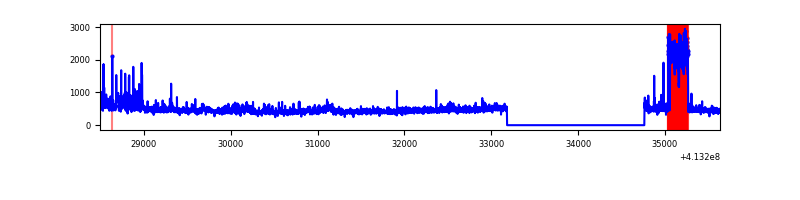 |
| C | 7140 | 5558 | 299 | 299 | 4.19% | 5.38% | 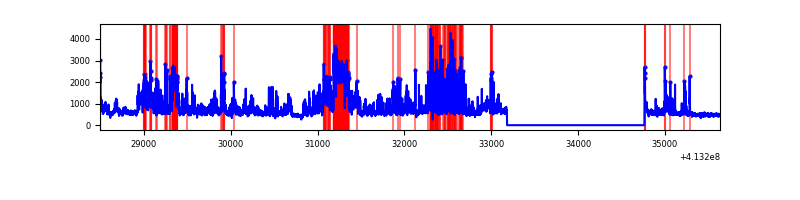 |
| D | 7140 | 5558 | 44 | 44 | 0.62% | 0.79% | 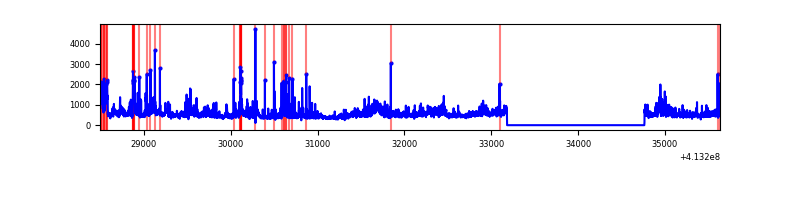 |
Top three noisy pixels from each quadrant. If the there are fewer than three noisy pixels in the level2.evt file, extra rows are filled as -1
| Pixel properties | Quadrant properties | ||||||
|---|---|---|---|---|---|---|---|
| Quadrant | DetID | PixID | Counts | Sigma | Mean | Median | Sigma |
| A | 10 | 83 | 476594 | 3880.96 | 607 | 595 | 122.6 |
| A | 13 | 248 | 82282 | 666.02 | 607 | 595 | 122.6 |
| A | 2 | 79 | 75450 | 610.31 | 607 | 595 | 122.6 |
| B | 5 | 172 | 417423 | 3604.77 | 598 | 583 | 115.6 |
| B | 4 | 251 | 92249 | 792.71 | 598 | 583 | 115.6 |
| B | 0 | 190 | 61681 | 528.37 | 598 | 583 | 115.6 |
| C | 15 | 208 | 1154047 | 8488.67 | 584 | 588 | 135.9 |
| C | 9 | 187 | 1088296 | 8004.79 | 584 | 588 | 135.9 |
| C | 15 | 214 | 224425 | 1647.29 | 584 | 588 | 135.9 |
| D | 12 | 227 | 702344 | 4780.91 | 593 | 576 | 146.8 |
| D | 12 | 233 | 76632 | 518.14 | 593 | 576 | 146.8 |
| D | 13 | 171 | 74728 | 505.17 | 593 | 576 | 146.8 |
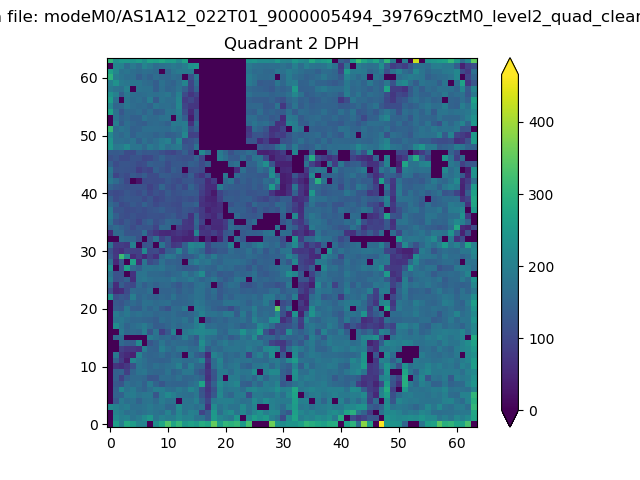
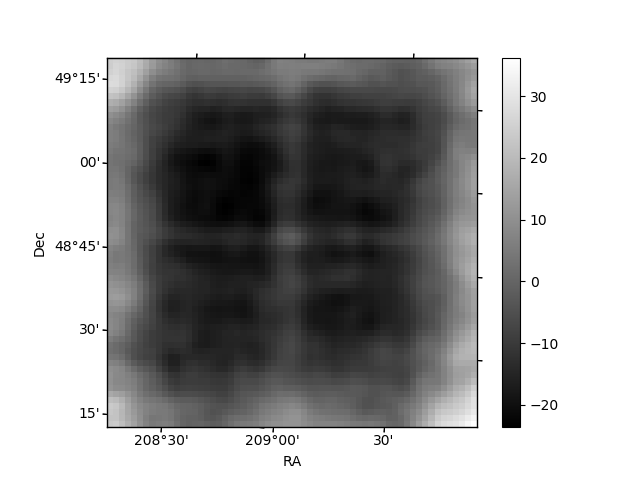
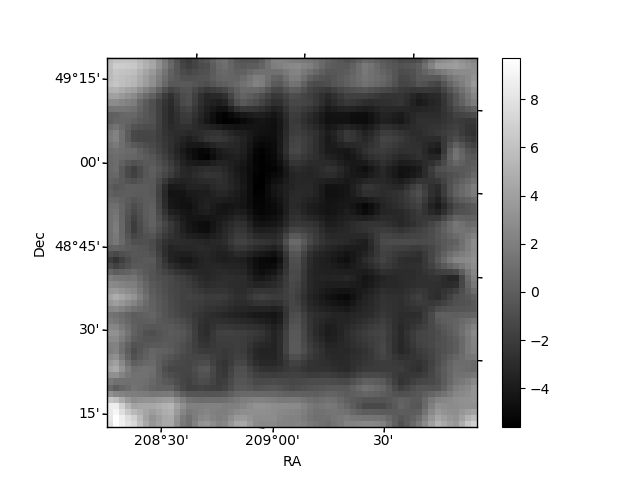
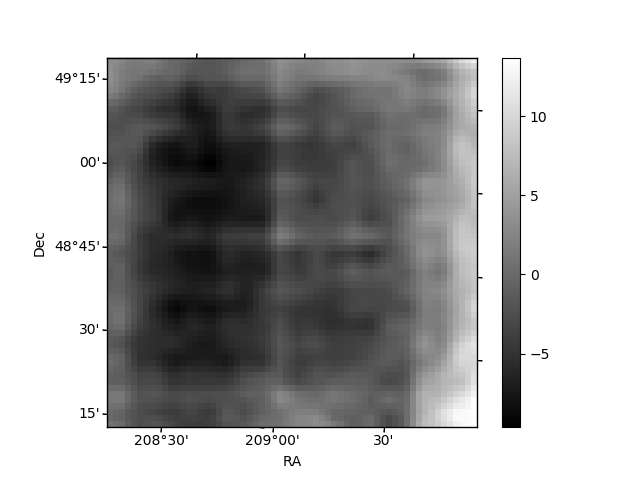
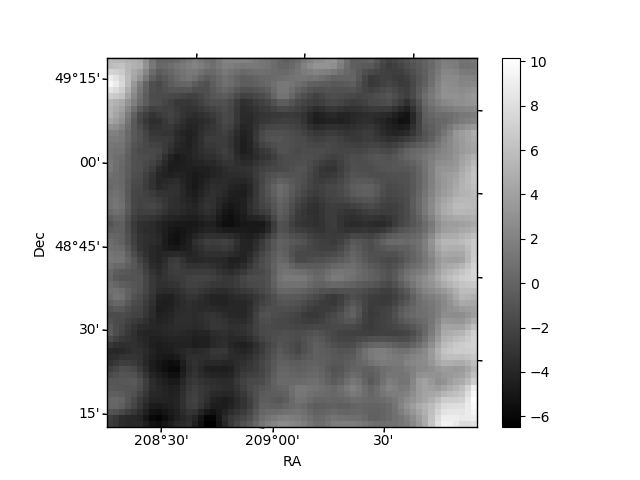
Histogram calculated using DETX and DETY for each event in the final _common_clean file
| Quadrant A | 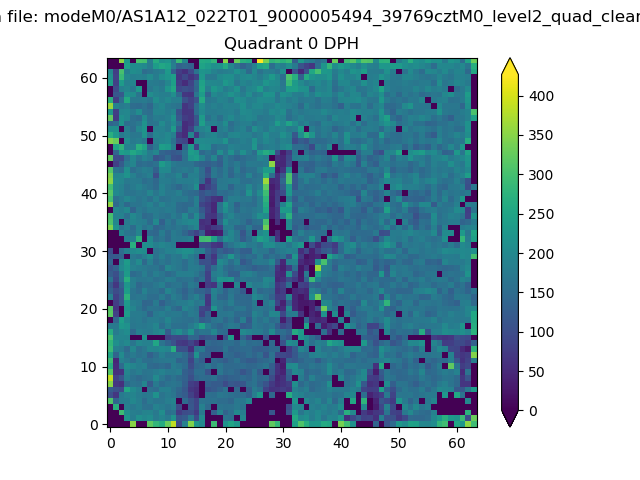 |
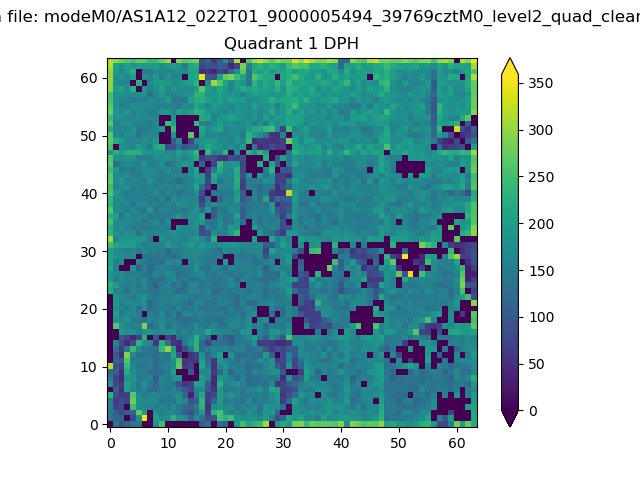 |
Quadrant B |
|---|---|---|---|
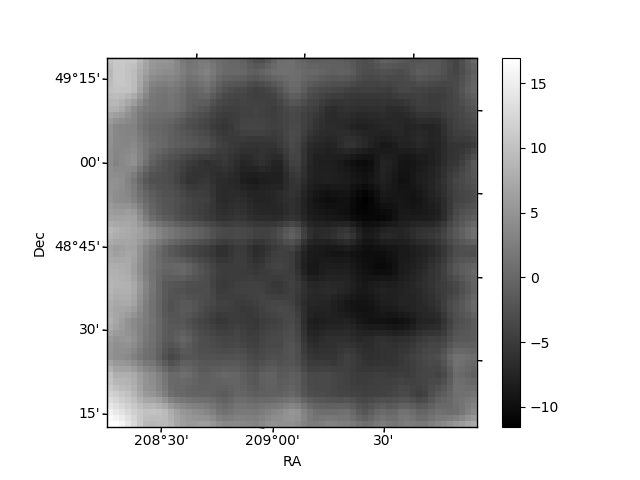
| Quadrant D | 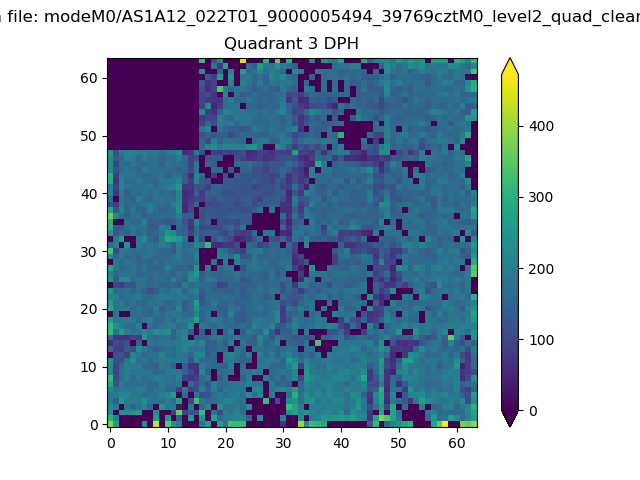 |
 |
Quadrant C |
| Plot type | Count rate plots | Images |
|---|---|---|
| Comparison with Poisson distribution Blue bars denote a histogram of data divided into 1 sec bins. Red curve is a Poisson curve with rate = median count rate of data. |
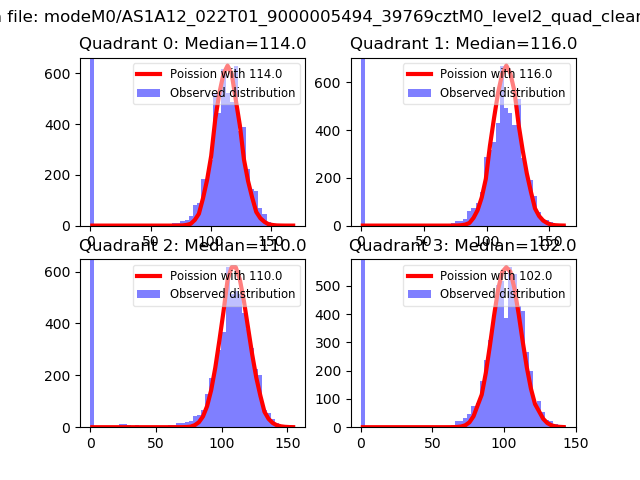 |
 |
| Quadrant-wise count rates Data is divided into 100 sec bins |
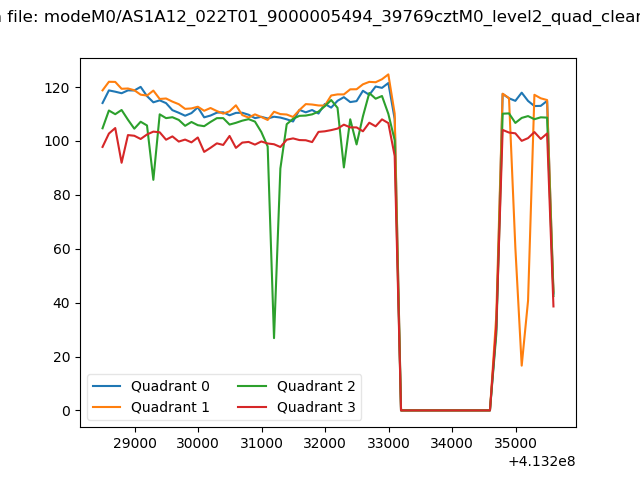 |
|
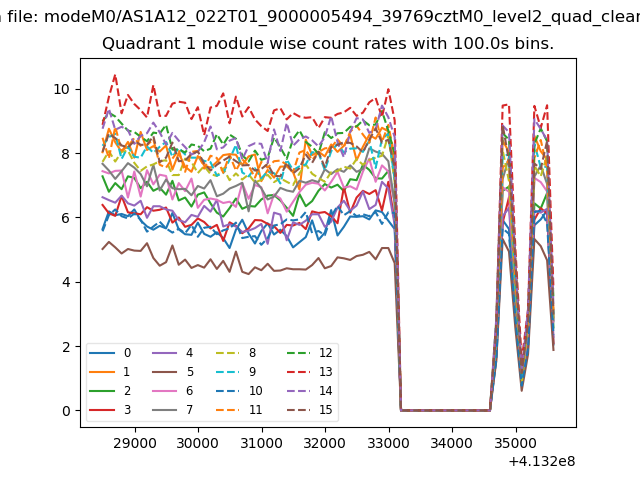
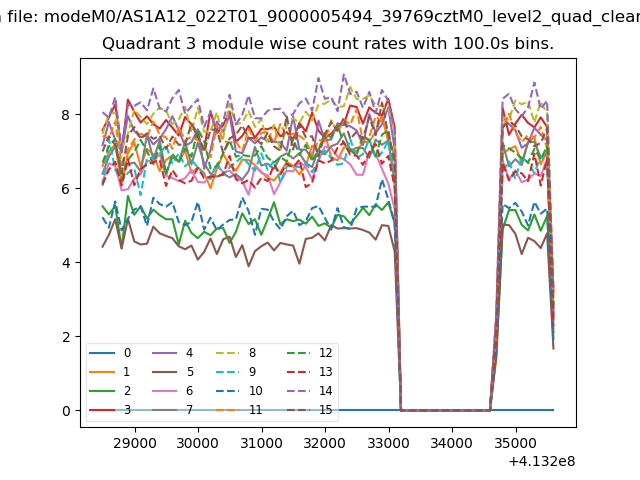
| Module-wise count rates for Quadrant A Data is divided into 100 sec bins |
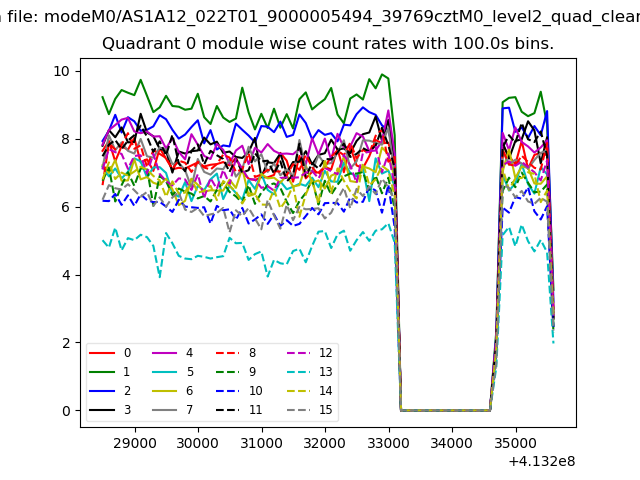 |
 |
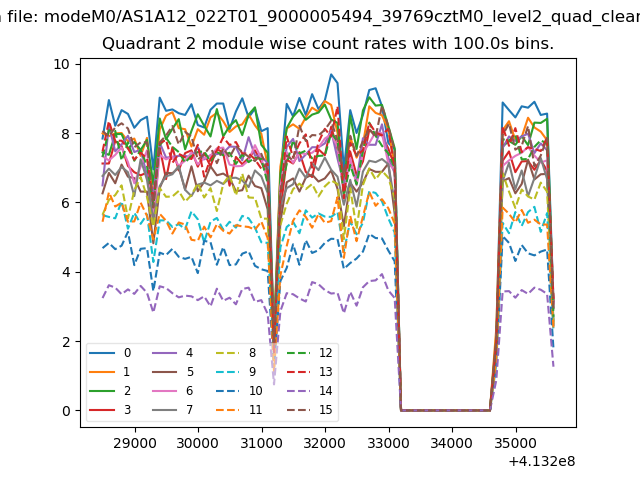
| Module-wise count rates for Quadrant B Data is divided into 100 sec bins |
 |
 |
| Module-wise count rates for Quadrant C Data is divided into 100 sec bins |
 |
 |
| Module-wise count rates for Quadrant D Data is divided into 100 sec bins |
 |
 |
| Parameter | Plot |
|---|---|
| CZT HV Monitor | 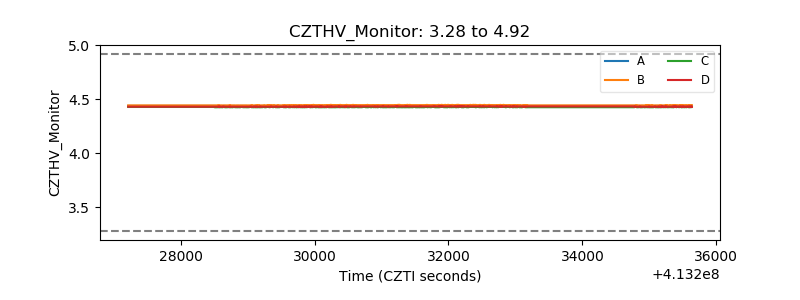 |
| D_VDD | 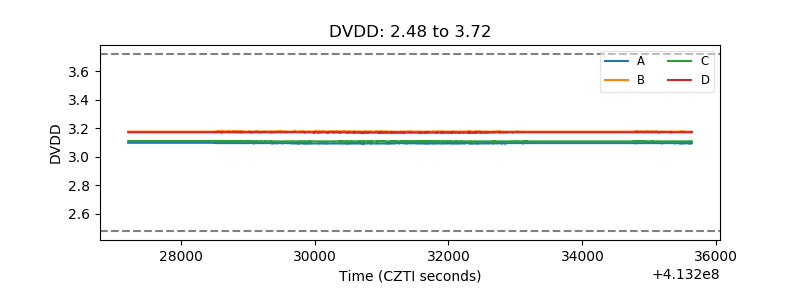 |
| Temperature 1 | 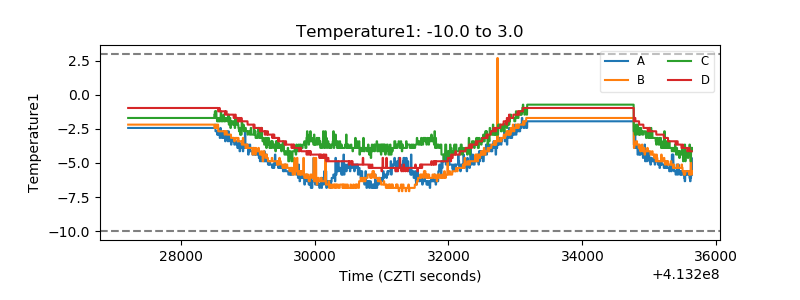 |
| Veto HV Monitor | 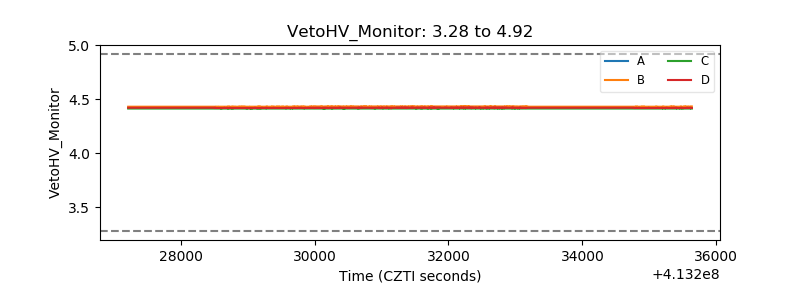 |
| Veto LLD | 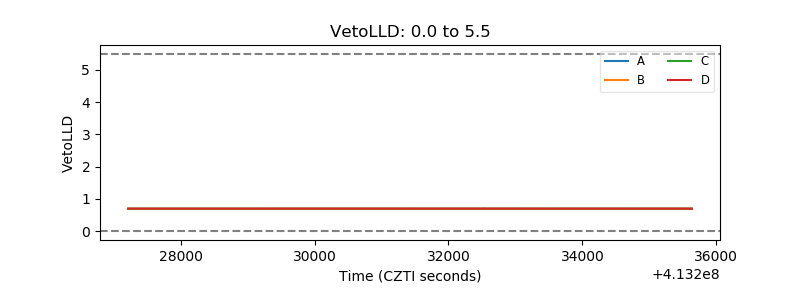 |
| Alpha Counter | 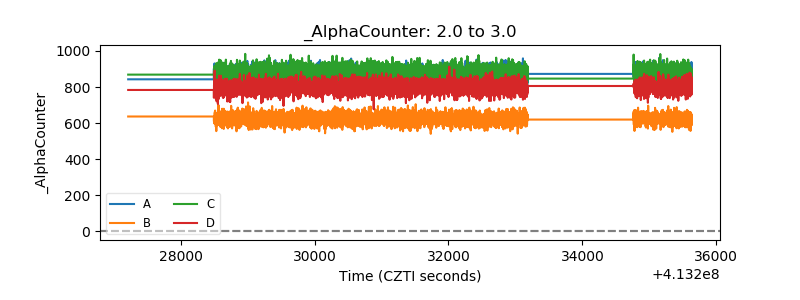 |
| _CPM_Rate | 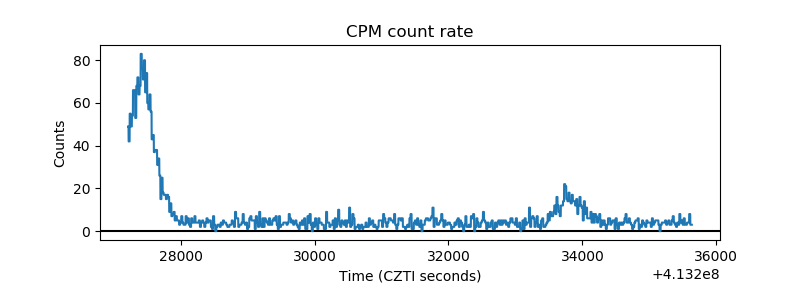 |
| CZT Counter | 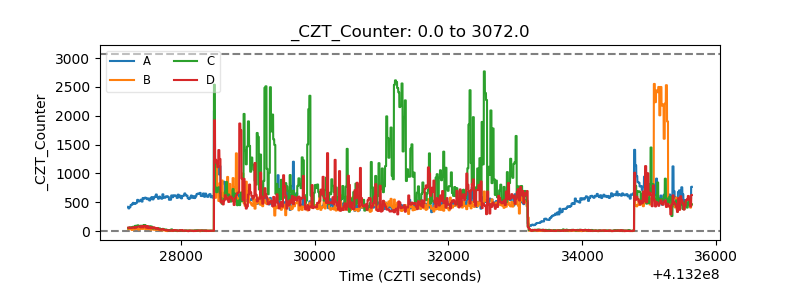 |
| +2.5 Volts monitor | 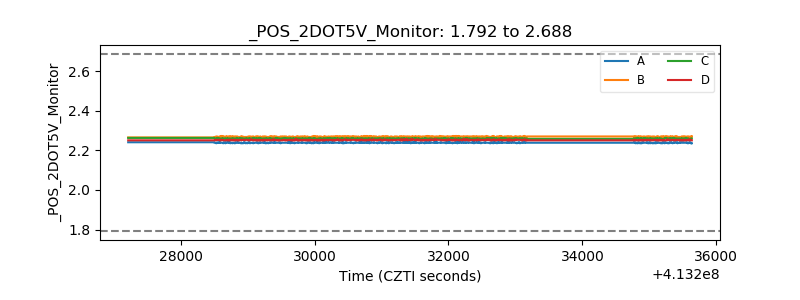 |
| +5 Volts monitor | 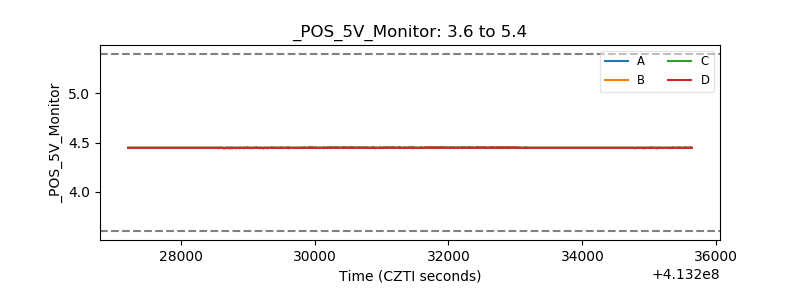 |
| _ROLL_ROT | 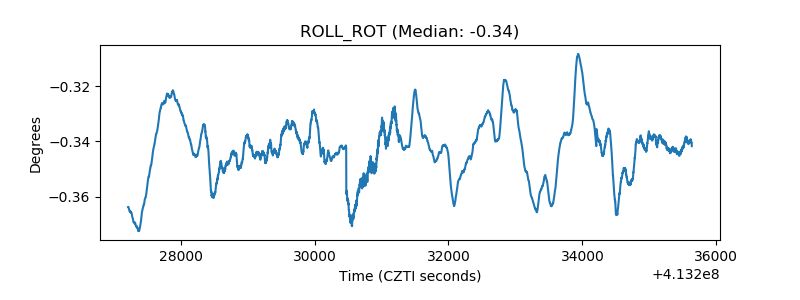 |
| _Roll_DEC | 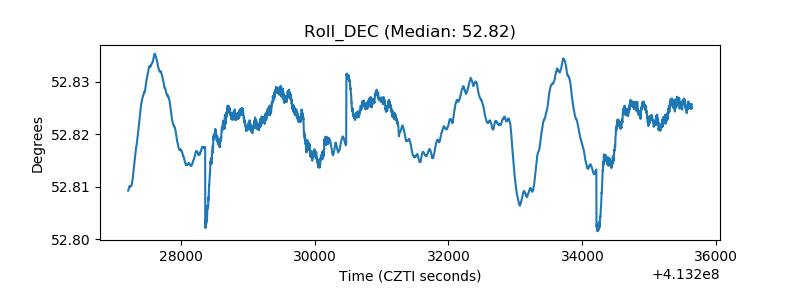 |
| _Roll_RA | 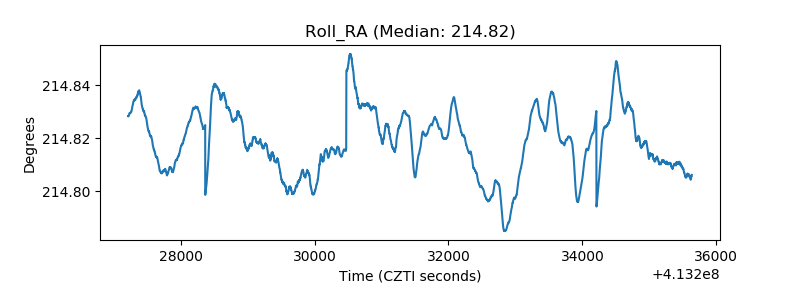 |
| Veto Counter | 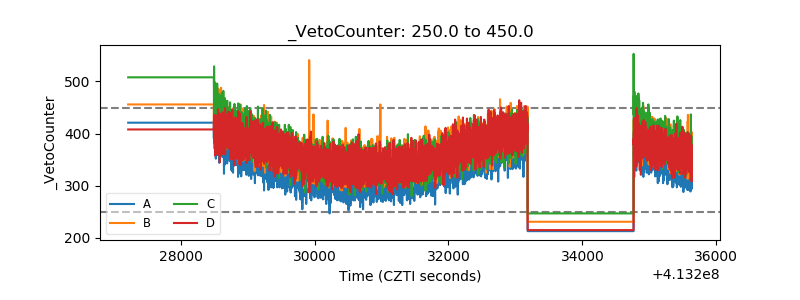 |