| Param | Original file | Final file |
|---|---|---|
| Filename | modeM0/AS1A12_022T01_9000005494_39770cztM0_level2.fits | modeM0/AS1A12_022T01_9000005494_39770cztM0_level2_quad_clean.evt |
| Size (bytes) | 354,228,480 | 94,628,160 |
| Size | 337.8 MB | 90.2 MB |
| Events in quadrant A | 3,187,823 | 641,084 |
| Events in quadrant B | 3,314,957 | 626,690 |
| Events in quadrant C | 2,815,049 | 621,986 |
| Events in quadrant D | 3,345,504 | 572,918 |
| Mode SS | |||
|---|---|---|---|
| Quadrant | BADHDUFLAG | Total packets | Discarded packets |
| A | 0 | 116 | 0 |
| B | 0 | 116 | 0 |
| C | 0 | 116 | 0 |
| D | 0 | 116 | 0 |
| Mode M0 | |||
|---|---|---|---|
| Quadrant | BADHDUFLAG | Total packets | Discarded packets |
| A | 0 | 13201 | 3 |
| B | 0 | 13701 | 2 |
| C | 0 | 12111 | 2 |
| D | 0 | 14143 | 2 |
| Mode M9 | |||
|---|---|---|---|
| Quadrant | BADHDUFLAG | Total packets | Discarded packets |
| A | 0 | 19 | 0 |
| B | 0 | 19 | 0 |
| C | 0 | 19 | 0 |
| D | 0 | 20 | 0 |
| Quadrant | Total seconds | Saturated seconds | Saturation percentage |
|---|---|---|---|
| A | 5765 | 18 | 0.312229% |
| B | 5765 | 266 | 4.614050% |
| C | 5765 | 20 | 0.346921% |
| D | 5765 | 135 | 2.341717% |
Noise dominated data is calculated using 1-second bins in cleaned event files. If a bin has >2000 counts, and if more than 50% of those come from <1% of pixels, then it is considered to be noise-dominated and hence unusable.
| Quadrant | # 1 sec bins | Bins with >0 counts | Bins with >2000 counts | High rate bins dominated by noise | Noise dominated (total time) | Noise dominated (detector-on time) | Marked lightcurve |
|---|---|---|---|---|---|---|---|
| A | 7107 | 5766 | 12 | 12 | 0.17% | 0.21% | 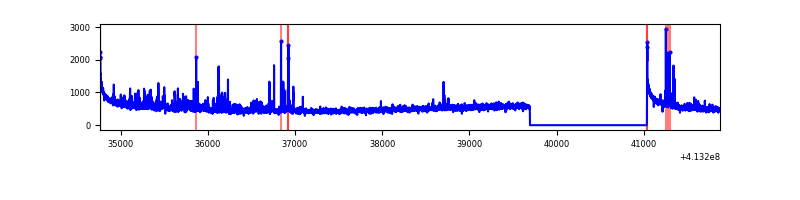 |
| B | 7107 | 5766 | 209 | 209 | 2.94% | 3.62% | 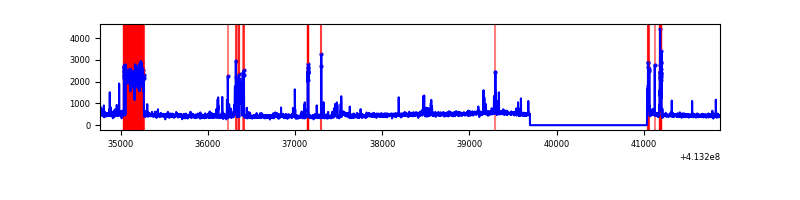 |
| C | 7107 | 5766 | 9 | 9 | 0.13% | 0.16% | 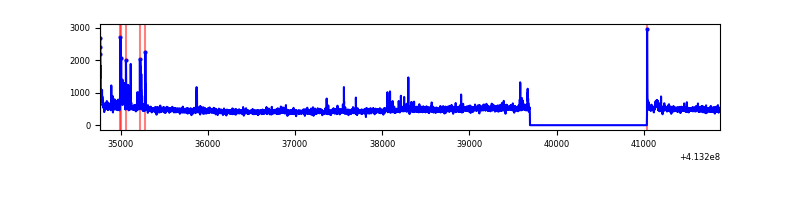 |
| D | 7107 | 5766 | 106 | 106 | 1.49% | 1.84% | 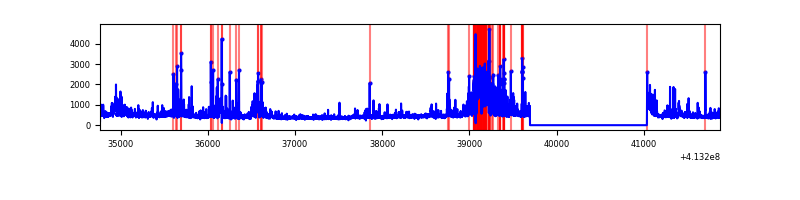 |
Top three noisy pixels from each quadrant. If the there are fewer than three noisy pixels in the level2.evt file, extra rows are filled as -1
| Pixel properties | Quadrant properties | ||||||
|---|---|---|---|---|---|---|---|
| Quadrant | DetID | PixID | Counts | Sigma | Mean | Median | Sigma |
| A | 10 | 83 | 474251 | 3675.81 | 629 | 616 | 128.9 |
| A | 2 | 79 | 229091 | 1773.16 | 629 | 616 | 128.9 |
| A | 13 | 248 | 38621 | 294.95 | 629 | 616 | 128.9 |
| B | 5 | 172 | 563034 | 4650.91 | 617 | 601 | 120.9 |
| B | 5 | 255 | 169404 | 1395.88 | 617 | 601 | 120.9 |
| B | 5 | 32 | 82193 | 674.71 | 617 | 601 | 120.9 |
| C | 15 | 214 | 238189 | 1654.57 | 613 | 617 | 143.6 |
| C | 15 | 208 | 82664 | 571.42 | 613 | 617 | 143.6 |
| C | 9 | 187 | 53237 | 366.47 | 613 | 617 | 143.6 |
| D | 12 | 227 | 406875 | 2684.83 | 609 | 591 | 151.3 |
| D | 12 | 217 | 246081 | 1622.26 | 609 | 591 | 151.3 |
| D | 12 | 233 | 157595 | 1037.52 | 609 | 591 | 151.3 |
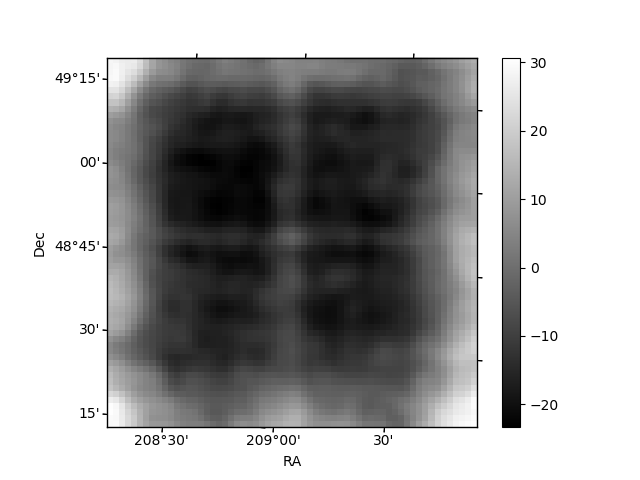
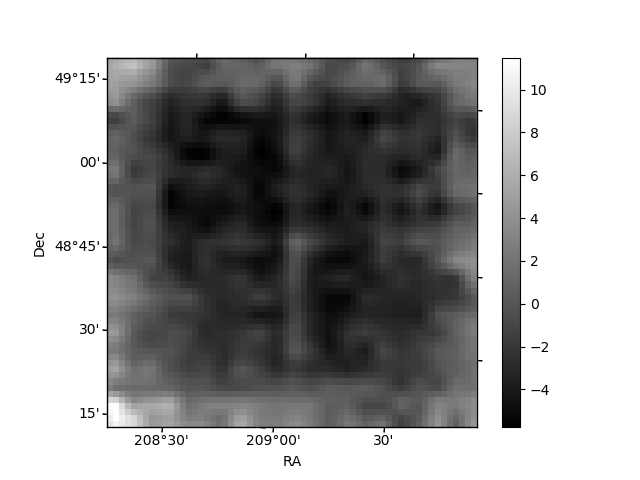
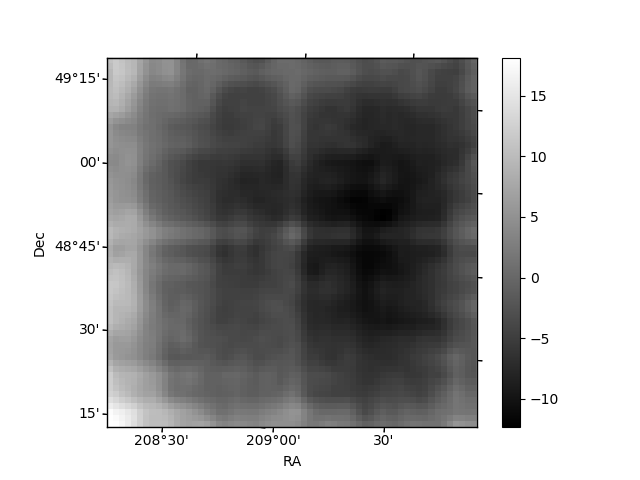
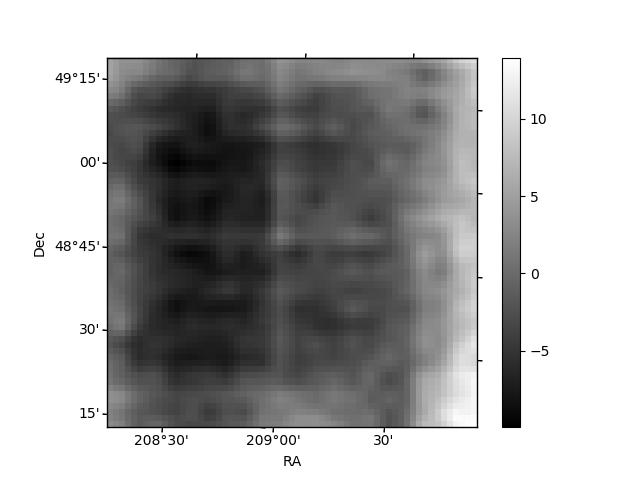
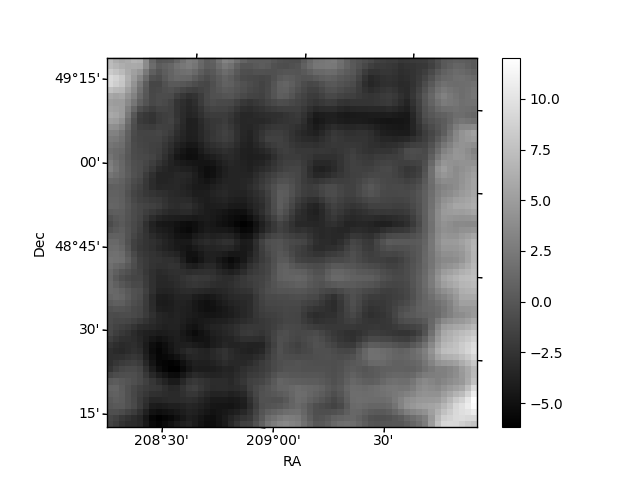
Histogram calculated using DETX and DETY for each event in the final _common_clean file
| Quadrant A | 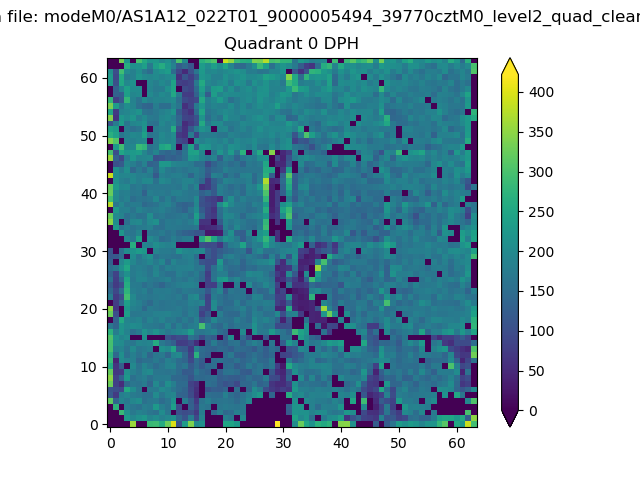 |
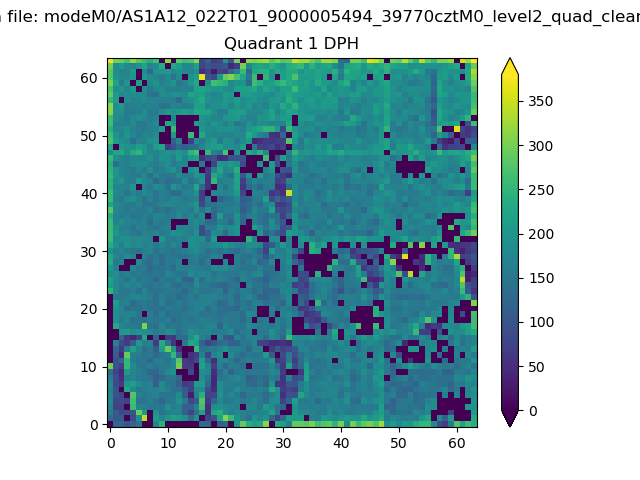 |
Quadrant B |
|---|---|---|---|
| Quadrant D | 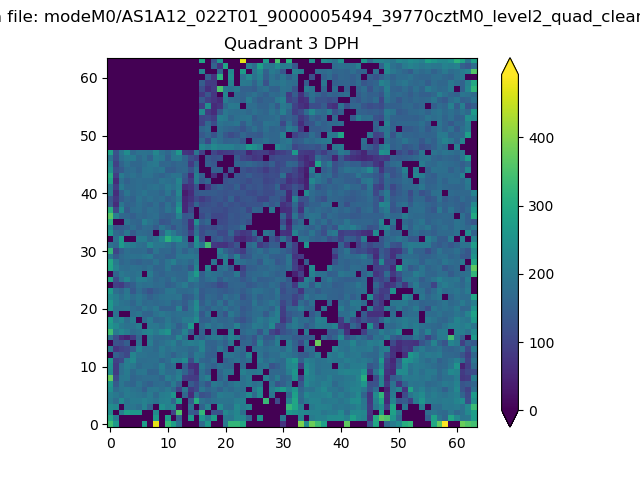 |
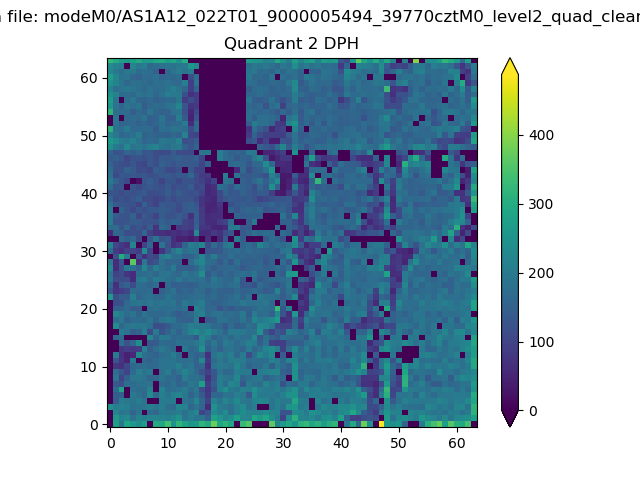 |
Quadrant C |
| Plot type | Count rate plots | Images |
|---|---|---|
| Comparison with Poisson distribution Blue bars denote a histogram of data divided into 1 sec bins. Red curve is a Poisson curve with rate = median count rate of data. |
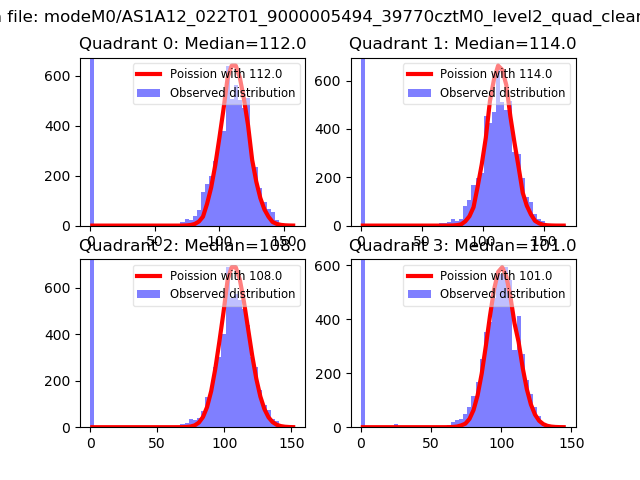 |
 |
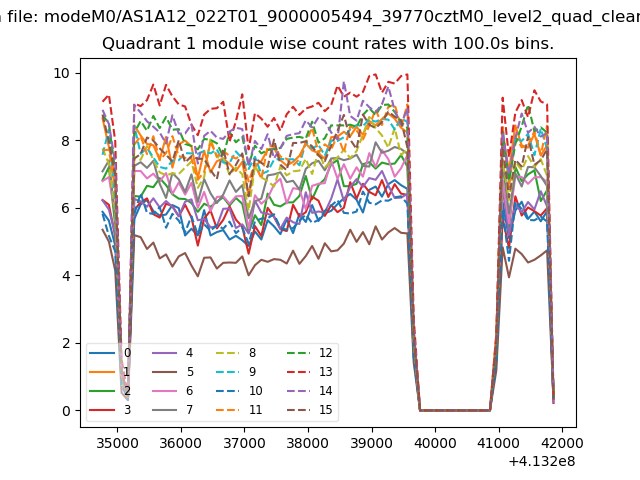
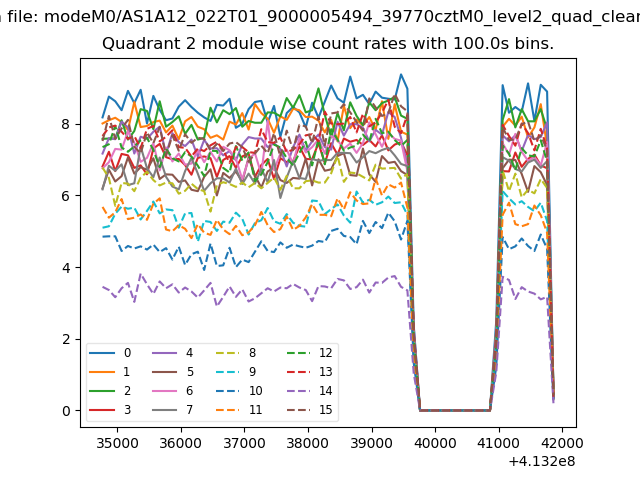
| Quadrant-wise count rates Data is divided into 100 sec bins |
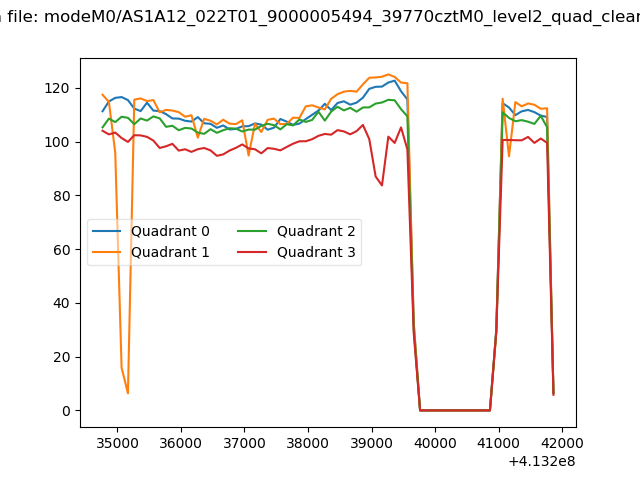 |
|
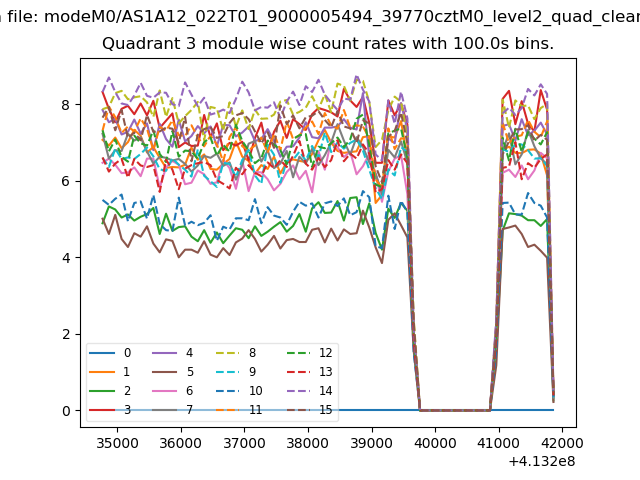
| Module-wise count rates for Quadrant A Data is divided into 100 sec bins |
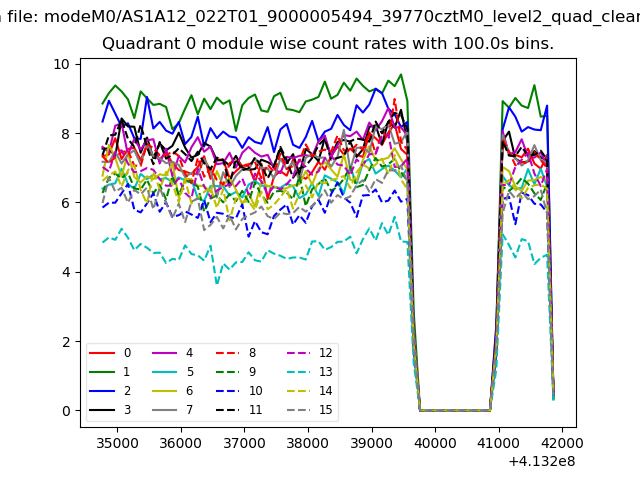 |
 |
| Module-wise count rates for Quadrant B Data is divided into 100 sec bins |
 |
 |
| Module-wise count rates for Quadrant C Data is divided into 100 sec bins |
 |
 |
| Module-wise count rates for Quadrant D Data is divided into 100 sec bins |
 |
 |
| Parameter | Plot |
|---|---|
| CZT HV Monitor | 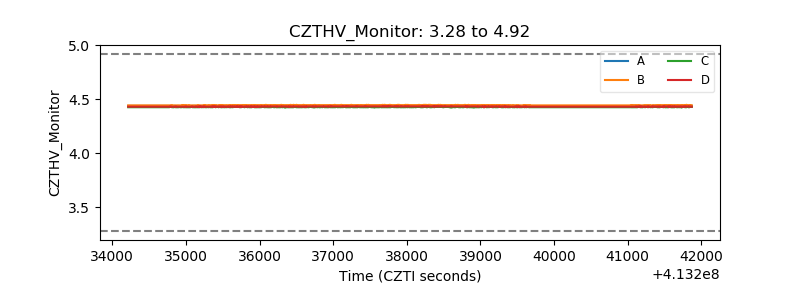 |
| D_VDD | 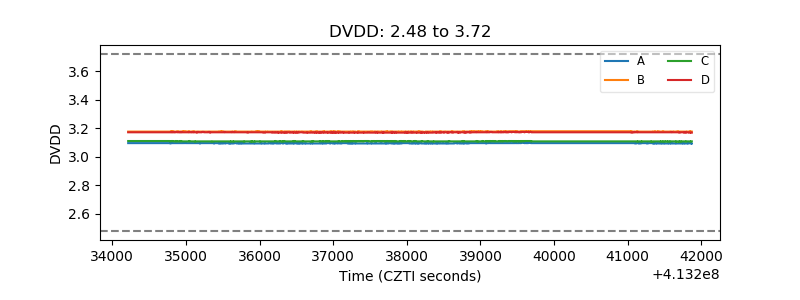 |
| Temperature 1 | 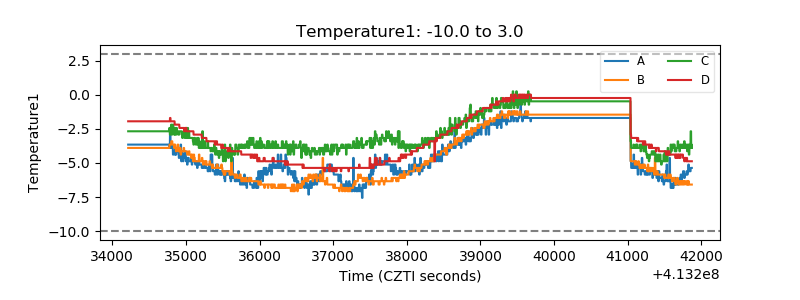 |
| Veto HV Monitor | 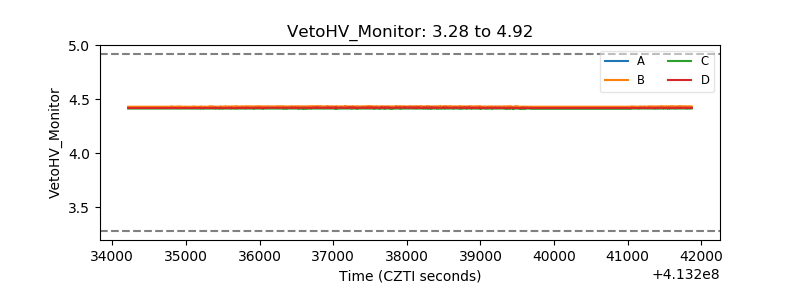 |
| Veto LLD | 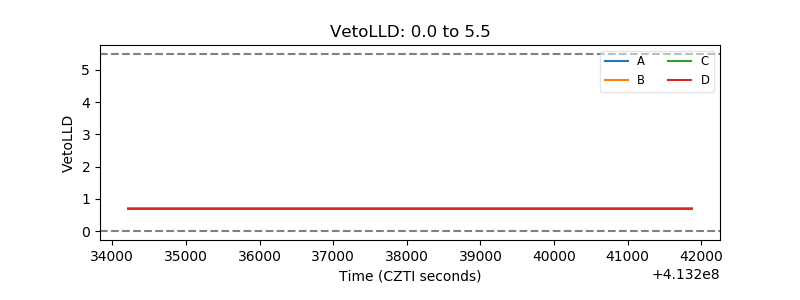 |
| Alpha Counter | 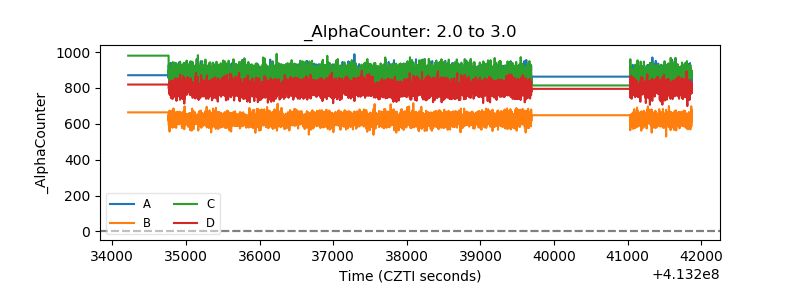 |
| _CPM_Rate | 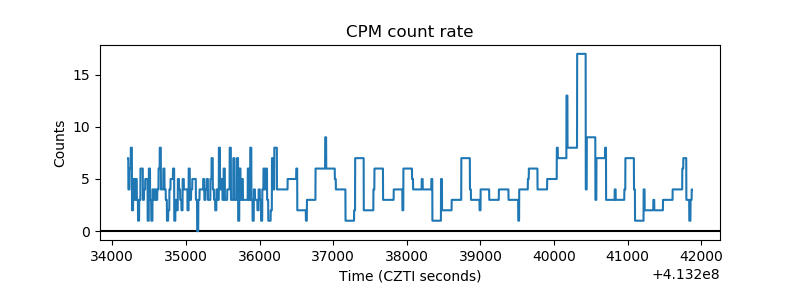 |
| CZT Counter | 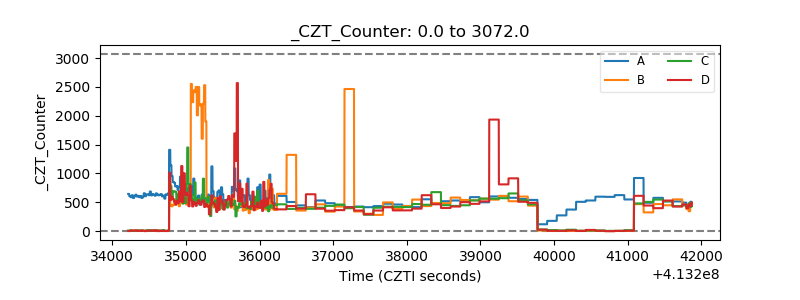 |
| +2.5 Volts monitor | 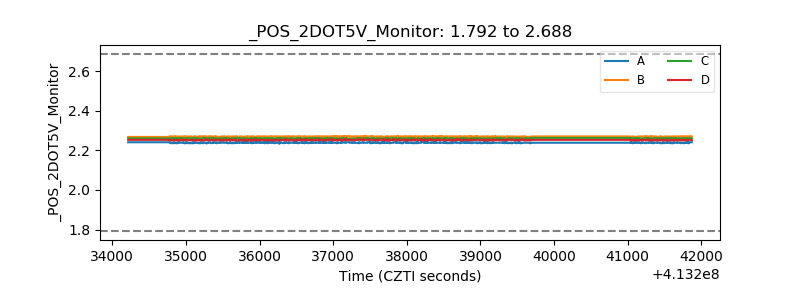 |
| +5 Volts monitor | 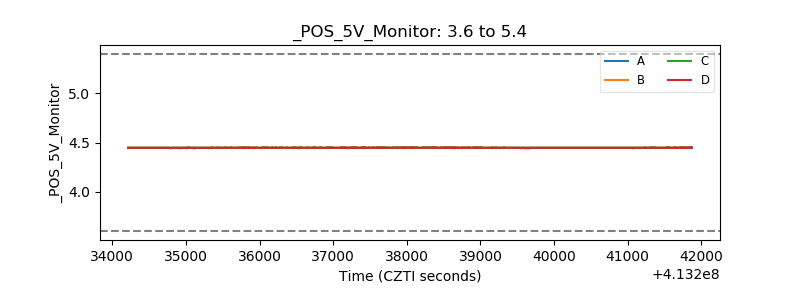 |
| _ROLL_ROT | 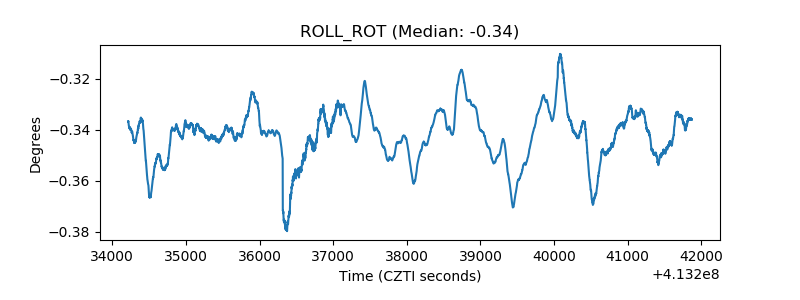 |
| _Roll_DEC | 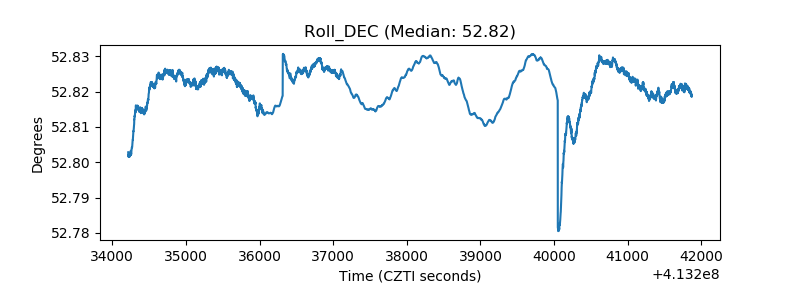 |
| _Roll_RA | 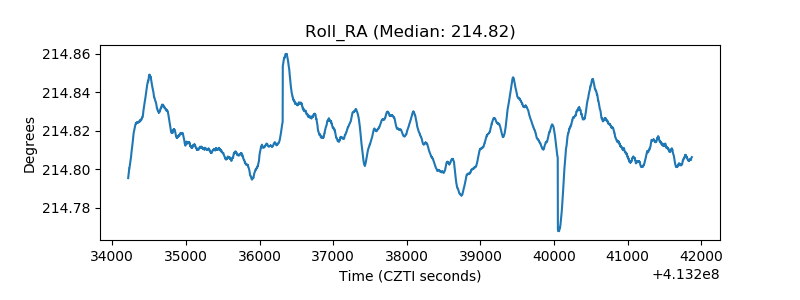 |
| Veto Counter | 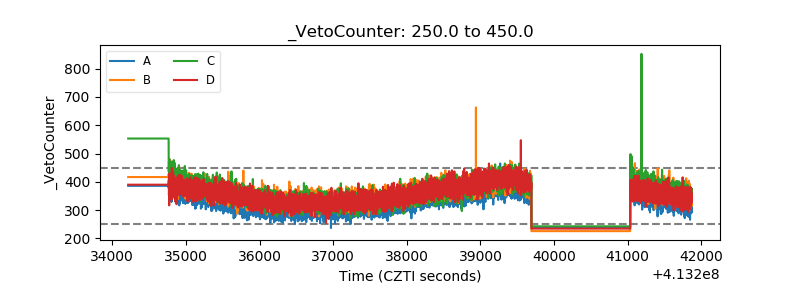 |