| Param | Original file | Final file |
|---|---|---|
| Filename | modeM0/AS1A12_022T01_9000005494_39771cztM0_level2.fits | modeM0/AS1A12_022T01_9000005494_39771cztM0_level2_quad_clean.evt |
| Size (bytes) | 394,444,800 | 107,144,640 |
| Size | 376.2 MB | 102.2 MB |
| Events in quadrant A | 3,424,948 | 719,175 |
| Events in quadrant B | 3,223,039 | 730,379 |
| Events in quadrant C | 3,474,072 | 702,814 |
| Events in quadrant D | 3,975,165 | 640,411 |
| Mode SS | |||
|---|---|---|---|
| Quadrant | BADHDUFLAG | Total packets | Discarded packets |
| A | 0 | 132 | 0 |
| B | 0 | 132 | 0 |
| C | 0 | 132 | 0 |
| D | 0 | 132 | 0 |
| Mode M0 | |||
|---|---|---|---|
| Quadrant | BADHDUFLAG | Total packets | Discarded packets |
| A | 0 | 14304 | 3 |
| B | 0 | 14062 | 2 |
| C | 0 | 14417 | 2 |
| D | 0 | 16597 | 2 |
| Mode M9 | |||
|---|---|---|---|
| Quadrant | BADHDUFLAG | Total packets | Discarded packets |
| A | 0 | 27 | 0 |
| B | 0 | 27 | 0 |
| C | 0 | 27 | 0 |
| D | 0 | 27 | 0 |
| Quadrant | Total seconds | Saturated seconds | Saturation percentage |
|---|---|---|---|
| A | 6476 | 18 | 0.277949% |
| B | 6476 | 53 | 0.818406% |
| C | 6476 | 22 | 0.339716% |
| D | 6476 | 219 | 3.381717% |
Noise dominated data is calculated using 1-second bins in cleaned event files. If a bin has >2000 counts, and if more than 50% of those come from <1% of pixels, then it is considered to be noise-dominated and hence unusable.
| Quadrant | # 1 sec bins | Bins with >0 counts | Bins with >2000 counts | High rate bins dominated by noise | Noise dominated (total time) | Noise dominated (detector-on time) | Marked lightcurve |
|---|---|---|---|---|---|---|---|
| A | 9132 | 6479 | 11 | 11 | 0.12% | 0.17% | 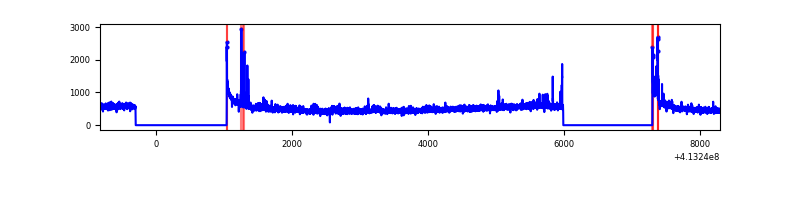 |
| B | 9132 | 6479 | 33 | 33 | 0.36% | 0.51% | 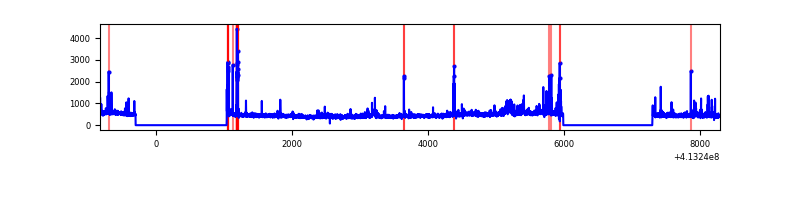 |
| C | 9132 | 6479 | 19 | 19 | 0.21% | 0.29% | 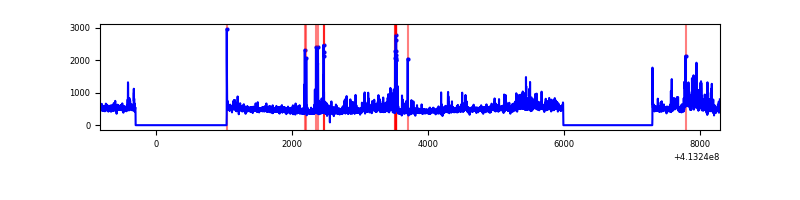 |
| D | 9132 | 6479 | 160 | 160 | 1.75% | 2.47% | 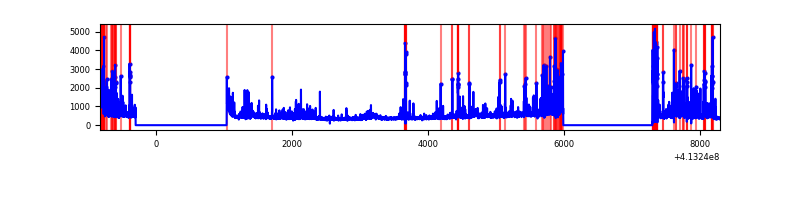 |
Top three noisy pixels from each quadrant. If the there are fewer than three noisy pixels in the level2.evt file, extra rows are filled as -1
| Pixel properties | Quadrant properties | ||||||
|---|---|---|---|---|---|---|---|
| Quadrant | DetID | PixID | Counts | Sigma | Mean | Median | Sigma |
| A | 10 | 83 | 514424 | 3511.14 | 717 | 703 | 146.3 |
| A | 2 | 79 | 68045 | 460.26 | 717 | 703 | 146.3 |
| A | 15 | 174 | 38812 | 260.46 | 717 | 703 | 146.3 |
| B | 5 | 172 | 113938 | 820.75 | 708 | 689 | 138.0 |
| B | 5 | 32 | 82042 | 589.59 | 708 | 689 | 138.0 |
| B | 5 | 255 | 73680 | 528.99 | 708 | 689 | 138.0 |
| C | 15 | 208 | 304640 | 1861.46 | 697 | 700 | 163.3 |
| C | 15 | 214 | 267351 | 1633.08 | 697 | 700 | 163.3 |
| C | 9 | 187 | 79593 | 483.17 | 697 | 700 | 163.3 |
| D | 12 | 227 | 764621 | 4514.9 | 688 | 668 | 169.2 |
| D | 12 | 233 | 198051 | 1166.52 | 688 | 668 | 169.2 |
| D | 13 | 249 | 148975 | 876.48 | 688 | 668 | 169.2 |
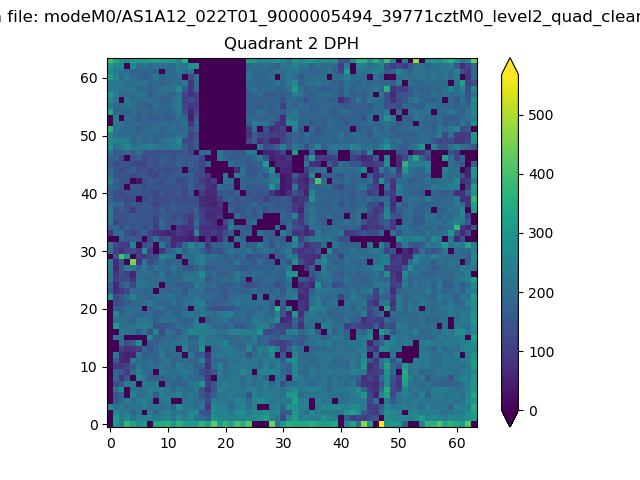
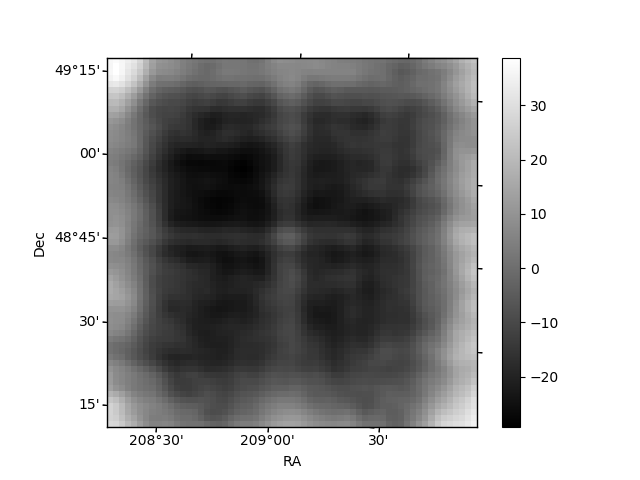
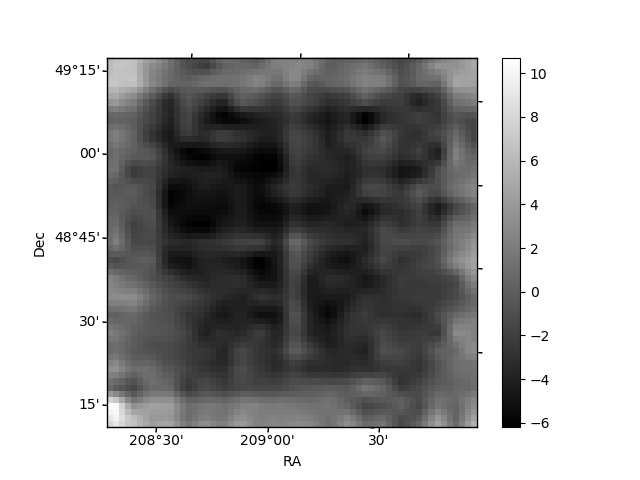
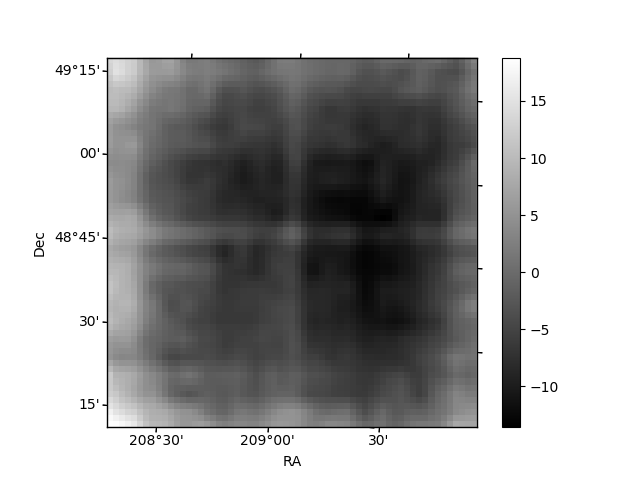
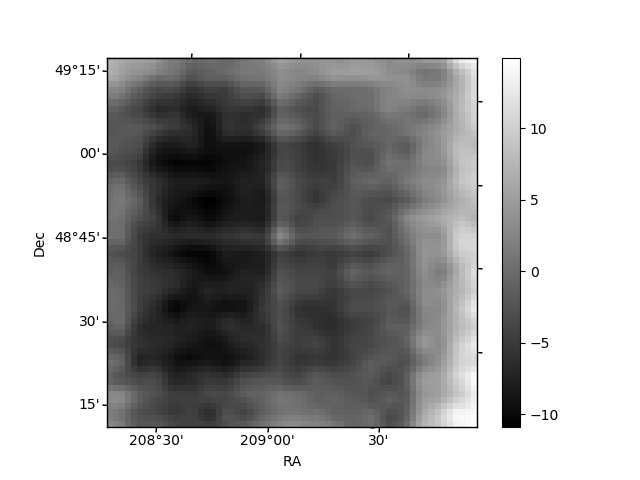
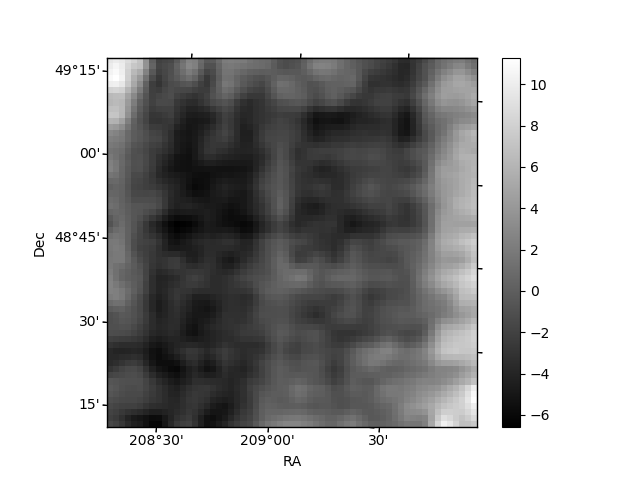
Histogram calculated using DETX and DETY for each event in the final _common_clean file
| Quadrant A | 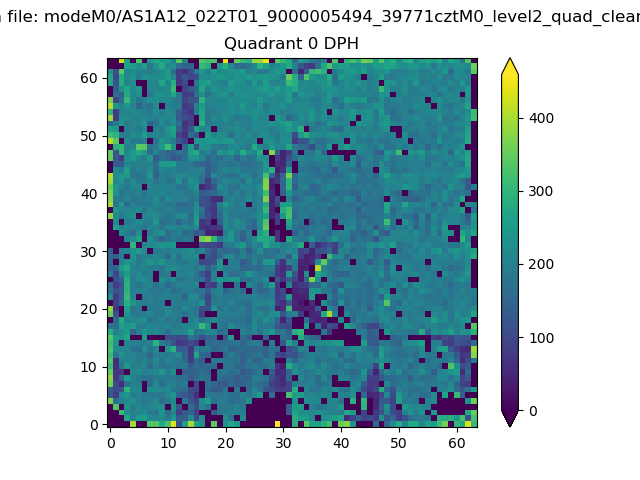 |
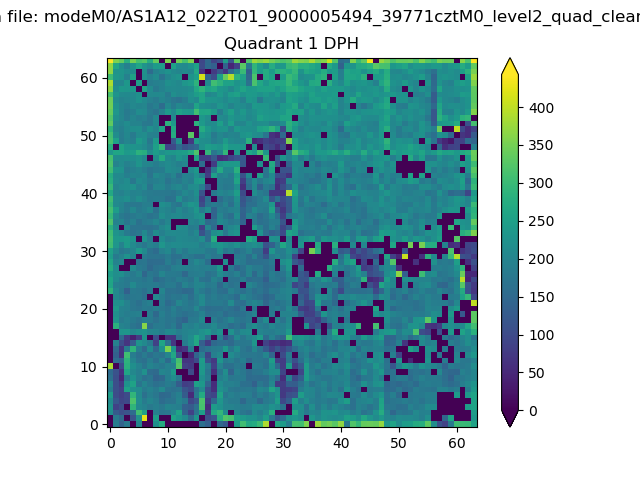 |
Quadrant B |
|---|---|---|---|
| Quadrant D | 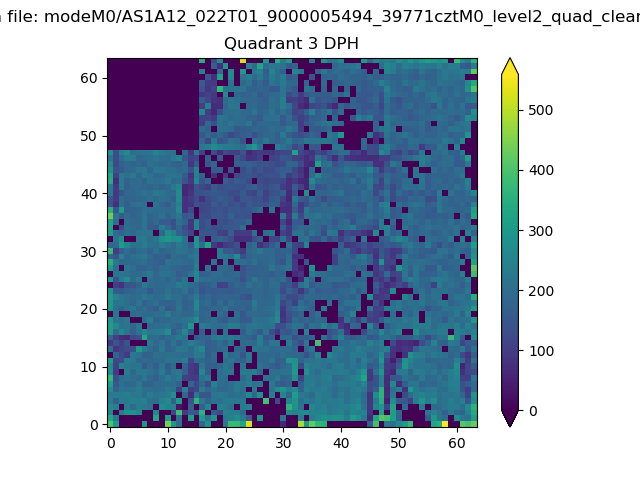 |
 |
Quadrant C |
| Plot type | Count rate plots | Images |
|---|---|---|
| Comparison with Poisson distribution Blue bars denote a histogram of data divided into 1 sec bins. Red curve is a Poisson curve with rate = median count rate of data. |
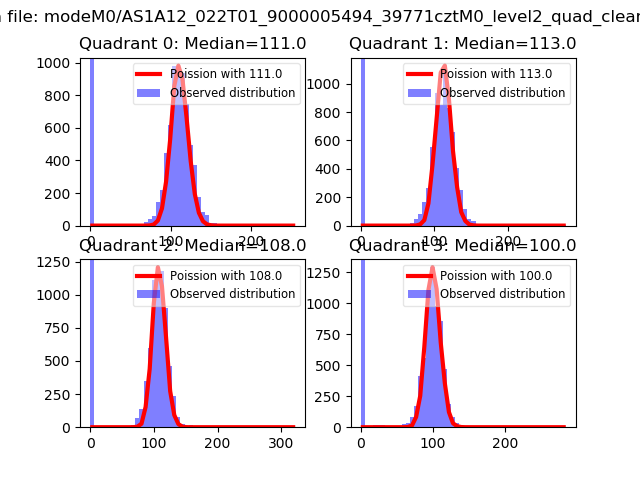 |
 |
| Quadrant-wise count rates Data is divided into 100 sec bins |
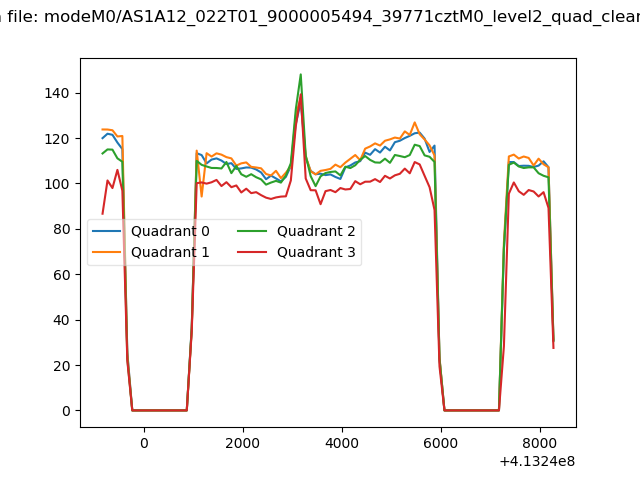 |
|
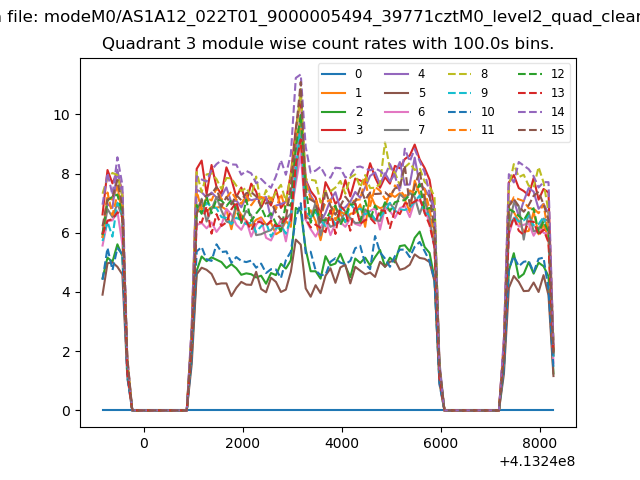
| Module-wise count rates for Quadrant A Data is divided into 100 sec bins |
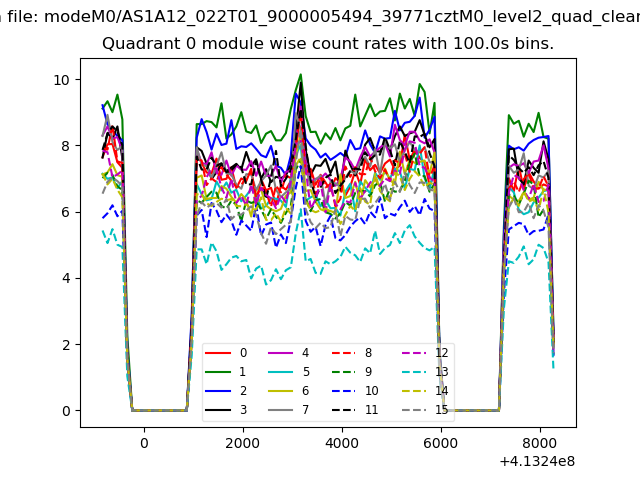 |
 |
| Module-wise count rates for Quadrant B Data is divided into 100 sec bins |
 |
 |
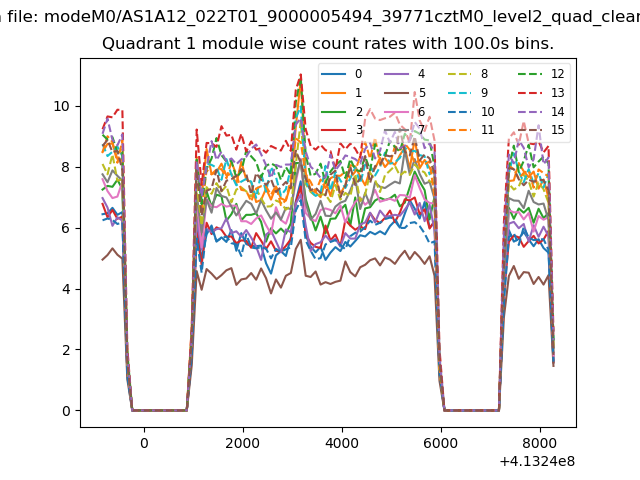
| Module-wise count rates for Quadrant C Data is divided into 100 sec bins |
 |
 |
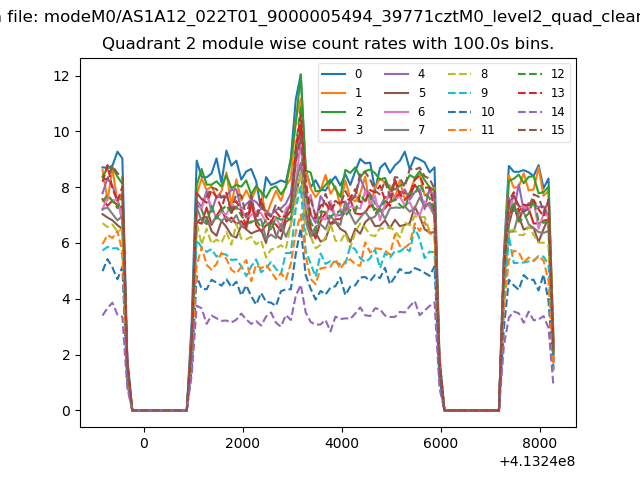
| Module-wise count rates for Quadrant D Data is divided into 100 sec bins |
 |
 |
| Parameter | Plot |
|---|---|
| CZT HV Monitor | 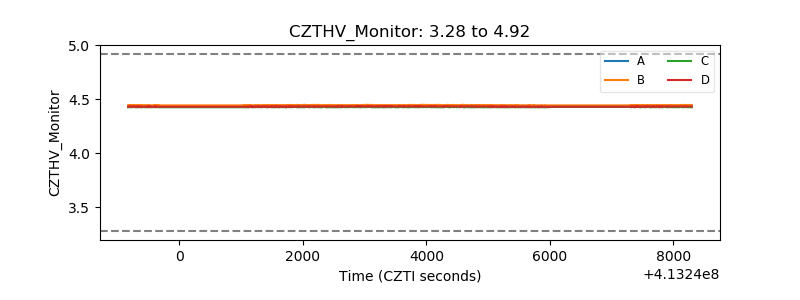 |
| D_VDD | 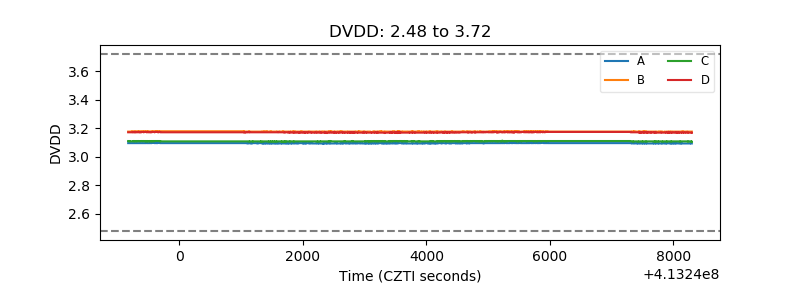 |
| Temperature 1 | 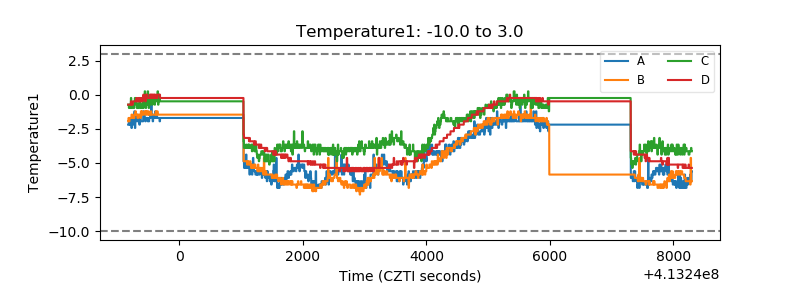 |
| Veto HV Monitor | 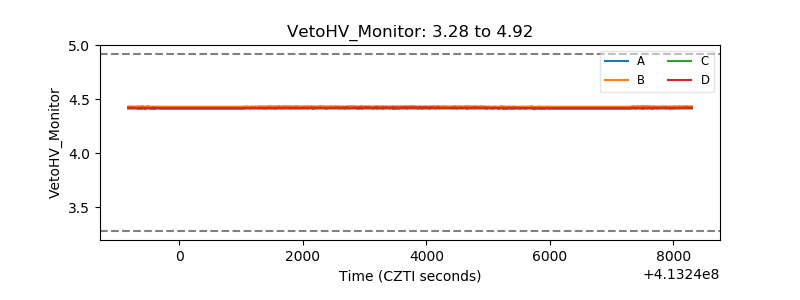 |
| Veto LLD | 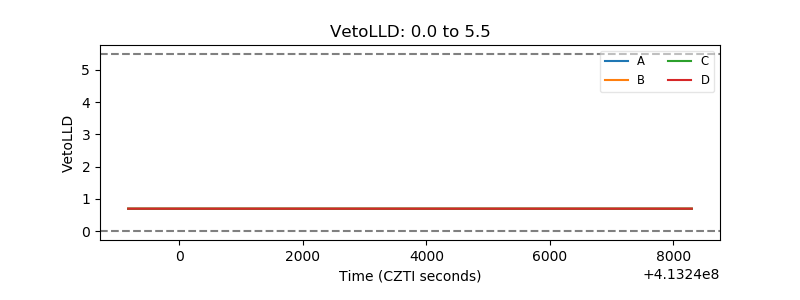 |
| Alpha Counter | 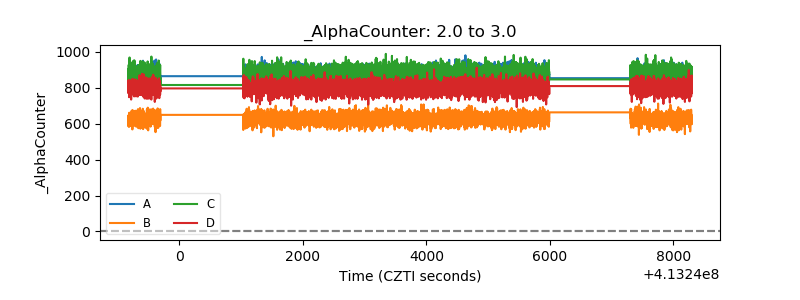 |
| _CPM_Rate | 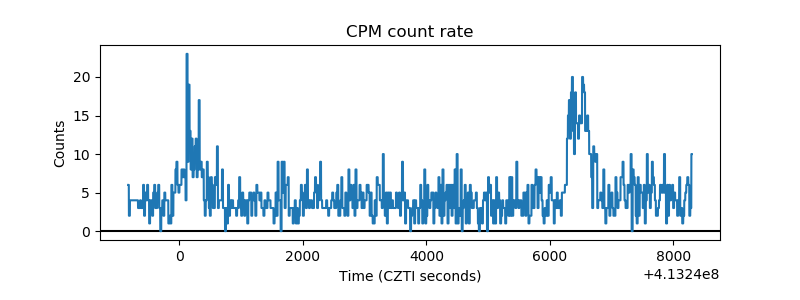 |
| CZT Counter | 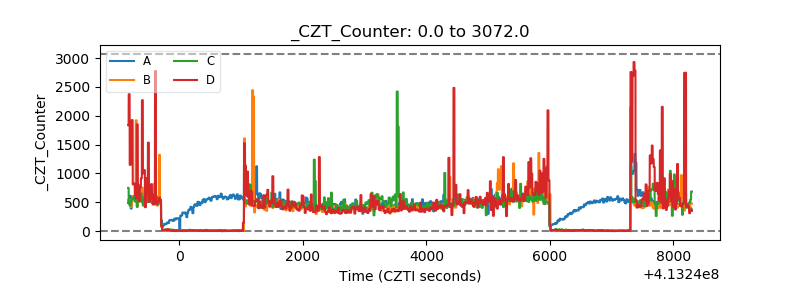 |
| +2.5 Volts monitor | 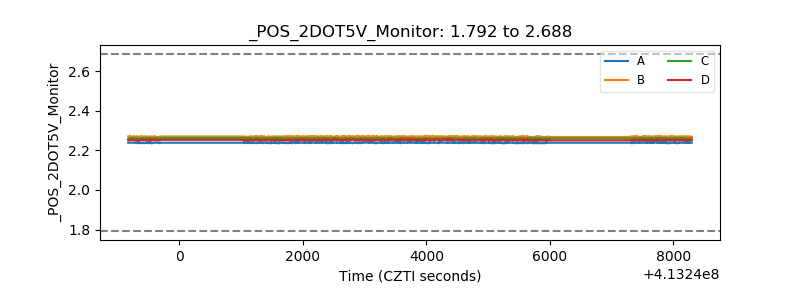 |
| +5 Volts monitor | 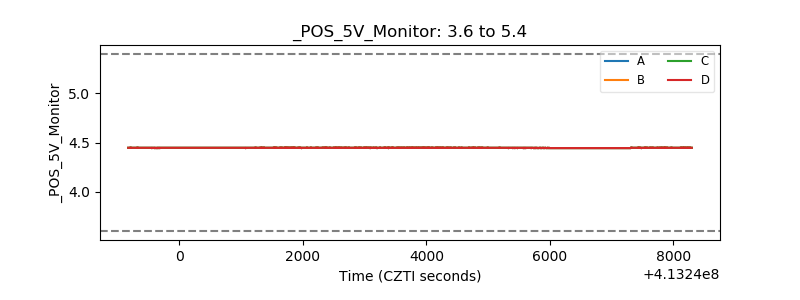 |
| _ROLL_ROT | 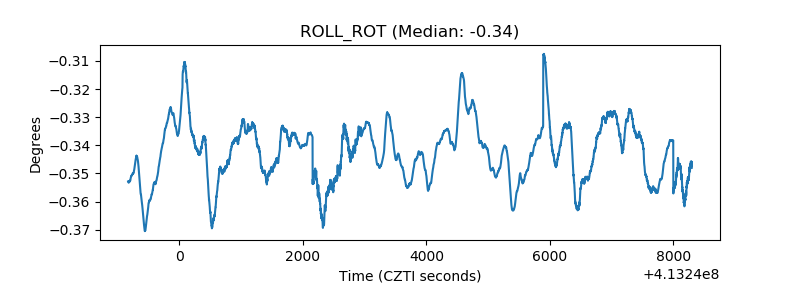 |
| _Roll_DEC | 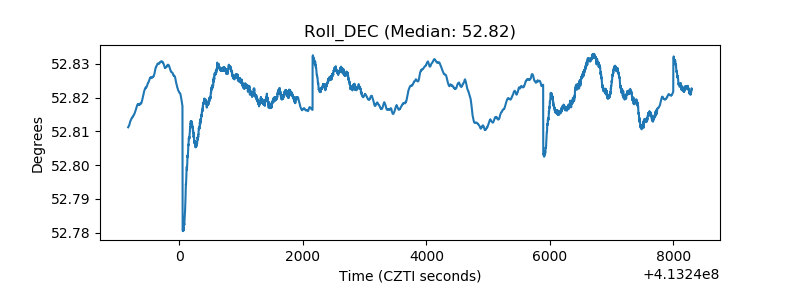 |
| _Roll_RA | 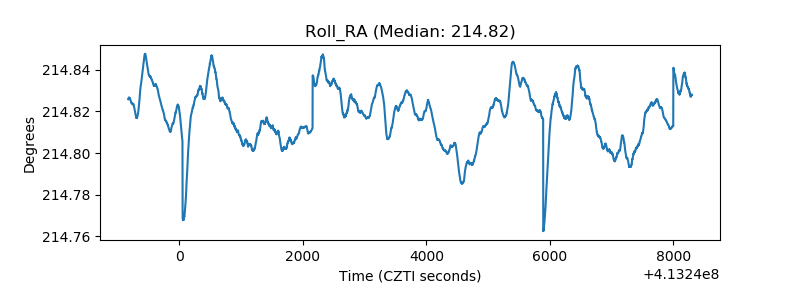 |
| Veto Counter | 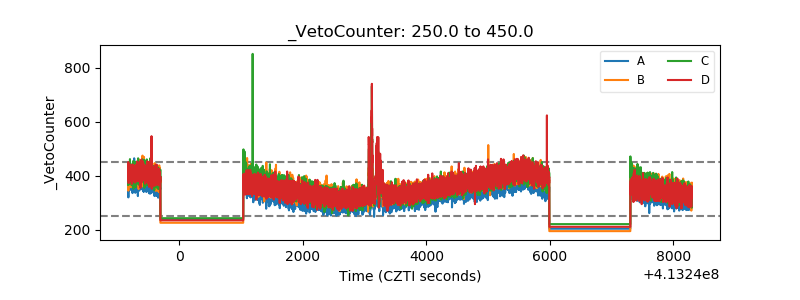 |