| Param | Original file | Final file |
|---|---|---|
| Filename | modeM0/AS1T05_086T01_9000005496_39773cztM0_level2.fits | modeM0/AS1T05_086T01_9000005496_39773cztM0_level2_quad_clean.evt |
| Size (bytes) | 171,480,960 | 43,937,280 |
| Size | 163.5 MB | 41.9 MB |
| Events in quadrant A | 1,476,935 | 293,123 |
| Events in quadrant B | 1,271,367 | 299,632 |
| Events in quadrant C | 1,893,798 | 284,933 |
| Events in quadrant D | 1,500,868 | 266,255 |
| Mode SS | |||
|---|---|---|---|
| Quadrant | BADHDUFLAG | Total packets | Discarded packets |
| A | 0 | 54 | 0 |
| B | 0 | 54 | 0 |
| C | 0 | 54 | 0 |
| D | 0 | 54 | 0 |
| Mode M9 | |||
|---|---|---|---|
| Quadrant | BADHDUFLAG | Total packets | Discarded packets |
| A | 0 | 13 | 0 |
| B | 0 | 13 | 0 |
| C | 0 | 13 | 0 |
| D | 0 | 13 | 0 |
| Mode M0 | |||
|---|---|---|---|
| Quadrant | BADHDUFLAG | Total packets | Discarded packets |
| A | 0 | 6106 | 2 |
| B | 0 | 5578 | 1 |
| C | 0 | 7324 | 1 |
| D | 0 | 6359 | 1 |
| Quadrant | Total seconds | Saturated seconds | Saturation percentage |
|---|---|---|---|
| A | 2603 | 30 | 1.152516% |
| B | 2603 | 18 | 0.691510% |
| C | 2603 | 93 | 3.572801% |
| D | 2603 | 46 | 1.767192% |
Noise dominated data is calculated using 1-second bins in cleaned event files. If a bin has >2000 counts, and if more than 50% of those come from <1% of pixels, then it is considered to be noise-dominated and hence unusable.
| Quadrant | # 1 sec bins | Bins with >0 counts | Bins with >2000 counts | High rate bins dominated by noise | Noise dominated (total time) | Noise dominated (detector-on time) | Marked lightcurve |
|---|---|---|---|---|---|---|---|
| A | 3946 | 2604 | 13 | 13 | 0.33% | 0.50% | 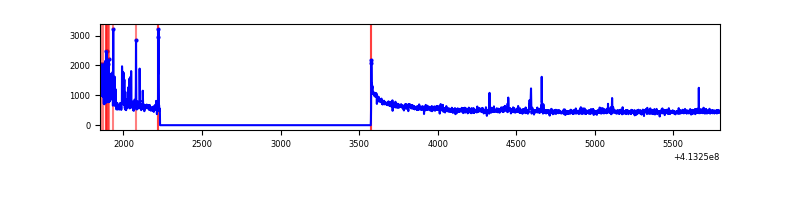 |
| B | 3946 | 2604 | 6 | 6 | 0.15% | 0.23% | 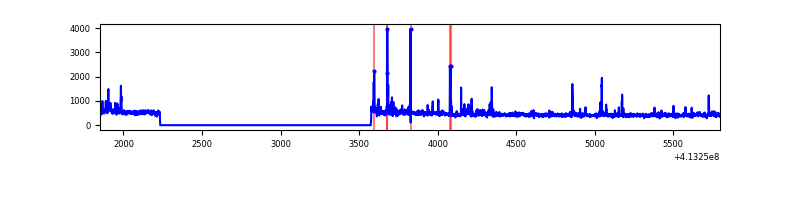 |
| C | 3946 | 2604 | 81 | 81 | 2.05% | 3.11% | 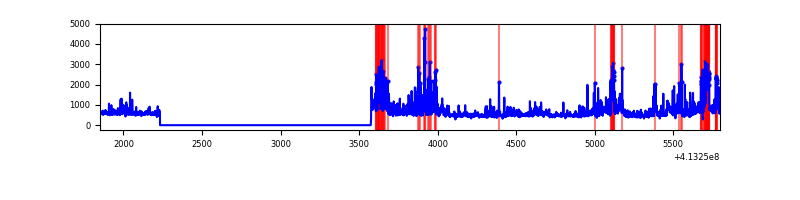 |
| D | 3946 | 2604 | 39 | 39 | 0.99% | 1.50% | 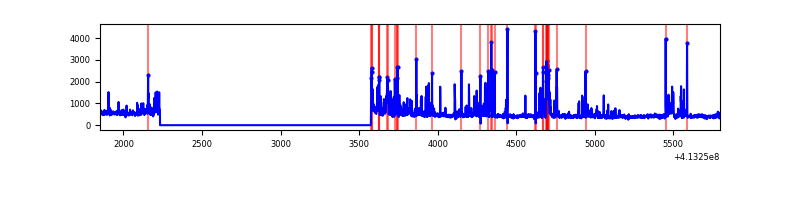 |
Top three noisy pixels from each quadrant. If the there are fewer than three noisy pixels in the level2.evt file, extra rows are filled as -1
| Pixel properties | Quadrant properties | ||||||
|---|---|---|---|---|---|---|---|
| Quadrant | DetID | PixID | Counts | Sigma | Mean | Median | Sigma |
| A | 10 | 83 | 226469 | 3770.11 | 283 | 278 | 60.0 |
| A | 13 | 248 | 123683 | 2056.89 | 283 | 278 | 60.0 |
| A | 2 | 79 | 14990 | 245.22 | 283 | 278 | 60.0 |
| B | 5 | 172 | 64463 | 1109.31 | 286 | 279 | 57.9 |
| B | 0 | 190 | 29298 | 501.54 | 286 | 279 | 57.9 |
| B | 5 | 255 | 28268 | 483.74 | 286 | 279 | 57.9 |
| C | 9 | 187 | 584699 | 8712.27 | 279 | 281 | 67.1 |
| C | 15 | 214 | 107477 | 1598.04 | 279 | 281 | 67.1 |
| C | 15 | 208 | 73777 | 1095.65 | 279 | 281 | 67.1 |
| D | 13 | 249 | 222679 | 3158.77 | 278 | 270 | 70.4 |
| D | 12 | 233 | 103634 | 1468.03 | 278 | 270 | 70.4 |
| D | 12 | 227 | 64259 | 908.8 | 278 | 270 | 70.4 |
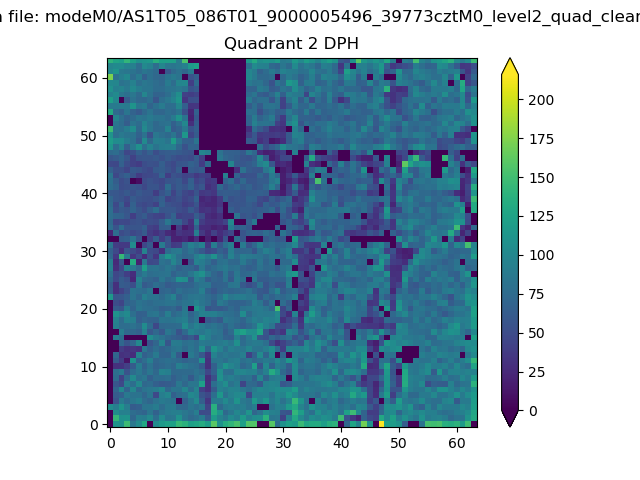
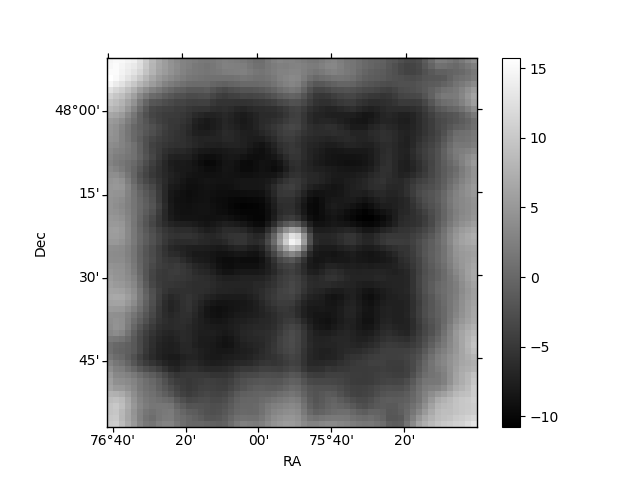
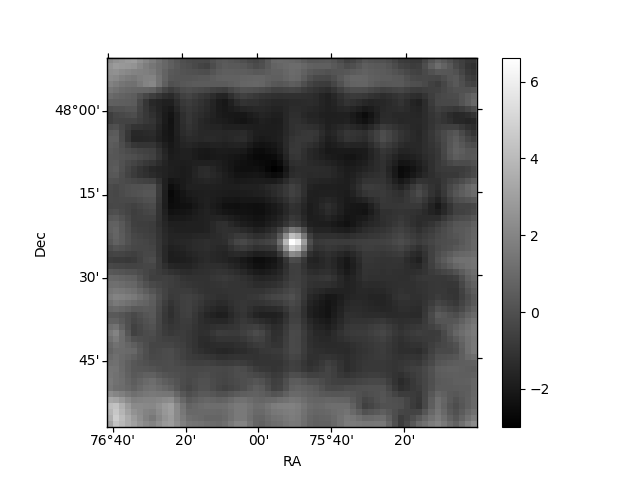
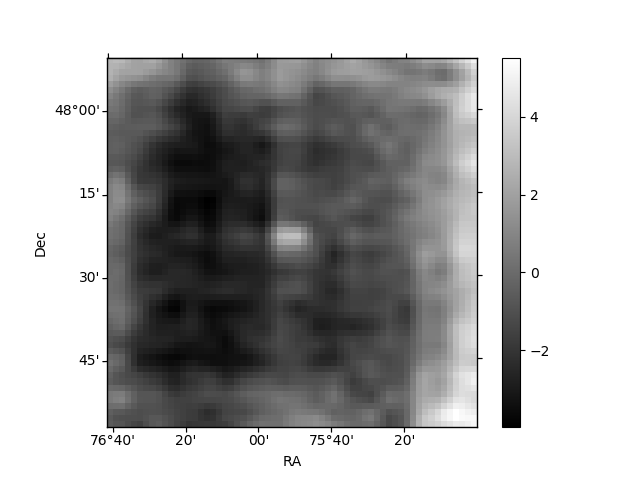
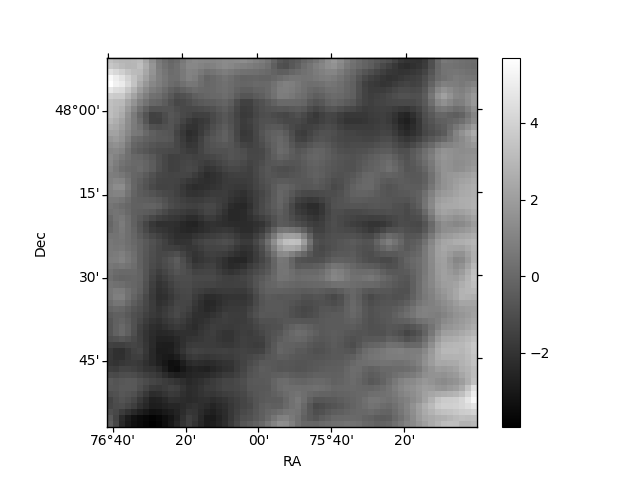
Histogram calculated using DETX and DETY for each event in the final _common_clean file
| Quadrant A | 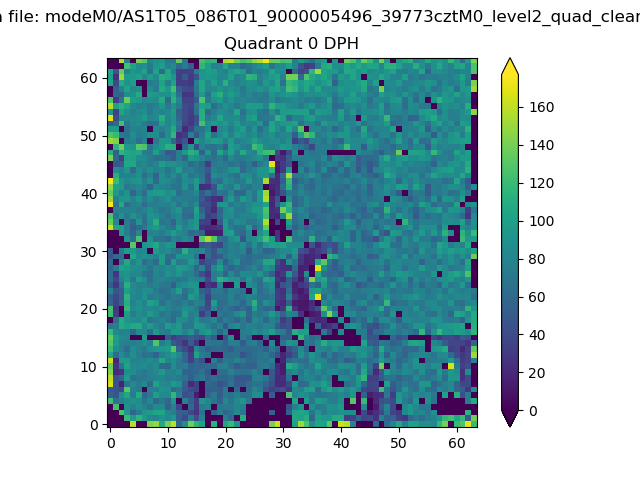 |
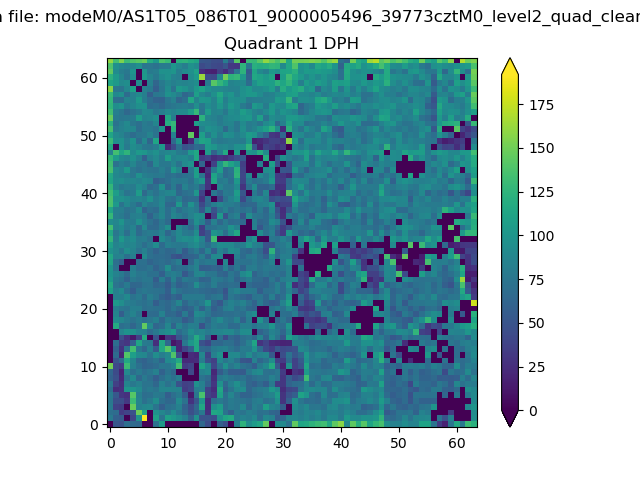 |
Quadrant B |
|---|---|---|---|
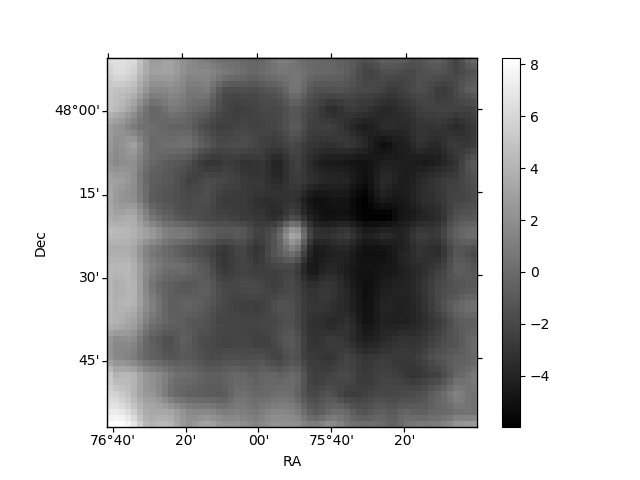
| Quadrant D | 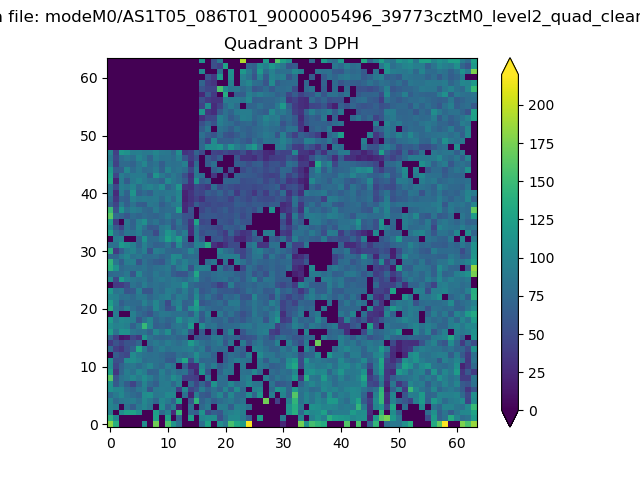 |
 |
Quadrant C |
| Plot type | Count rate plots | Images |
|---|---|---|
| Comparison with Poisson distribution Blue bars denote a histogram of data divided into 1 sec bins. Red curve is a Poisson curve with rate = median count rate of data. |
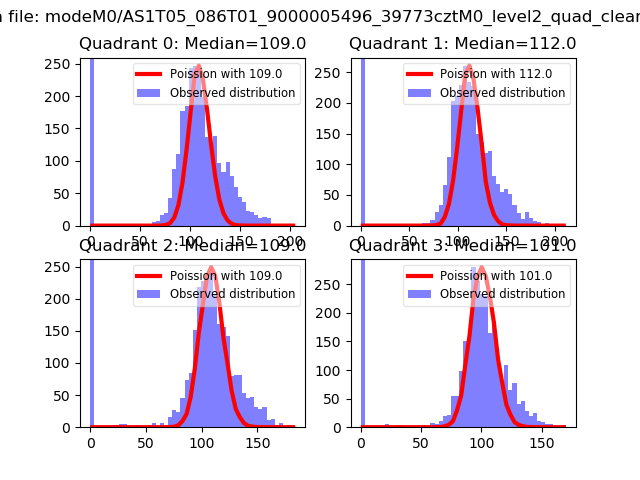 |
 |
| Quadrant-wise count rates Data is divided into 100 sec bins |
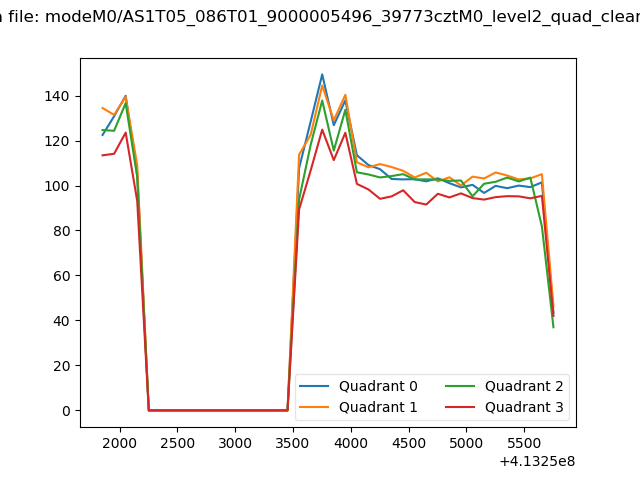 |
|
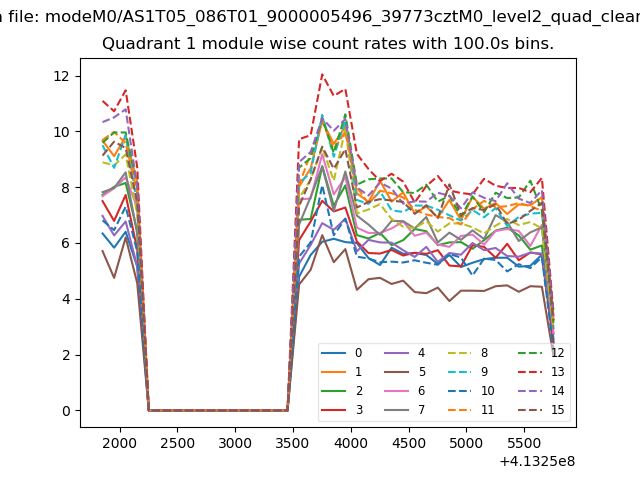
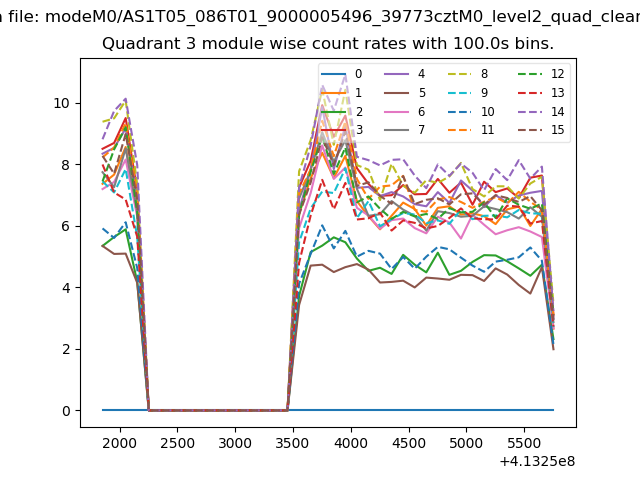
| Module-wise count rates for Quadrant A Data is divided into 100 sec bins |
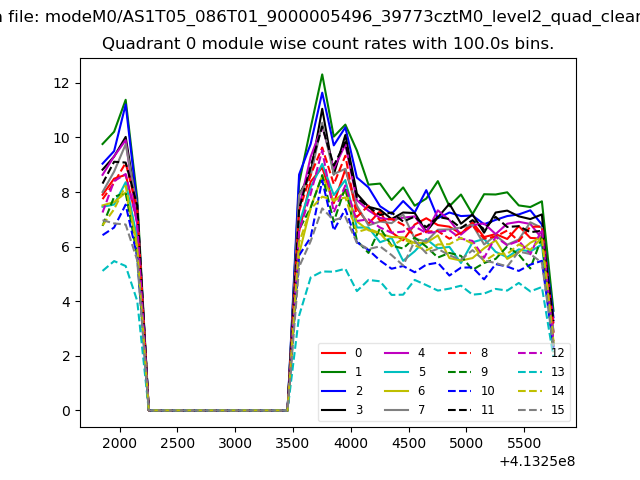 |
 |
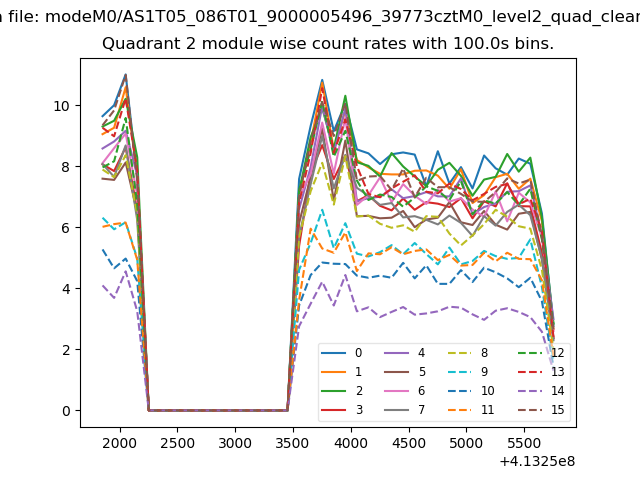
| Module-wise count rates for Quadrant B Data is divided into 100 sec bins |
 |
 |
| Module-wise count rates for Quadrant C Data is divided into 100 sec bins |
 |
 |
| Module-wise count rates for Quadrant D Data is divided into 100 sec bins |
 |
 |
| Parameter | Plot |
|---|---|
| CZT HV Monitor | 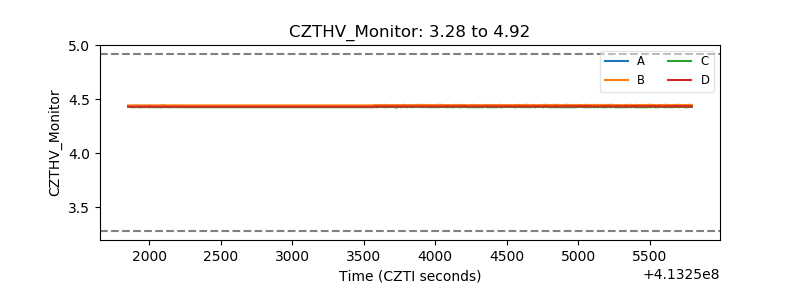 |
| D_VDD | 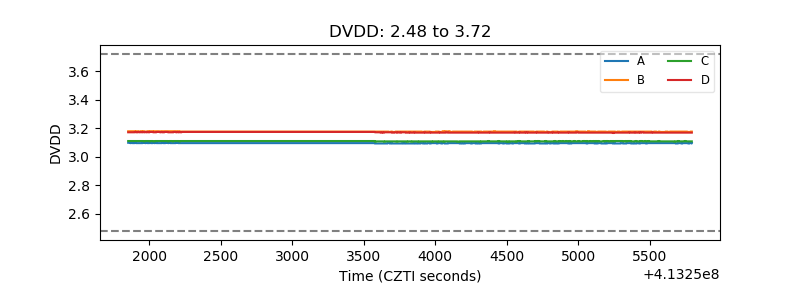 |
| Temperature 1 | 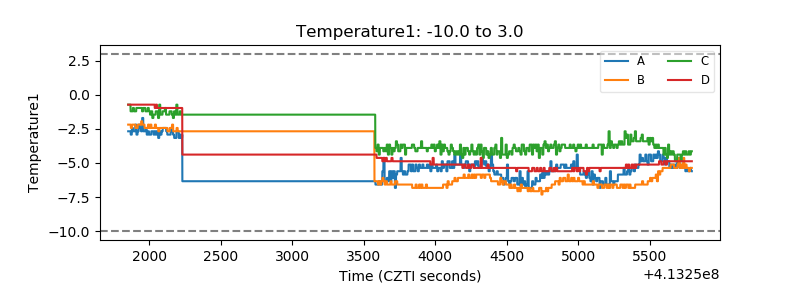 |
| Veto HV Monitor | 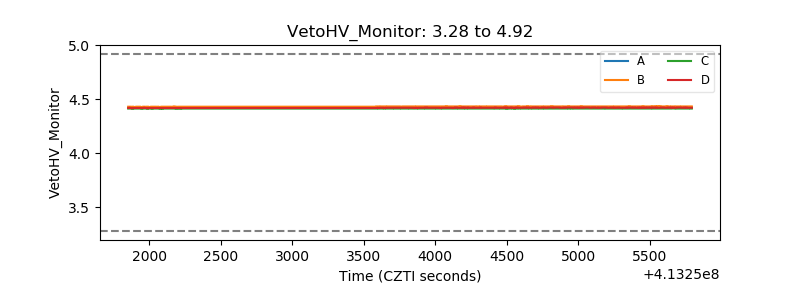 |
| Veto LLD | 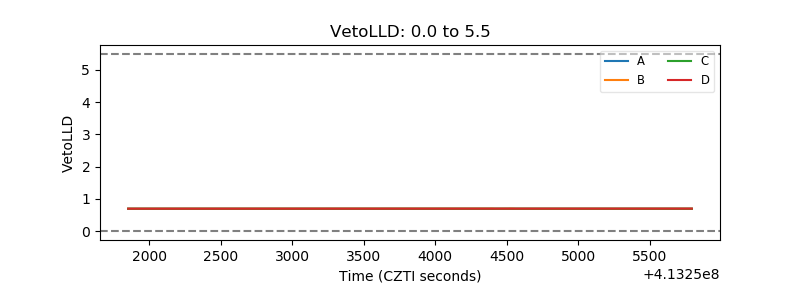 |
| Alpha Counter | 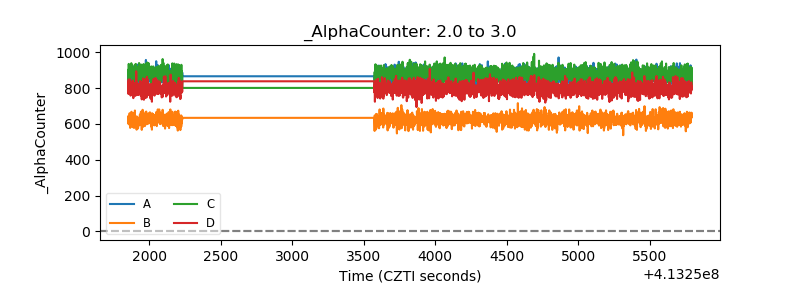 |
| _CPM_Rate | 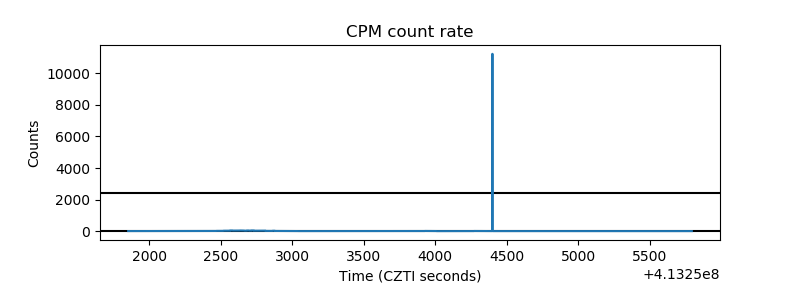 |
| CZT Counter | 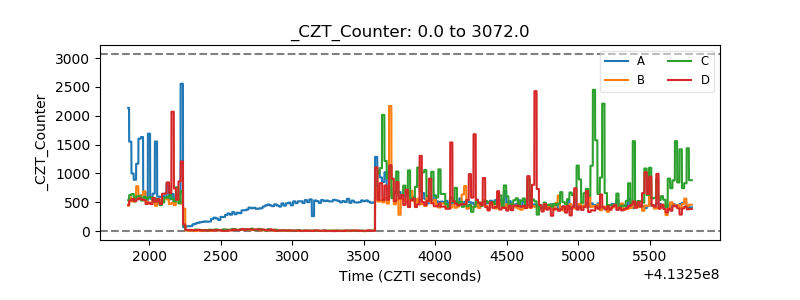 |
| +2.5 Volts monitor | 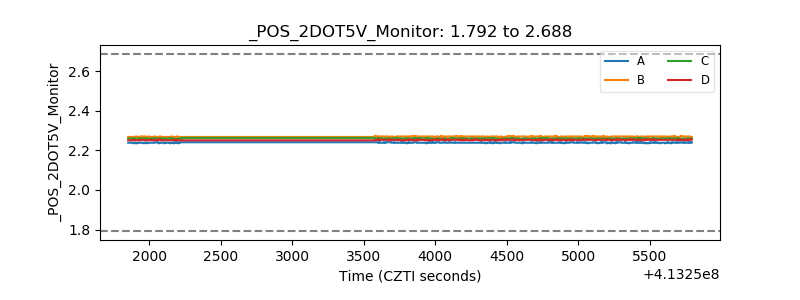 |
| +5 Volts monitor |  |
| _ROLL_ROT | 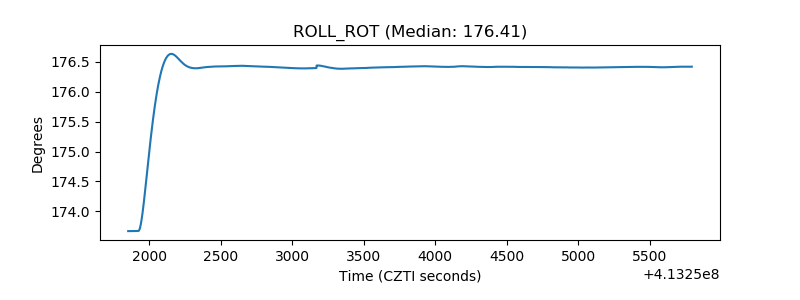 |
| _Roll_DEC | 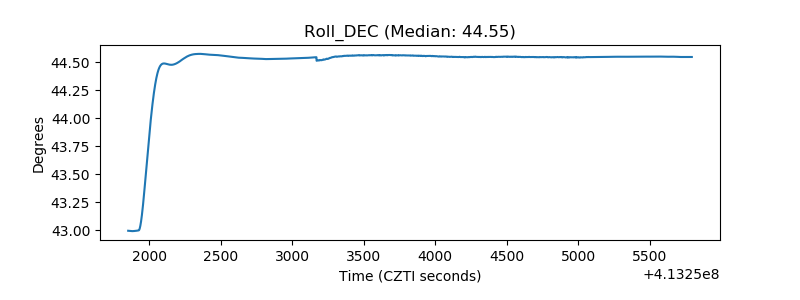 |
| _Roll_RA | 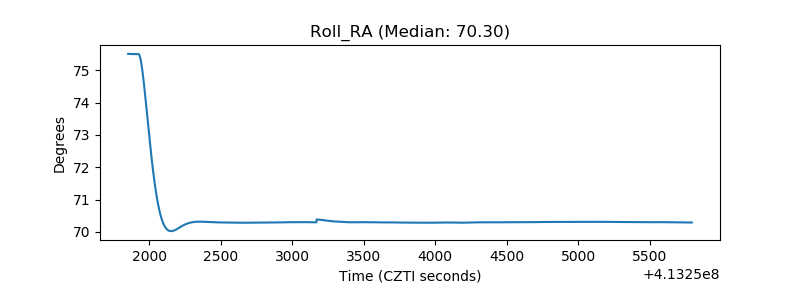 |
| Veto Counter | 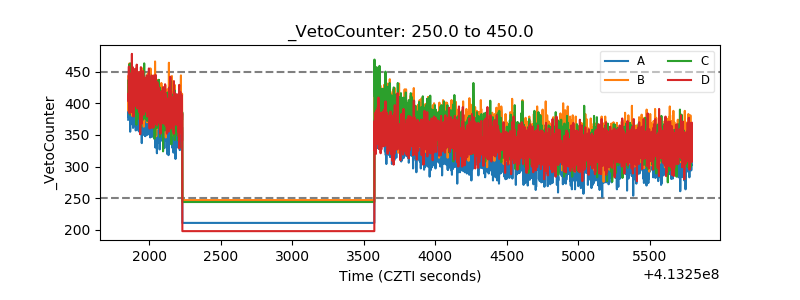 |