| Param | Original file | Final file |
|---|---|---|
| Filename | modeM0/AS1T05_086T01_9000005496_39774cztM0_level2.fits | modeM0/AS1T05_086T01_9000005496_39774cztM0_level2_quad_clean.evt |
| Size (bytes) | 706,248,000 | 151,839,360 |
| Size | 673.5 MB | 144.8 MB |
| Events in quadrant A | 5,025,032 | 1,072,018 |
| Events in quadrant B | 4,691,156 | 1,089,201 |
| Events in quadrant C | 10,551,948 | 891,955 |
| Events in quadrant D | 5,206,195 | 945,530 |
| Mode SS | |||
|---|---|---|---|
| Quadrant | BADHDUFLAG | Total packets | Discarded packets |
| A | 0 | 174 | 0 |
| B | 0 | 174 | 0 |
| C | 0 | 174 | 0 |
| D | 0 | 174 | 0 |
| Mode M9 | |||
|---|---|---|---|
| Quadrant | BADHDUFLAG | Total packets | Discarded packets |
| A | 0 | 31 | 0 |
| B | 0 | 31 | 0 |
| C | 0 | 31 | 0 |
| D | 0 | 31 | 0 |
| Mode M0 | |||
|---|---|---|---|
| Quadrant | BADHDUFLAG | Total packets | Discarded packets |
| A | 0 | 20257 | 2 |
| B | 0 | 19416 | 1 |
| C | 0 | 37339 | 1 |
| D | 0 | 21438 | 1 |
| Quadrant | Total seconds | Saturated seconds | Saturation percentage |
|---|---|---|---|
| A | 8633 | 106 | 1.227847% |
| B | 8633 | 147 | 1.702768% |
| C | 8633 | 1647 | 19.077957% |
| D | 8633 | 261 | 3.023283% |
Noise dominated data is calculated using 1-second bins in cleaned event files. If a bin has >2000 counts, and if more than 50% of those come from <1% of pixels, then it is considered to be noise-dominated and hence unusable.
| Quadrant | # 1 sec bins | Bins with >0 counts | Bins with >2000 counts | High rate bins dominated by noise | Noise dominated (total time) | Noise dominated (detector-on time) | Marked lightcurve |
|---|---|---|---|---|---|---|---|
| A | 11619 | 8635 | 61 | 61 | 0.53% | 0.71% | 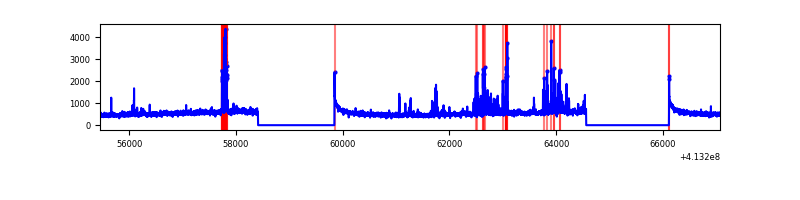 |
| B | 11619 | 8635 | 76 | 76 | 0.65% | 0.88% | 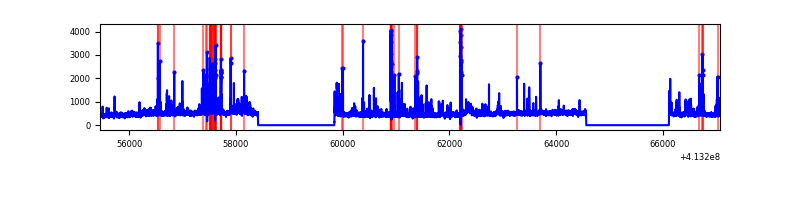 |
| C | 11619 | 8635 | 1377 | 1377 | 11.85% | 15.95% | 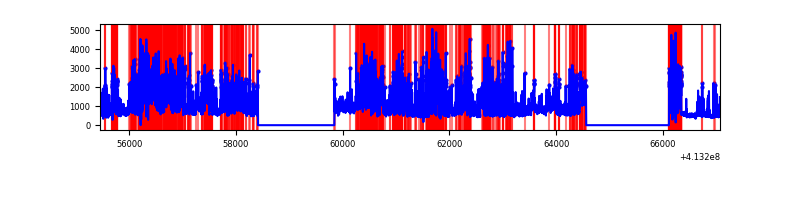 |
| D | 11619 | 8635 | 232 | 232 | 2.00% | 2.69% | 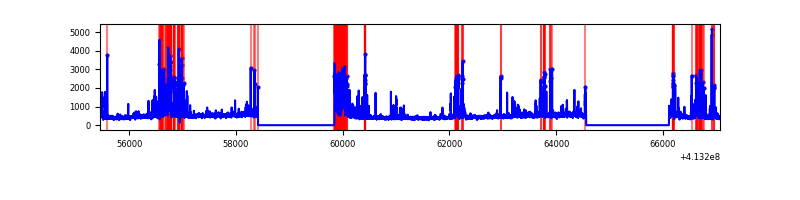 |
Top three noisy pixels from each quadrant. If the there are fewer than three noisy pixels in the level2.evt file, extra rows are filled as -1
| Pixel properties | Quadrant properties | ||||||
|---|---|---|---|---|---|---|---|
| Quadrant | DetID | PixID | Counts | Sigma | Mean | Median | Sigma |
| A | 10 | 83 | 636475 | 3003.15 | 1015 | 997 | 211.6 |
| A | 13 | 248 | 237414 | 1117.26 | 1015 | 997 | 211.6 |
| A | 2 | 79 | 186781 | 877.98 | 1015 | 997 | 211.6 |
| B | 5 | 172 | 548499 | 2759.8 | 1002 | 980 | 198.4 |
| B | 0 | 190 | 93457 | 466.14 | 1002 | 980 | 198.4 |
| B | 5 | 255 | 61220 | 303.64 | 1002 | 980 | 198.4 |
| C | 9 | 187 | 5752390 | 26248.11 | 917 | 928 | 219.1 |
| C | 15 | 208 | 555137 | 2529.26 | 917 | 928 | 219.1 |
| C | 15 | 214 | 332700 | 1514.12 | 917 | 928 | 219.1 |
| D | 12 | 233 | 907945 | 3684.29 | 980 | 954 | 246.2 |
| D | 13 | 249 | 178924 | 722.93 | 980 | 954 | 246.2 |
| D | 12 | 227 | 154209 | 622.54 | 980 | 954 | 246.2 |
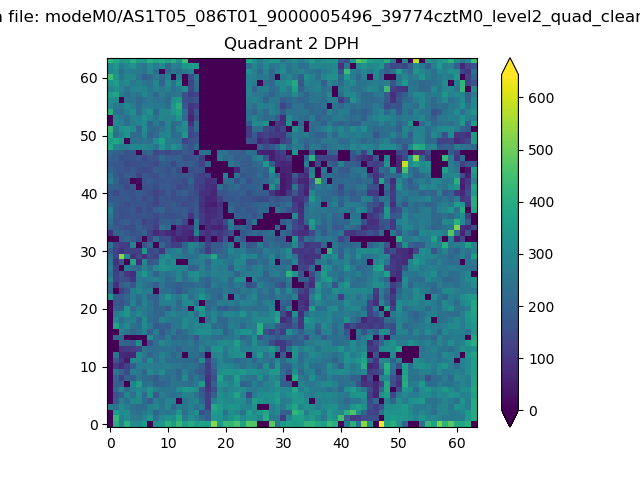
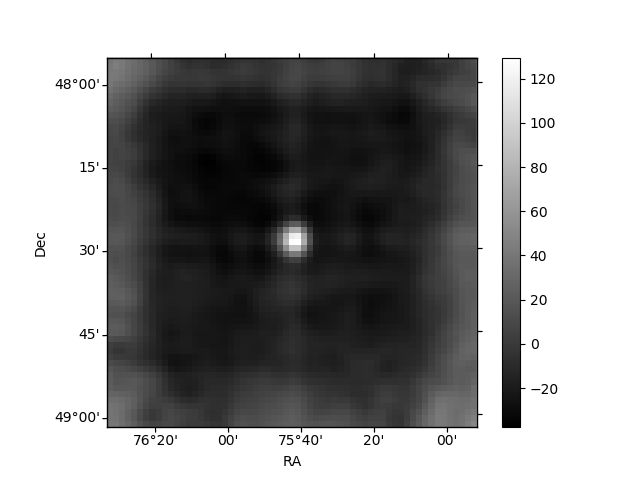
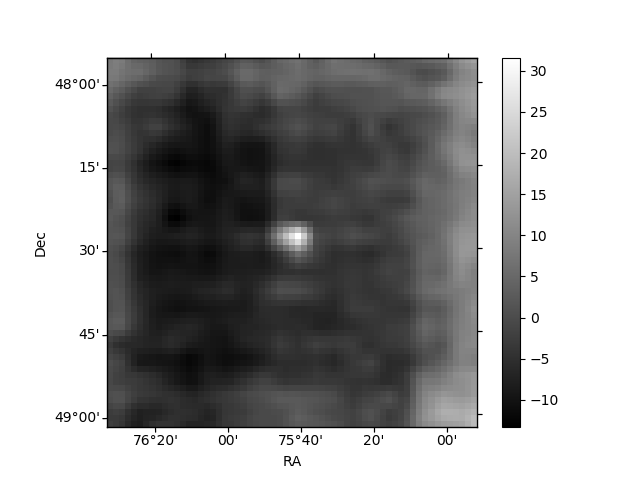
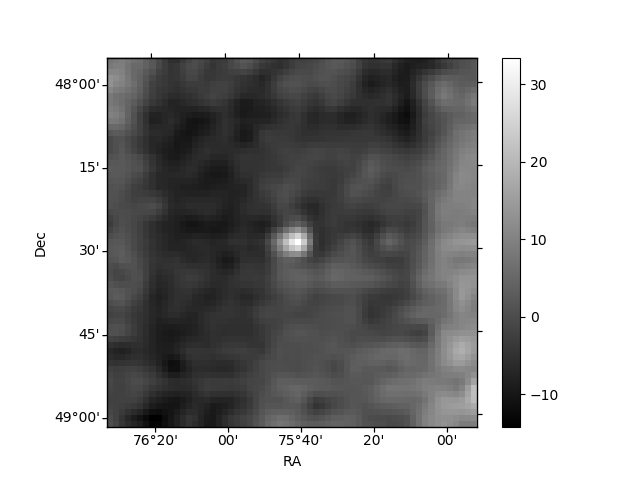
Histogram calculated using DETX and DETY for each event in the final _common_clean file
| Quadrant A | 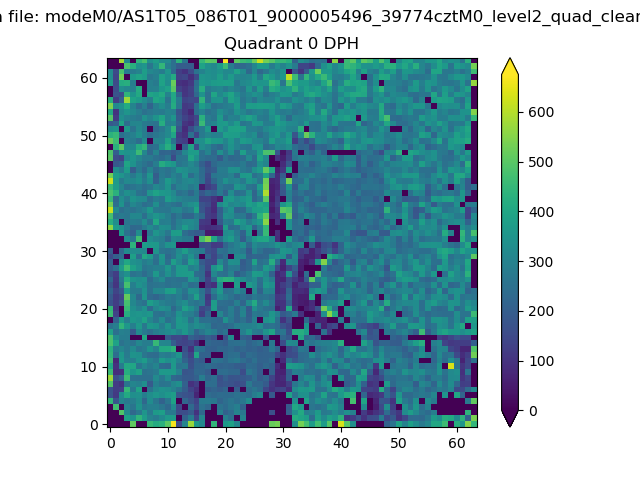 |
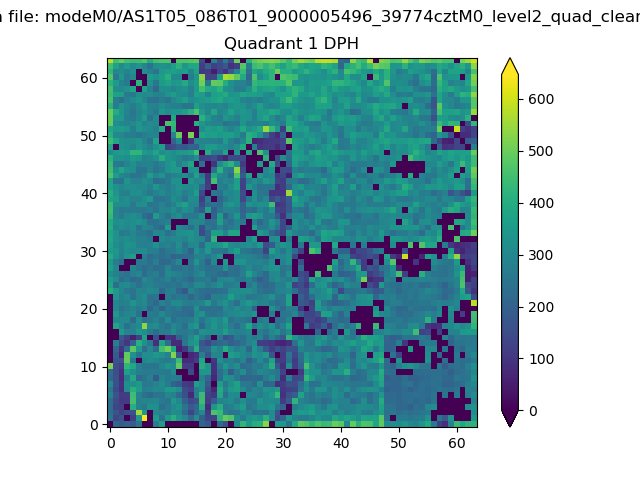 |
Quadrant B |
|---|---|---|---|
| Quadrant D | 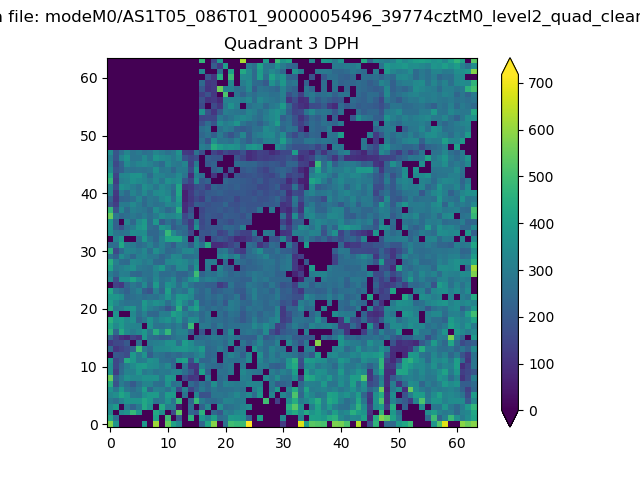 |
 |
Quadrant C |
| Plot type | Count rate plots | Images |
|---|---|---|
| Comparison with Poisson distribution Blue bars denote a histogram of data divided into 1 sec bins. Red curve is a Poisson curve with rate = median count rate of data. |
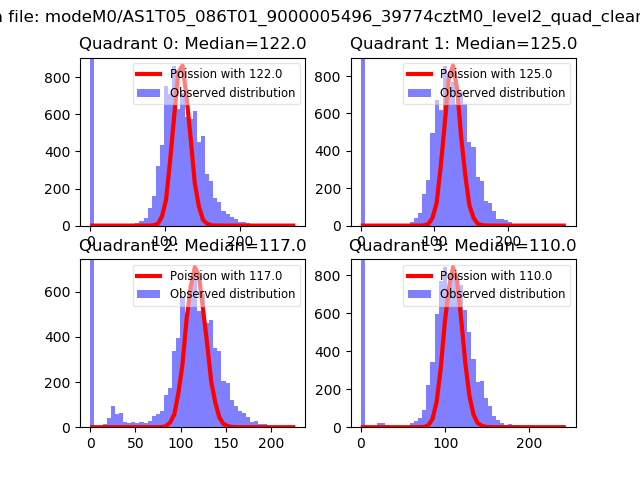 |
 |
| Quadrant-wise count rates Data is divided into 100 sec bins |
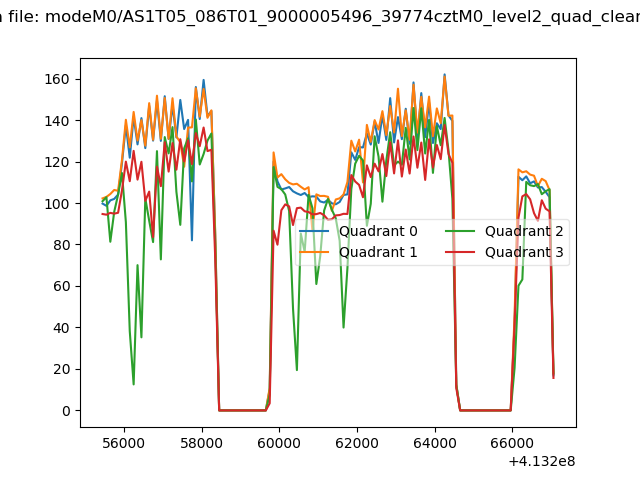 |
|
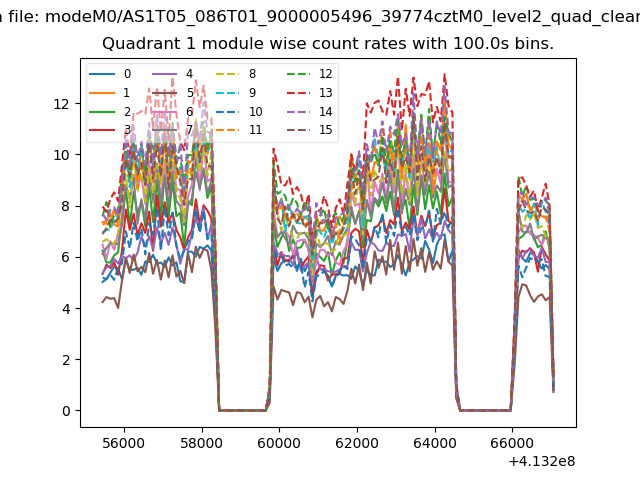
| Module-wise count rates for Quadrant A Data is divided into 100 sec bins |
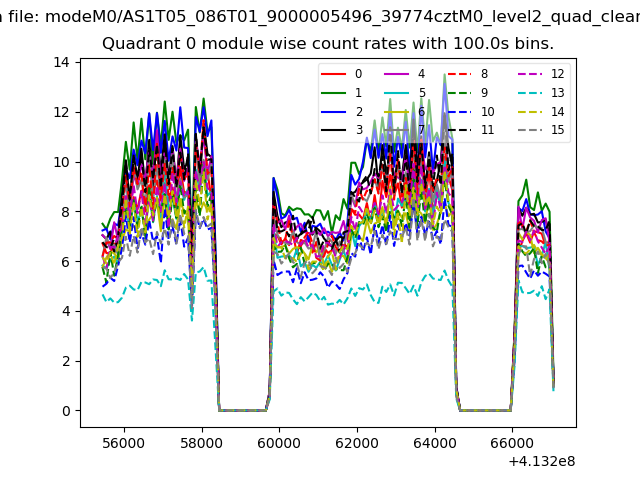 |
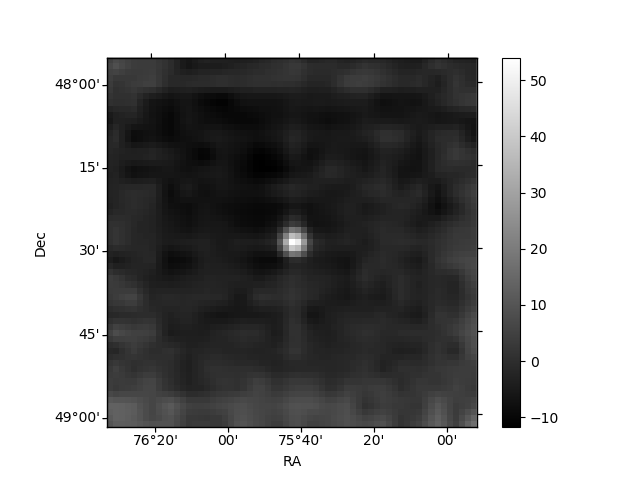 |
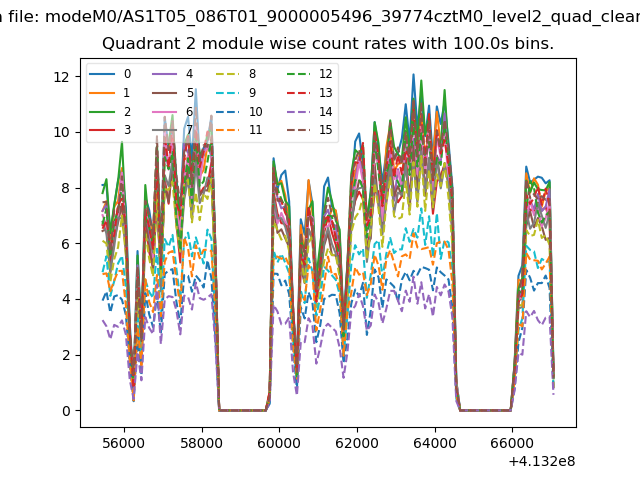
| Module-wise count rates for Quadrant B Data is divided into 100 sec bins |
 |
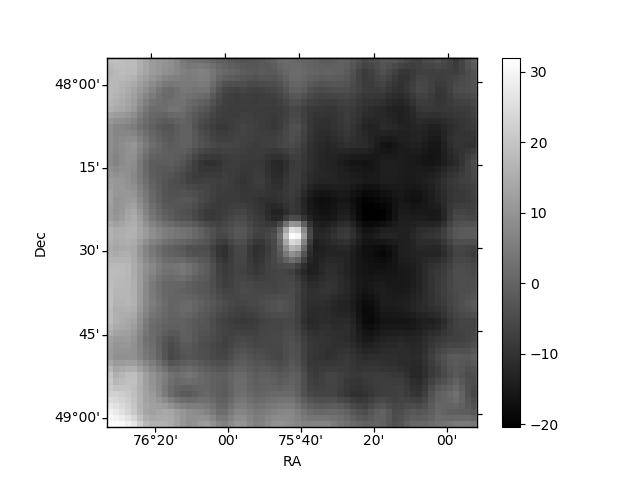 |
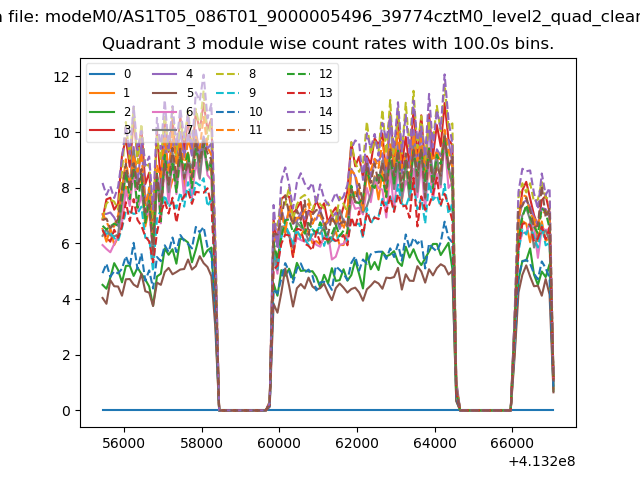
| Module-wise count rates for Quadrant C Data is divided into 100 sec bins |
 |
 |
| Module-wise count rates for Quadrant D Data is divided into 100 sec bins |
 |
 |
| Parameter | Plot |
|---|---|
| CZT HV Monitor | 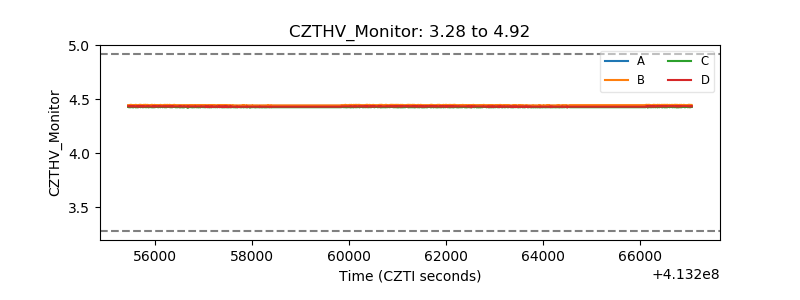 |
| D_VDD | 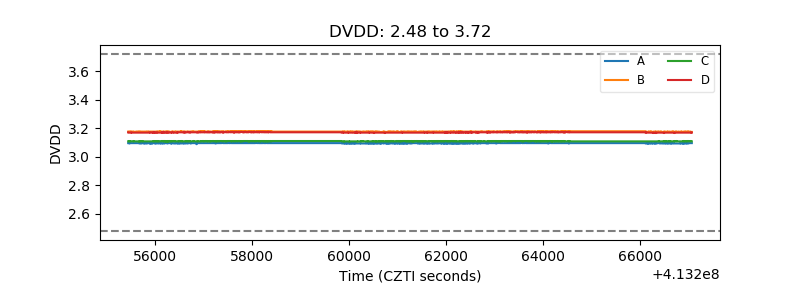 |
| Temperature 1 | 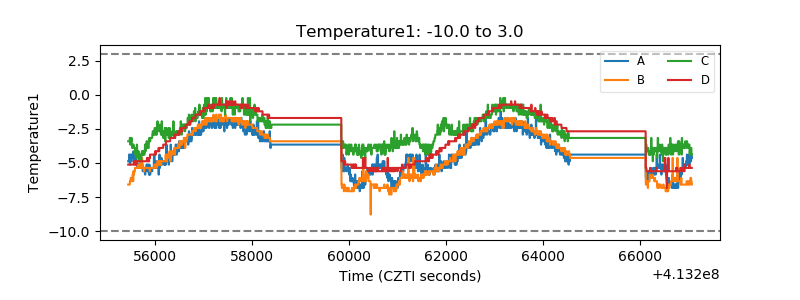 |
| Veto HV Monitor | 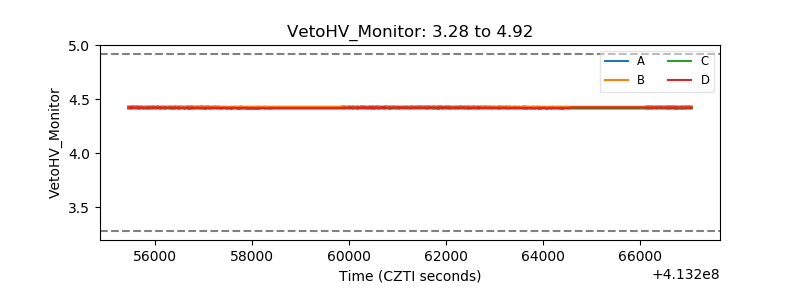 |
| Veto LLD | 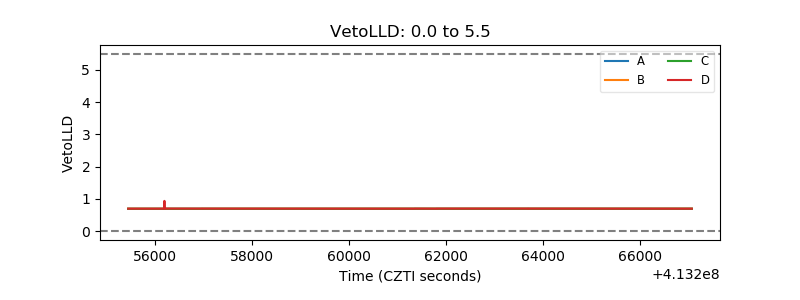 |
| Alpha Counter | 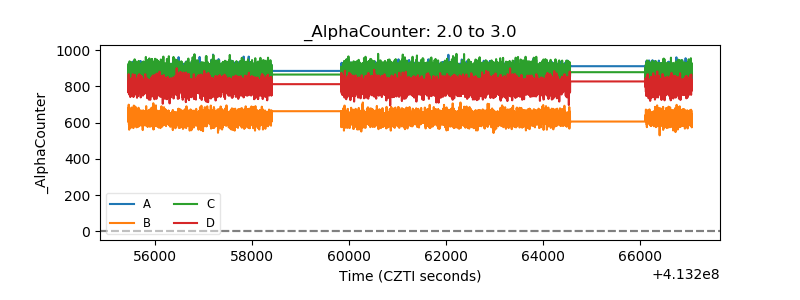 |
| _CPM_Rate | 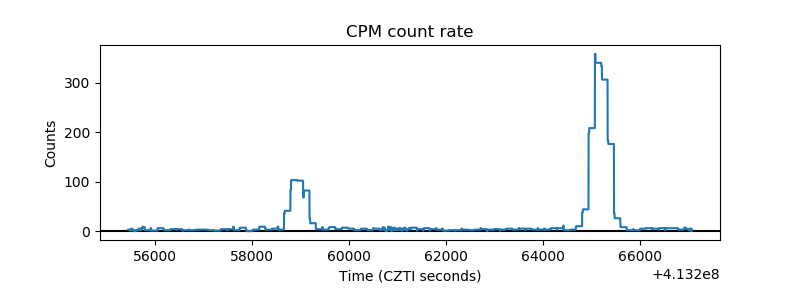 |
| CZT Counter | 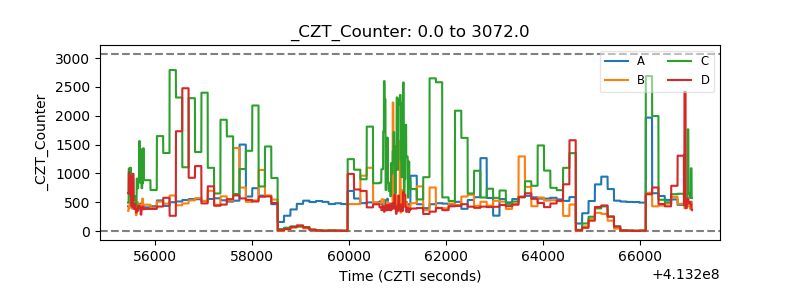 |
| +2.5 Volts monitor | 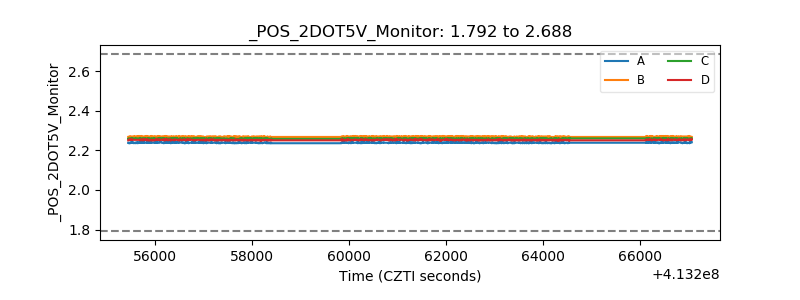 |
| +5 Volts monitor |  |
| _ROLL_ROT | 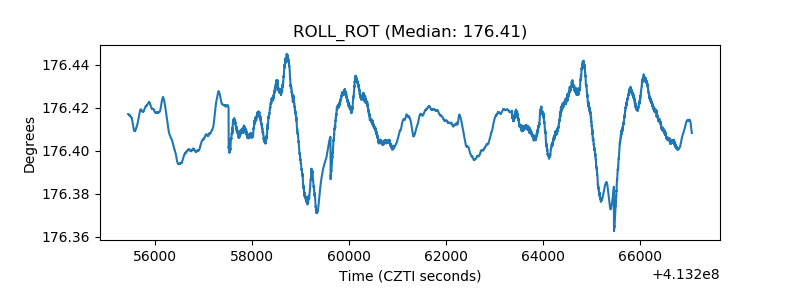 |
| _Roll_DEC | 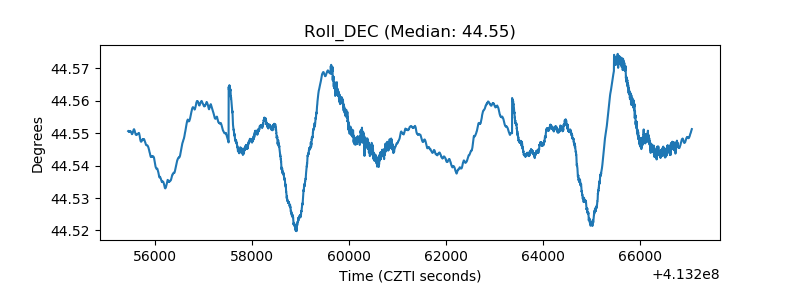 |
| _Roll_RA | 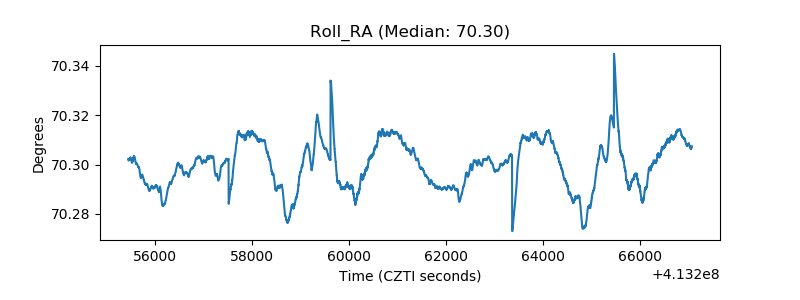 |
| Veto Counter | 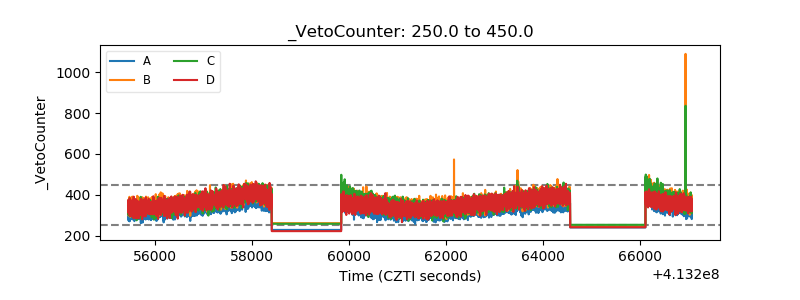 |