| Param | Original file | Final file |
|---|---|---|
| Filename | modeM0/AS1T05_086T01_9000005496_39775cztM0_level2.fits | modeM0/AS1T05_086T01_9000005496_39775cztM0_level2_quad_clean.evt |
| Size (bytes) | 411,428,160 | 99,861,120 |
| Size | 392.4 MB | 95.2 MB |
| Events in quadrant A | 2,996,769 | 695,598 |
| Events in quadrant B | 2,941,689 | 706,604 |
| Events in quadrant C | 5,716,037 | 621,494 |
| Events in quadrant D | 3,144,353 | 612,396 |
| Mode SS | |||
|---|---|---|---|
| Quadrant | BADHDUFLAG | Total packets | Discarded packets |
| A | 0 | 112 | 0 |
| B | 0 | 112 | 0 |
| C | 0 | 112 | 0 |
| D | 0 | 112 | 0 |
| Mode M9 | |||
|---|---|---|---|
| Quadrant | BADHDUFLAG | Total packets | Discarded packets |
| A | 0 | 29 | 0 |
| B | 0 | 29 | 0 |
| C | 0 | 29 | 0 |
| D | 0 | 30 | 0 |
| Mode M0 | |||
|---|---|---|---|
| Quadrant | BADHDUFLAG | Total packets | Discarded packets |
| A | 0 | 12093 | 2 |
| B | 0 | 12221 | 1 |
| C | 0 | 20803 | 1 |
| D | 0 | 13206 | 1 |
| Quadrant | Total seconds | Saturated seconds | Saturation percentage |
|---|---|---|---|
| A | 5544 | 12 | 0.216450% |
| B | 5544 | 42 | 0.757576% |
| C | 5544 | 603 | 10.876623% |
| D | 5544 | 80 | 1.443001% |
Noise dominated data is calculated using 1-second bins in cleaned event files. If a bin has >2000 counts, and if more than 50% of those come from <1% of pixels, then it is considered to be noise-dominated and hence unusable.
| Quadrant | # 1 sec bins | Bins with >0 counts | Bins with >2000 counts | High rate bins dominated by noise | Noise dominated (total time) | Noise dominated (detector-on time) | Marked lightcurve |
|---|---|---|---|---|---|---|---|
| A | 7218 | 5545 | 4 | 4 | 0.06% | 0.07% | 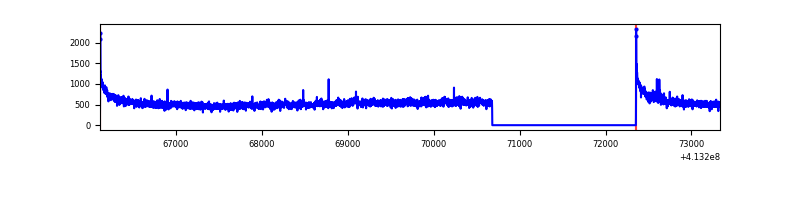 |
| B | 7218 | 5545 | 24 | 24 | 0.33% | 0.43% | 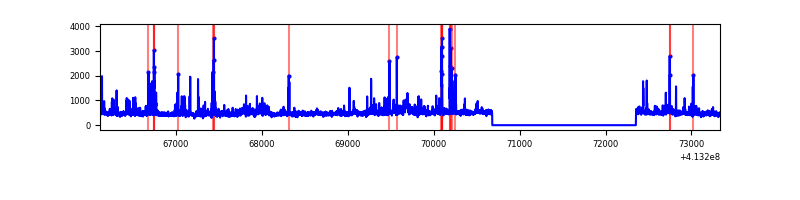 |
| C | 7218 | 5545 | 539 | 539 | 7.47% | 9.72% | 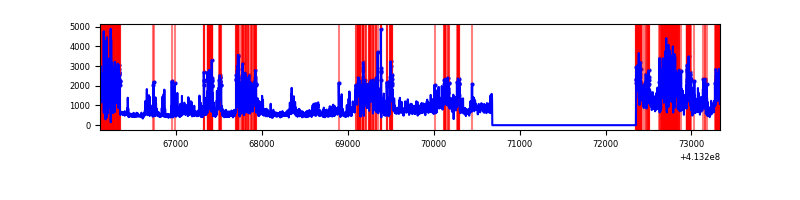 |
| D | 7218 | 5545 | 68 | 68 | 0.94% | 1.23% | 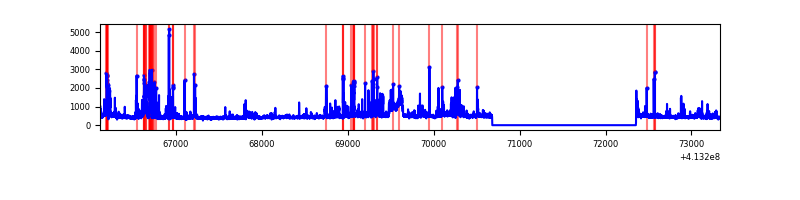 |
Top three noisy pixels from each quadrant. If the there are fewer than three noisy pixels in the level2.evt file, extra rows are filled as -1
| Pixel properties | Quadrant properties | ||||||
|---|---|---|---|---|---|---|---|
| Quadrant | DetID | PixID | Counts | Sigma | Mean | Median | Sigma |
| A | 10 | 83 | 466030 | 3444.01 | 649 | 639 | 135.1 |
| A | 2 | 79 | 15656 | 111.13 | 649 | 639 | 135.1 |
| A | 13 | 6 | 8900 | 61.13 | 649 | 639 | 135.1 |
| B | 5 | 172 | 276571 | 2151.68 | 643 | 627 | 128.2 |
| B | 0 | 190 | 99072 | 767.63 | 643 | 627 | 128.2 |
| B | 4 | 170 | 19523 | 147.34 | 643 | 627 | 128.2 |
| C | 15 | 208 | 1777439 | 12345.87 | 606 | 613 | 143.9 |
| C | 9 | 187 | 1207533 | 8386.01 | 606 | 613 | 143.9 |
| C | 15 | 214 | 223774 | 1550.58 | 606 | 613 | 143.9 |
| D | 12 | 233 | 332652 | 2114.01 | 626 | 611 | 157.1 |
| D | 12 | 227 | 114168 | 722.98 | 626 | 611 | 157.1 |
| D | 13 | 171 | 111890 | 708.48 | 626 | 611 | 157.1 |
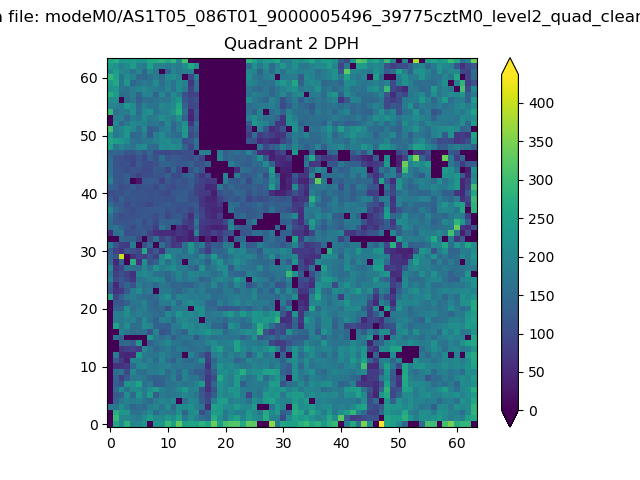
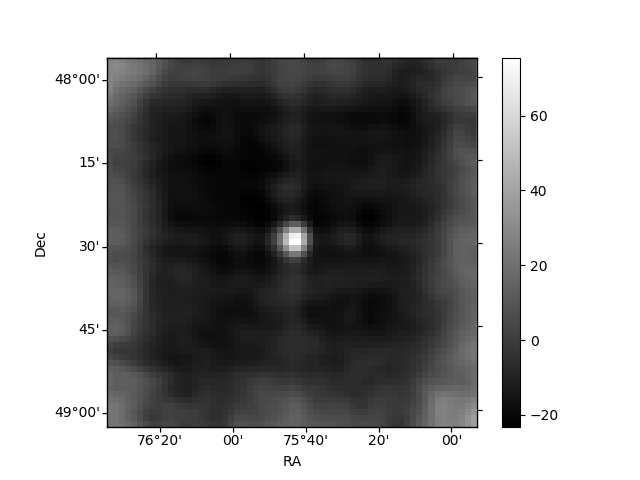
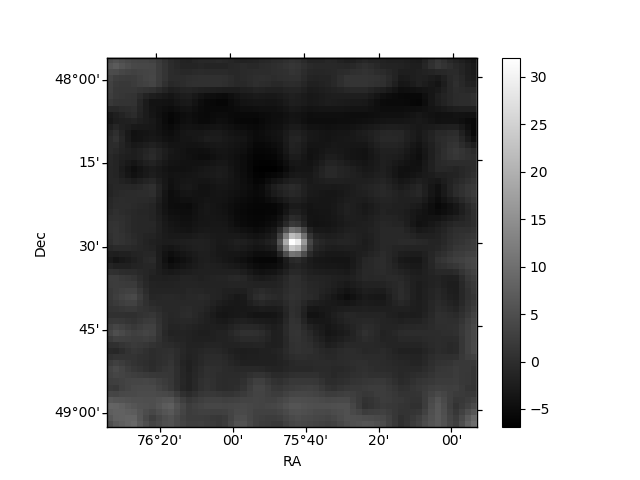
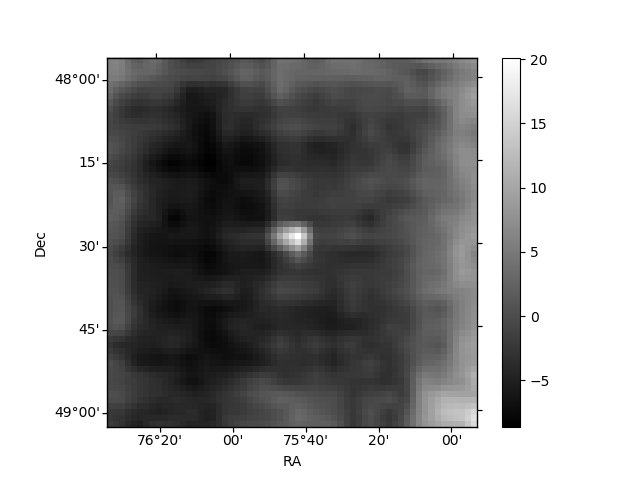
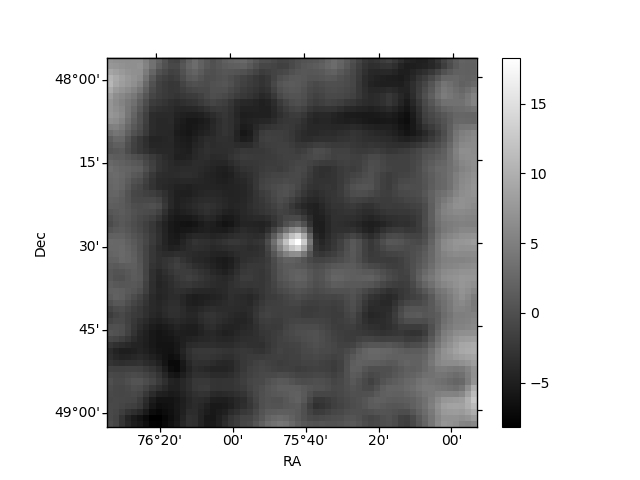
Histogram calculated using DETX and DETY for each event in the final _common_clean file
| Quadrant A | 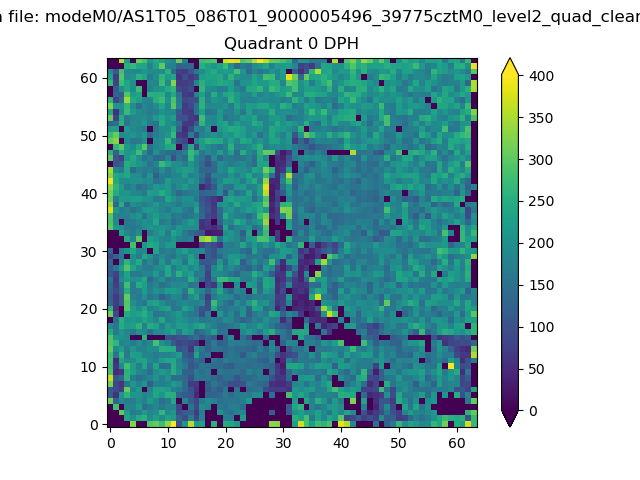 |
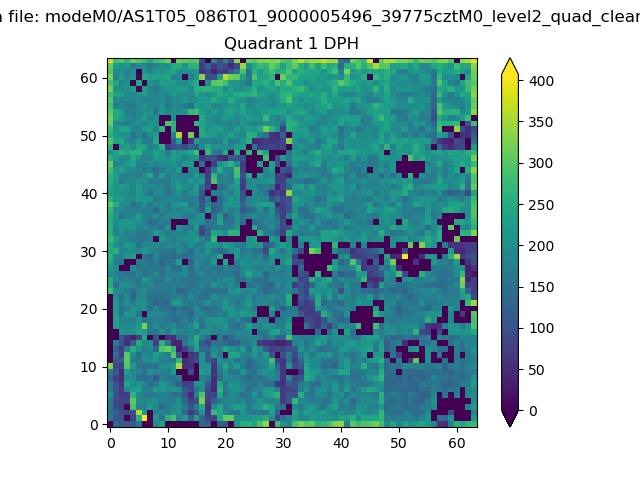 |
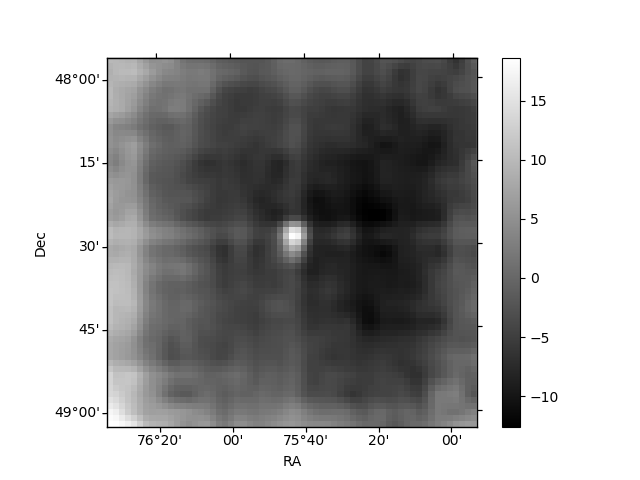
Quadrant B |
|---|---|---|---|
| Quadrant D | 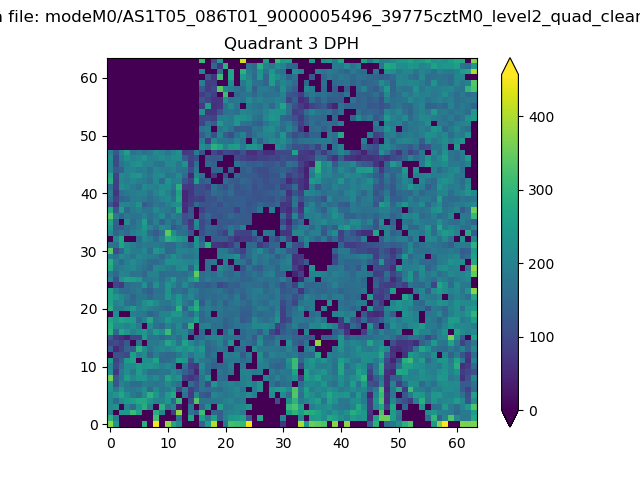 |
 |
Quadrant C |
| Plot type | Count rate plots | Images |
|---|---|---|
| Comparison with Poisson distribution Blue bars denote a histogram of data divided into 1 sec bins. Red curve is a Poisson curve with rate = median count rate of data. |
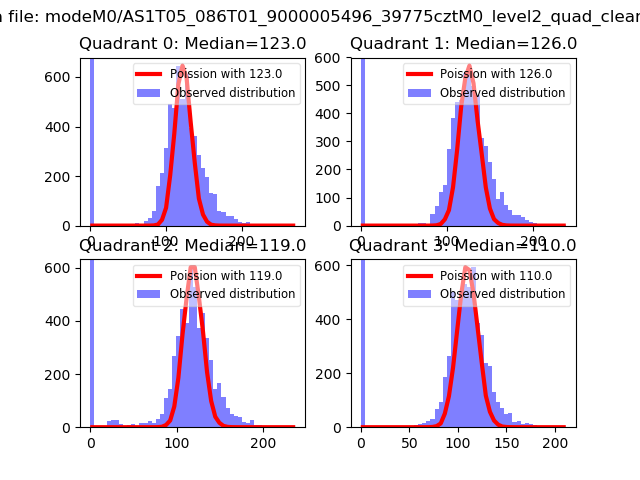 |
 |
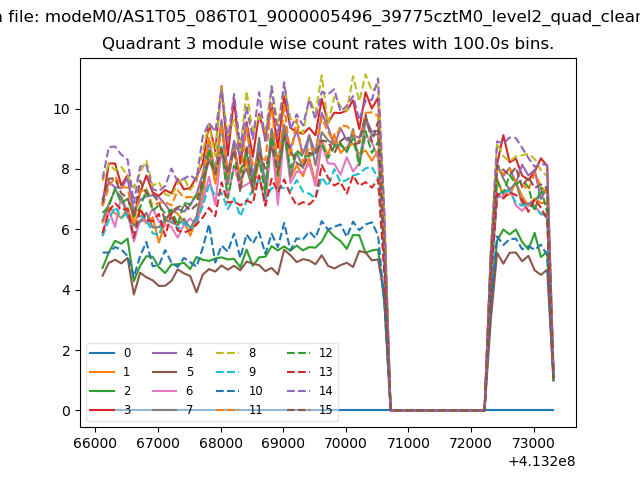
| Quadrant-wise count rates Data is divided into 100 sec bins |
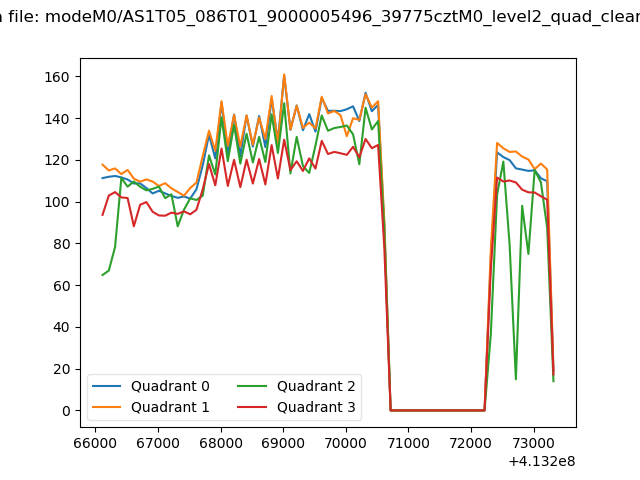 |
|
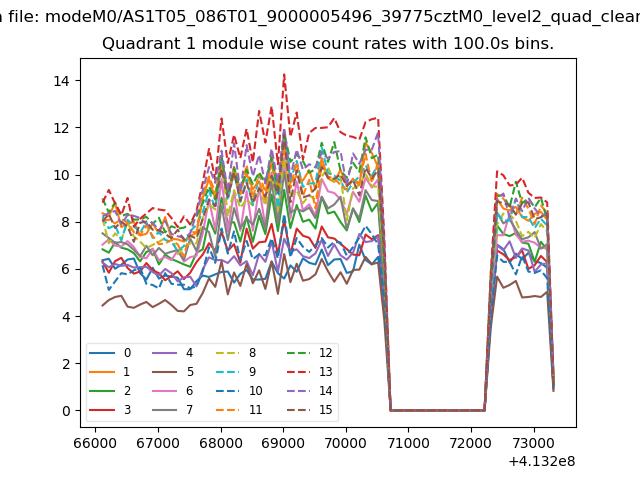
| Module-wise count rates for Quadrant A Data is divided into 100 sec bins |
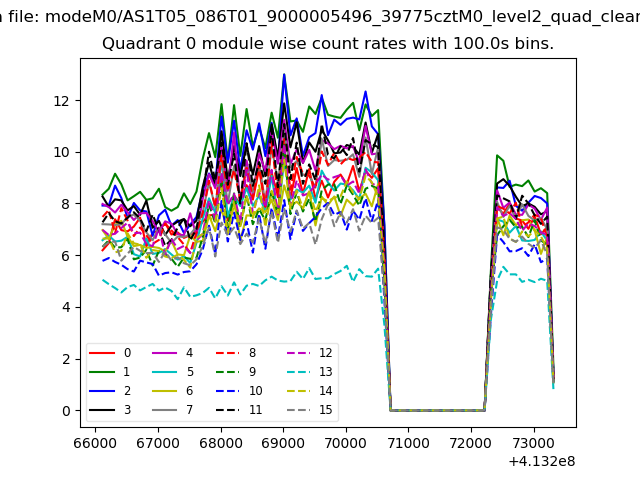 |
 |
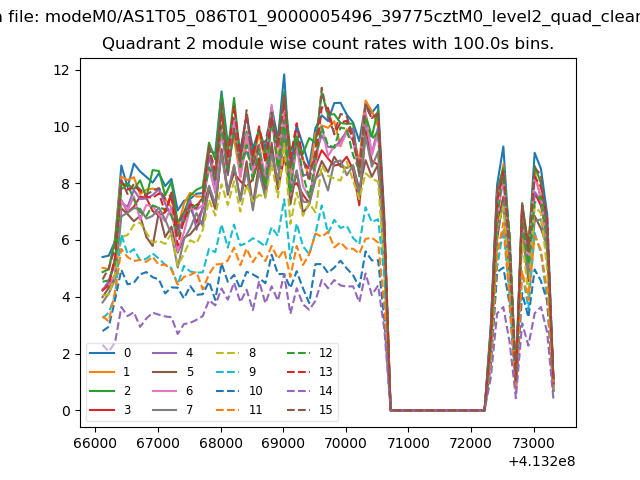
| Module-wise count rates for Quadrant B Data is divided into 100 sec bins |
 |
 |
| Module-wise count rates for Quadrant C Data is divided into 100 sec bins |
 |
 |
| Module-wise count rates for Quadrant D Data is divided into 100 sec bins |
 |
 |
| Parameter | Plot |
|---|---|
| CZT HV Monitor | 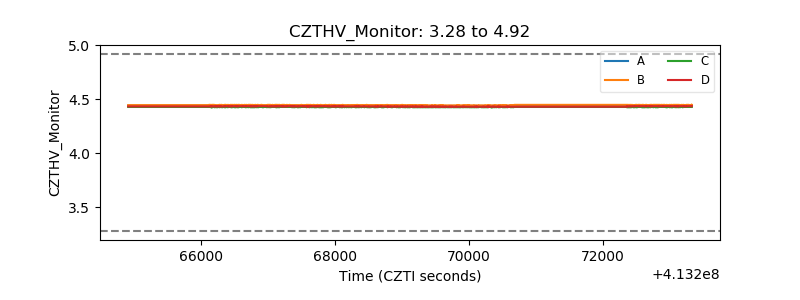 |
| D_VDD | 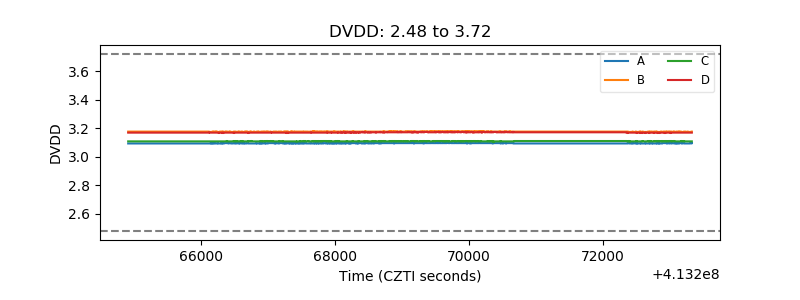 |
| Temperature 1 | 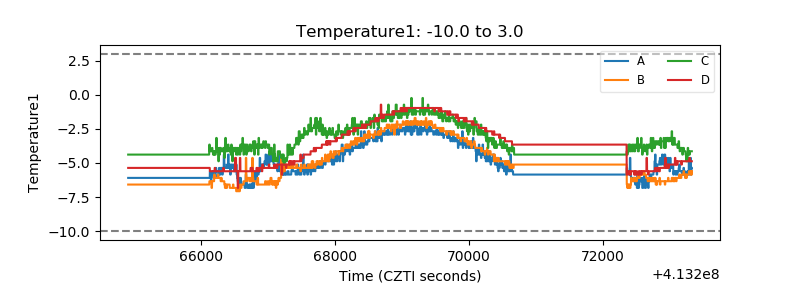 |
| Veto HV Monitor | 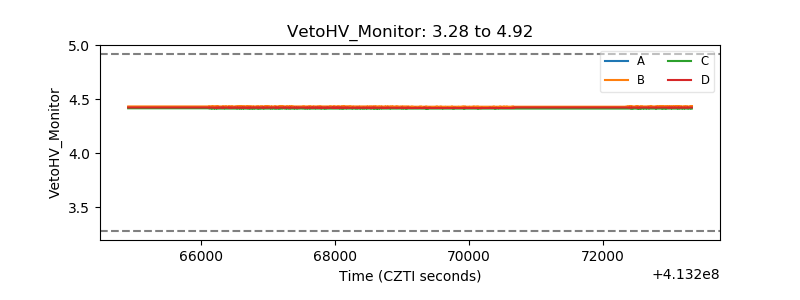 |
| Veto LLD | 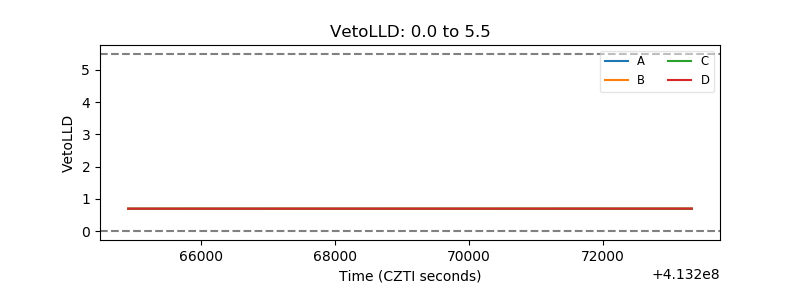 |
| Alpha Counter | 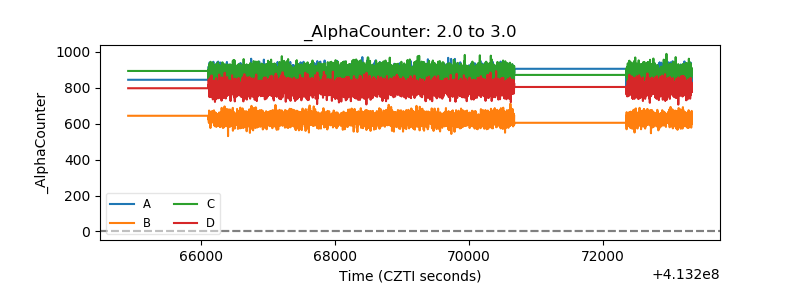 |
| _CPM_Rate | 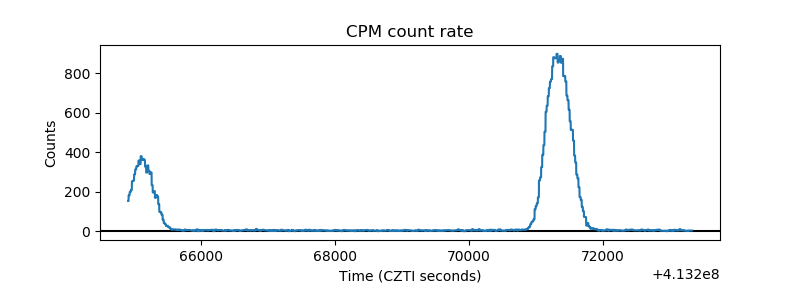 |
| CZT Counter | 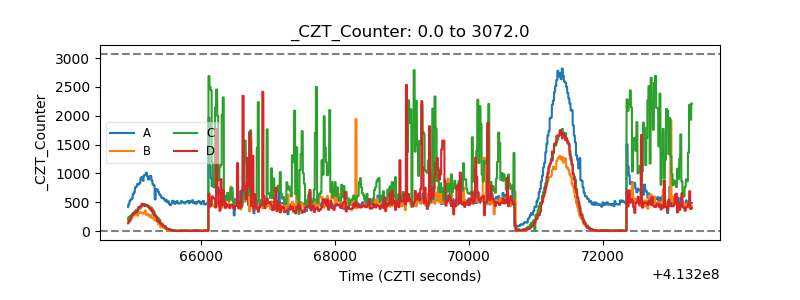 |
| +2.5 Volts monitor | 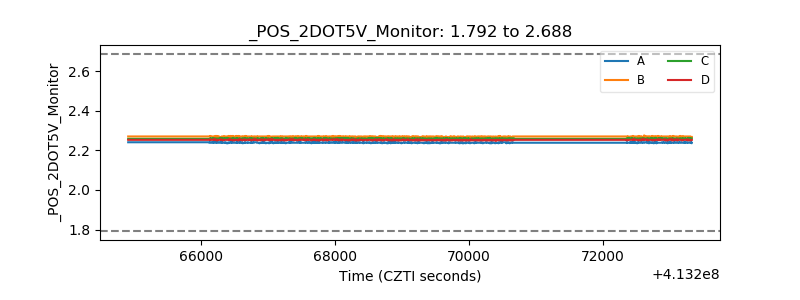 |
| +5 Volts monitor | 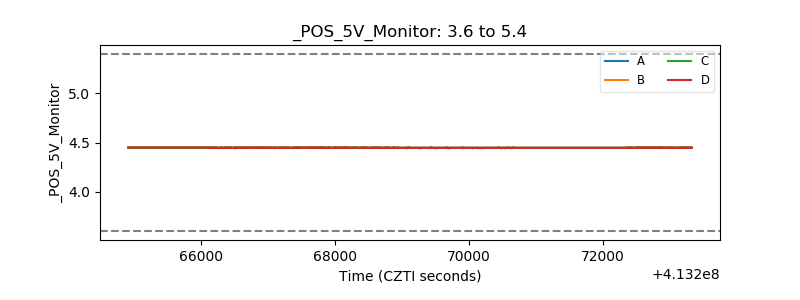 |
| _ROLL_ROT | 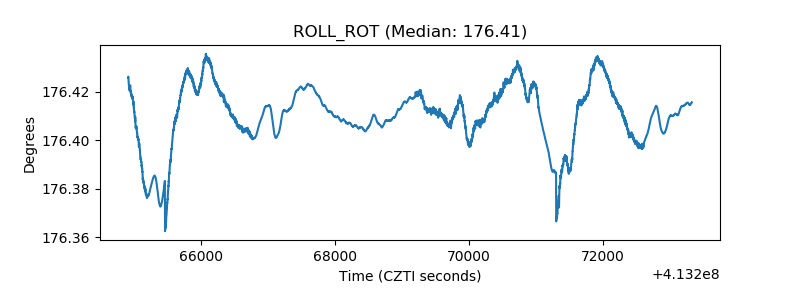 |
| _Roll_DEC | 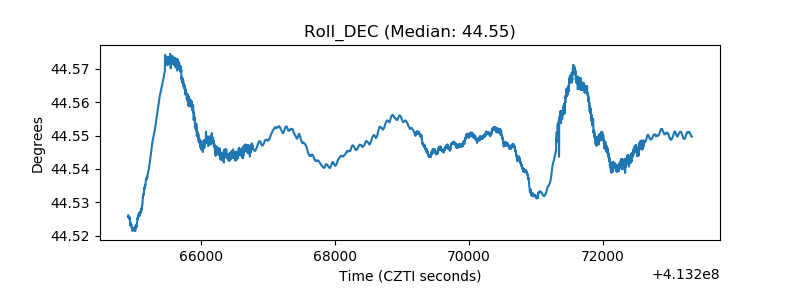 |
| _Roll_RA | 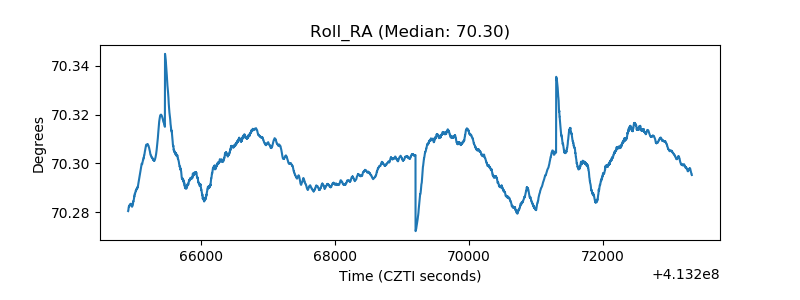 |
| Veto Counter | 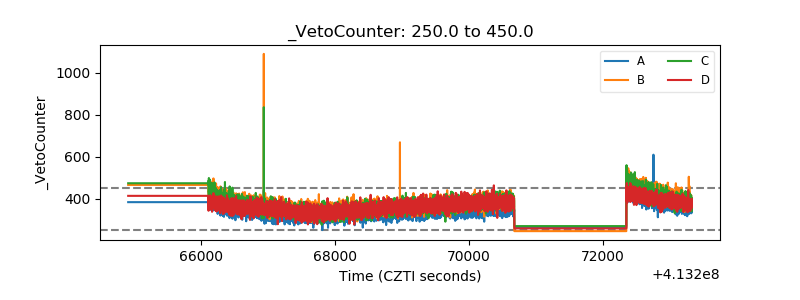 |