| Param | Original file | Final file |
|---|---|---|
| Filename | modeM0/AS1T05_086T01_9000005496_39777cztM0_level2.fits | modeM0/AS1T05_086T01_9000005496_39777cztM0_level2_quad_clean.evt |
| Size (bytes) | 471,772,800 | 99,095,040 |
| Size | 449.9 MB | 94.5 MB |
| Events in quadrant A | 2,998,841 | 719,010 |
| Events in quadrant B | 3,047,481 | 724,976 |
| Events in quadrant C | 7,200,526 | 578,127 |
| Events in quadrant D | 3,801,307 | 604,264 |
| Mode SS | |||
|---|---|---|---|
| Quadrant | BADHDUFLAG | Total packets | Discarded packets |
| A | 0 | 108 | 0 |
| B | 0 | 108 | 0 |
| C | 0 | 108 | 0 |
| D | 0 | 108 | 0 |
| Mode M9 | |||
|---|---|---|---|
| Quadrant | BADHDUFLAG | Total packets | Discarded packets |
| A | 0 | 30 | 0 |
| B | 0 | 30 | 0 |
| C | 0 | 30 | 0 |
| D | 0 | 31 | 0 |
| Mode M0 | |||
|---|---|---|---|
| Quadrant | BADHDUFLAG | Total packets | Discarded packets |
| A | 0 | 11907 | 3 |
| B | 0 | 12330 | 2 |
| C | 0 | 25153 | 2 |
| D | 0 | 14842 | 2 |
| Quadrant | Total seconds | Saturated seconds | Saturation percentage |
|---|---|---|---|
| A | 5350 | 19 | 0.355140% |
| B | 5350 | 98 | 1.831776% |
| C | 5350 | 1166 | 21.794393% |
| D | 5350 | 308 | 5.757009% |
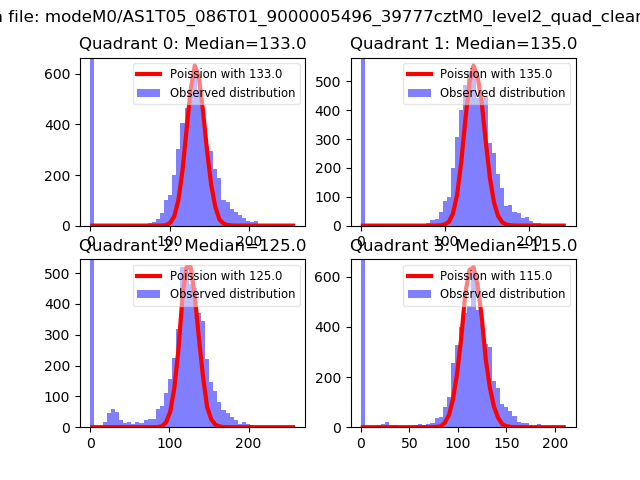
Noise dominated data is calculated using 1-second bins in cleaned event files. If a bin has >2000 counts, and if more than 50% of those come from <1% of pixels, then it is considered to be noise-dominated and hence unusable.
| Quadrant | # 1 sec bins | Bins with >0 counts | Bins with >2000 counts | High rate bins dominated by noise | Noise dominated (total time) | Noise dominated (detector-on time) | Marked lightcurve |
|---|---|---|---|---|---|---|---|
| A | 7143 | 5351 | 5 | 5 | 0.07% | 0.09% | 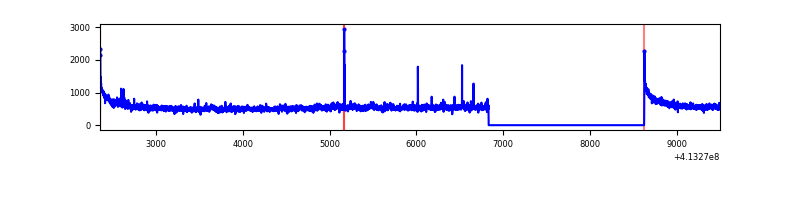 |
| B | 7143 | 5351 | 77 | 77 | 1.08% | 1.44% | 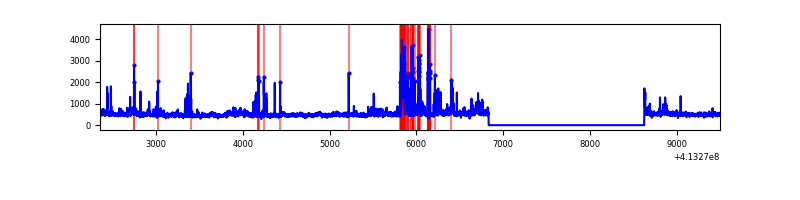 |
| C | 7143 | 5351 | 1017 | 1017 | 14.24% | 19.01% | 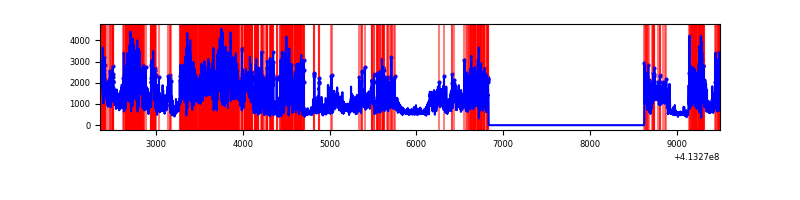 |
| D | 7143 | 5351 | 266 | 266 | 3.72% | 4.97% | 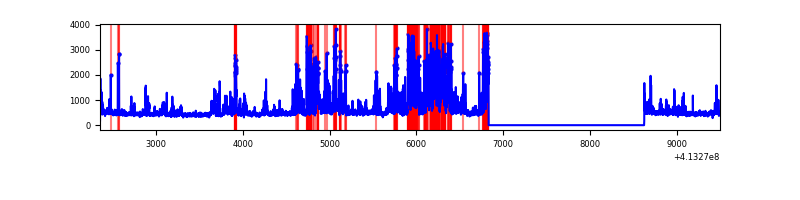 |
Top three noisy pixels from each quadrant. If the there are fewer than three noisy pixels in the level2.evt file, extra rows are filled as -1
| Pixel properties | Quadrant properties | ||||||
|---|---|---|---|---|---|---|---|
| Quadrant | DetID | PixID | Counts | Sigma | Mean | Median | Sigma |
| A | 10 | 83 | 454639 | 3366.73 | 649 | 638 | 134.8 |
| A | 2 | 79 | 15813 | 112.53 | 649 | 638 | 134.8 |
| A | 9 | 143 | 12220 | 85.89 | 649 | 638 | 134.8 |
| B | 5 | 172 | 214872 | 1698.36 | 638 | 625 | 126.1 |
| B | 5 | 32 | 155643 | 1228.84 | 638 | 625 | 126.1 |
| B | 10 | 246 | 57577 | 451.46 | 638 | 625 | 126.1 |
| C | 9 | 187 | 4122455 | 29844.79 | 581 | 590 | 138.1 |
| C | 15 | 208 | 515757 | 3730.12 | 581 | 590 | 138.1 |
| C | 15 | 214 | 210103 | 1517.0 | 581 | 590 | 138.1 |
| D | 12 | 233 | 1018105 | 6604.95 | 613 | 596 | 154.1 |
| D | 12 | 227 | 168663 | 1090.97 | 613 | 596 | 154.1 |
| D | 2 | 250 | 119149 | 769.56 | 613 | 596 | 154.1 |
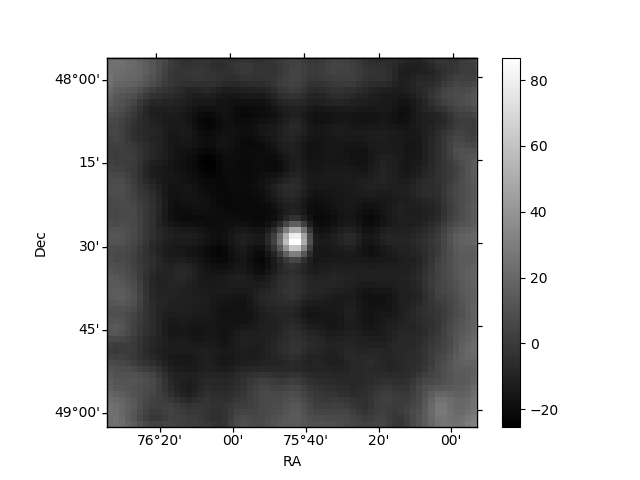
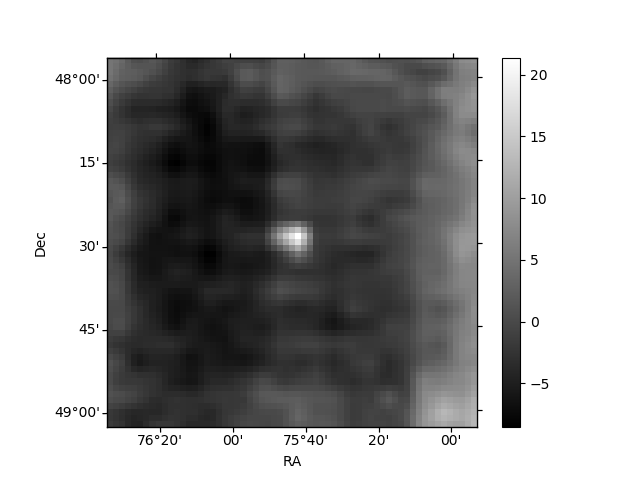
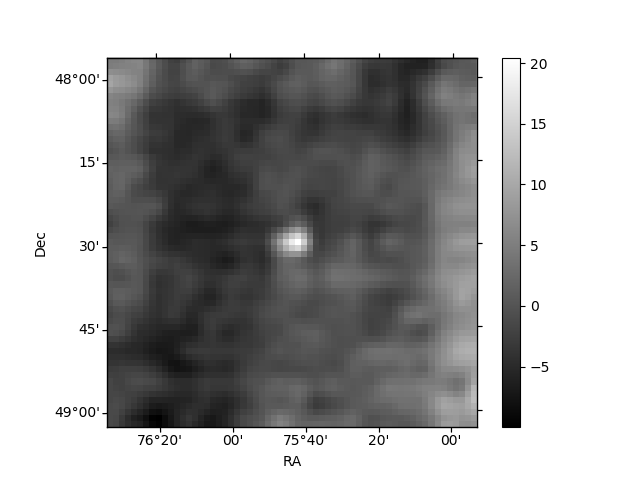
Histogram calculated using DETX and DETY for each event in the final _common_clean file
| Quadrant A | 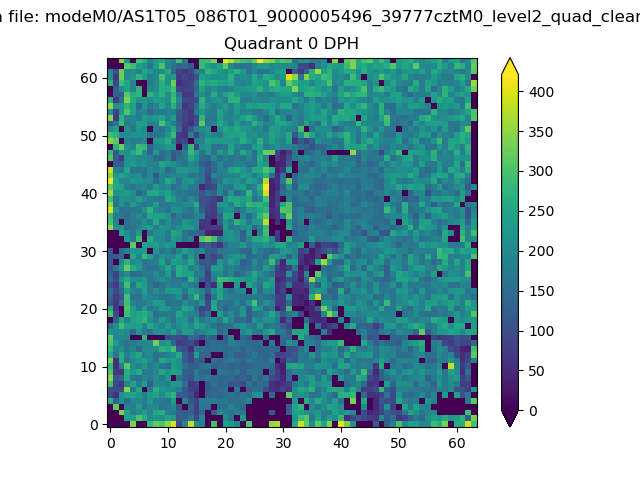 |
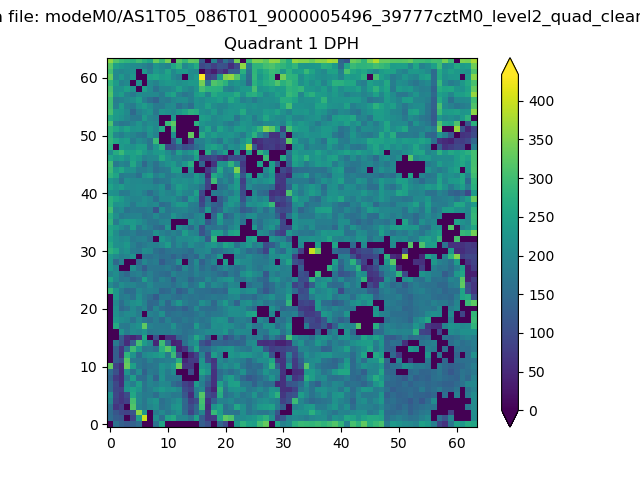 |
Quadrant B |
|---|---|---|---|
| Quadrant D | 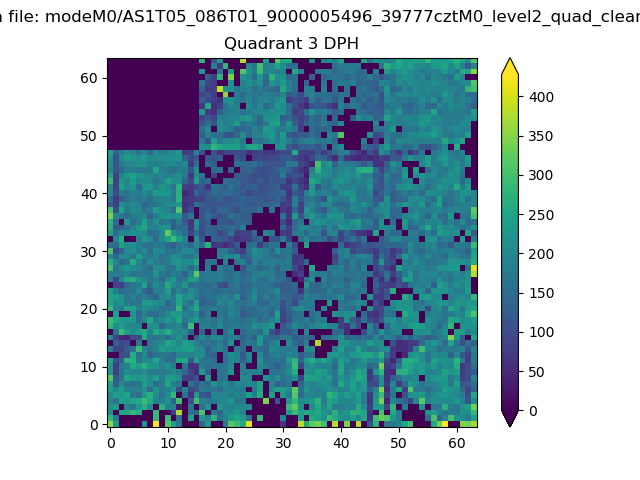 |
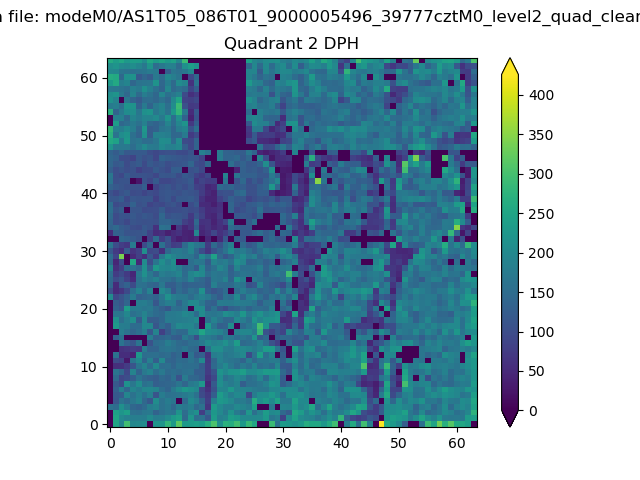 |
Quadrant C |
| Plot type | Count rate plots | Images |
|---|---|---|
| Comparison with Poisson distribution Blue bars denote a histogram of data divided into 1 sec bins. Red curve is a Poisson curve with rate = median count rate of data. |
 |
 |
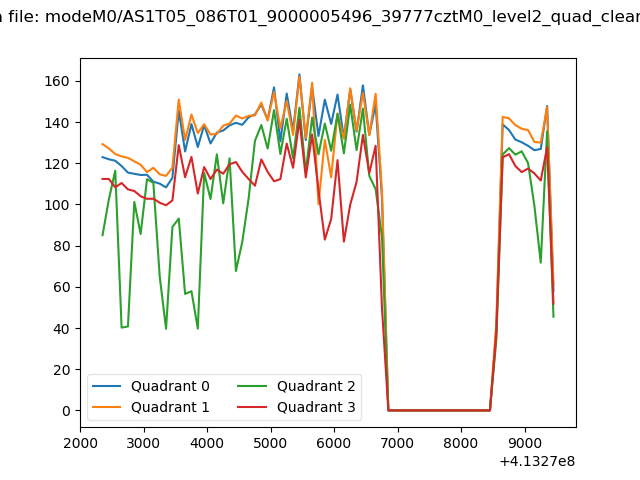
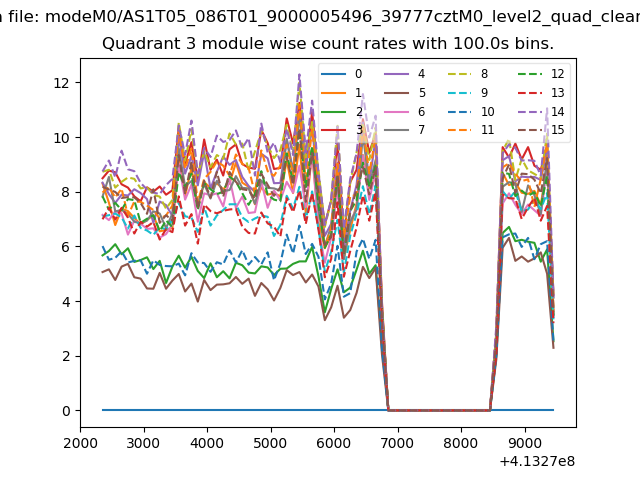
| Quadrant-wise count rates Data is divided into 100 sec bins |
 |
|
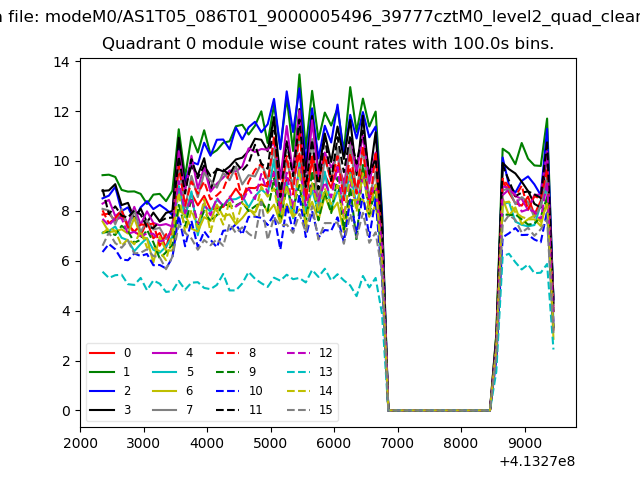
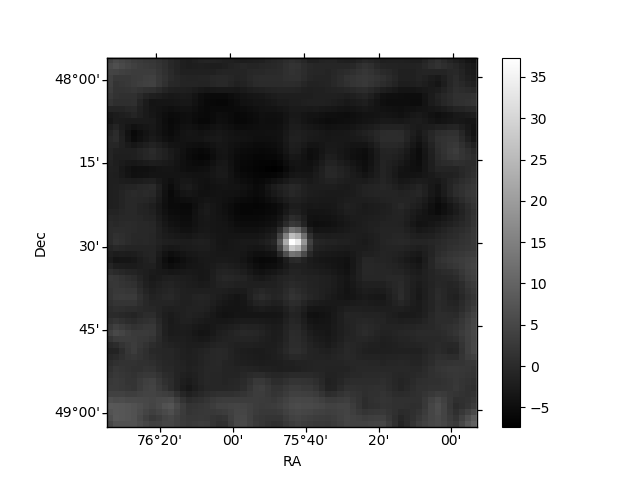
| Module-wise count rates for Quadrant A Data is divided into 100 sec bins |
 |
 |
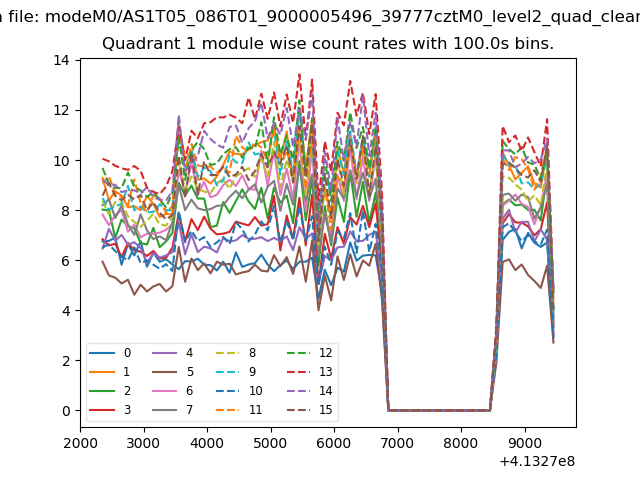
| Module-wise count rates for Quadrant B Data is divided into 100 sec bins |
 |
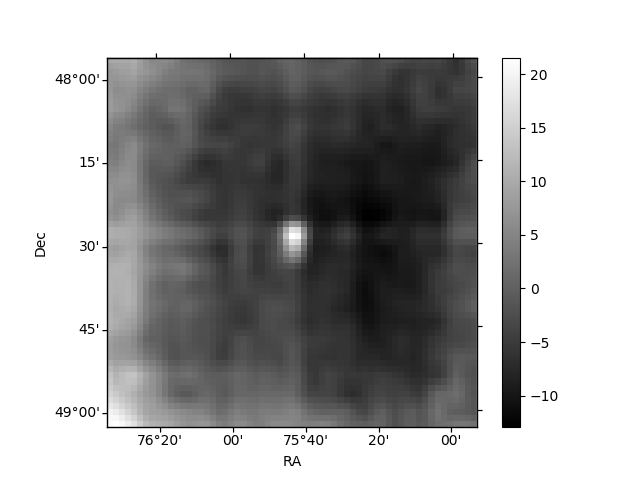 |
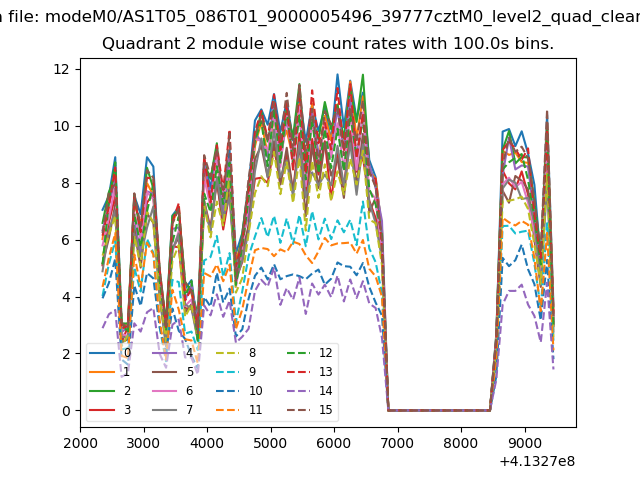
| Module-wise count rates for Quadrant C Data is divided into 100 sec bins |
 |
 |
| Module-wise count rates for Quadrant D Data is divided into 100 sec bins |
 |
 |
| Parameter | Plot |
|---|---|
| CZT HV Monitor |  |
| D_VDD | 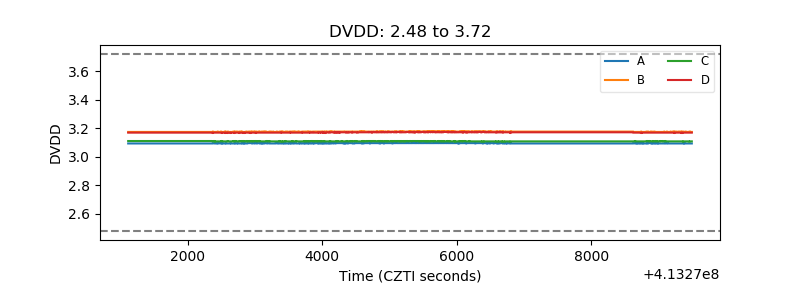 |
| Temperature 1 | 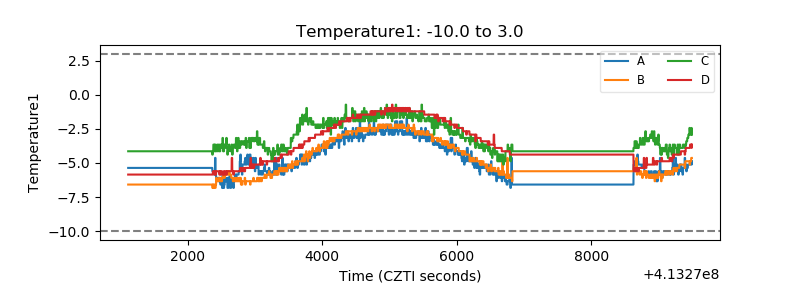 |
| Veto HV Monitor | 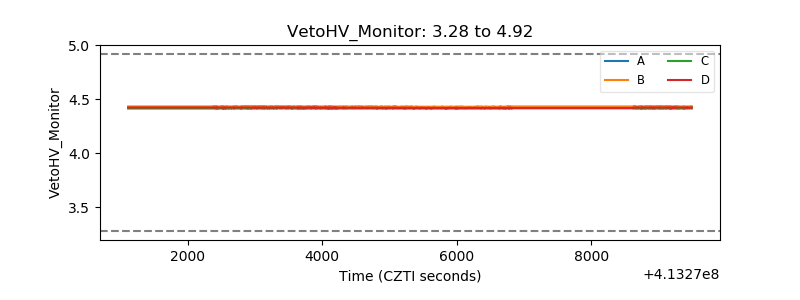 |
| Veto LLD | 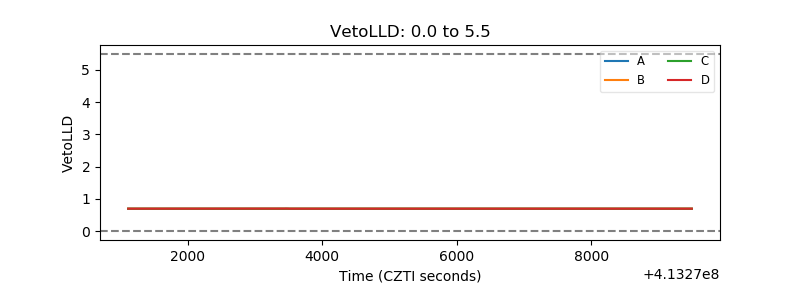 |
| Alpha Counter | 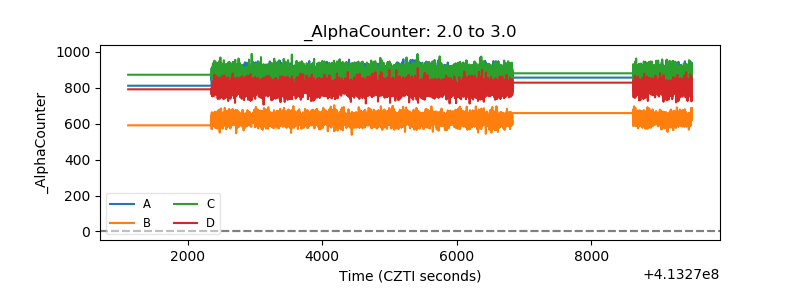 |
| _CPM_Rate | 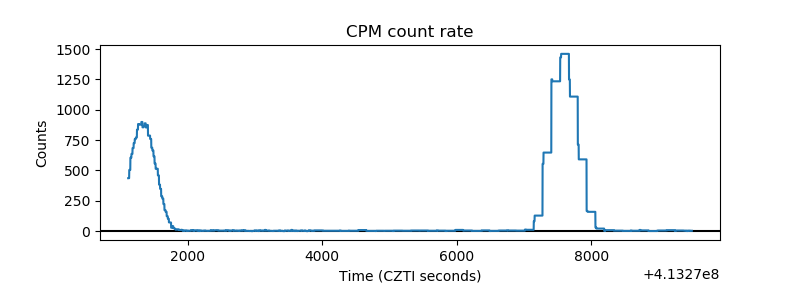 |
| CZT Counter | 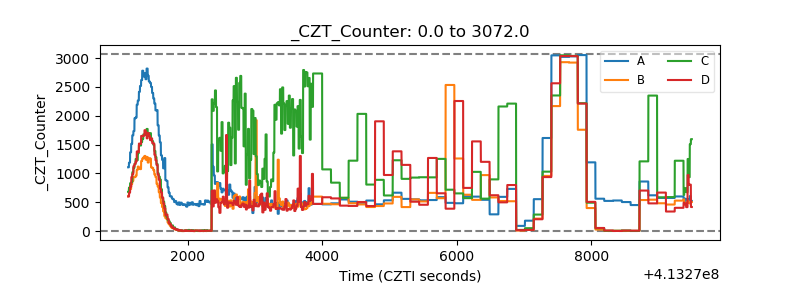 |
| +2.5 Volts monitor | 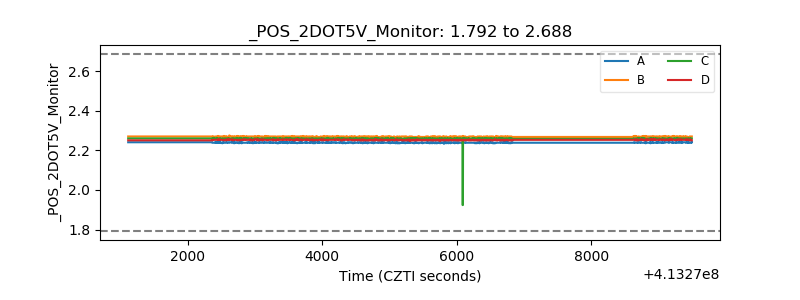 |
| +5 Volts monitor | 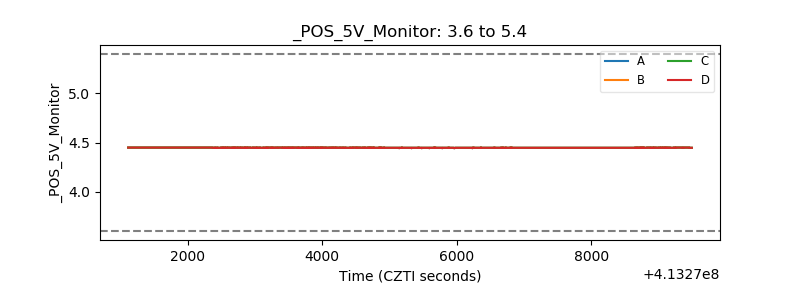 |
| _ROLL_ROT | 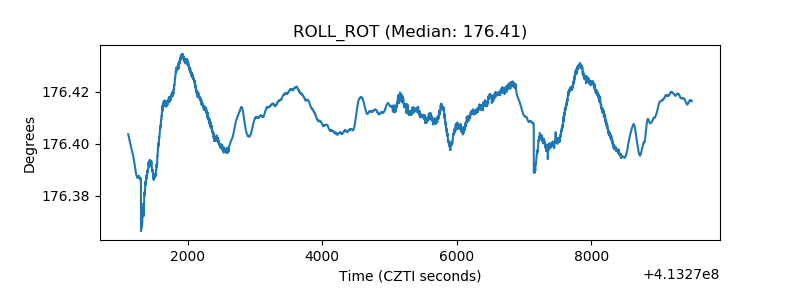 |
| _Roll_DEC | 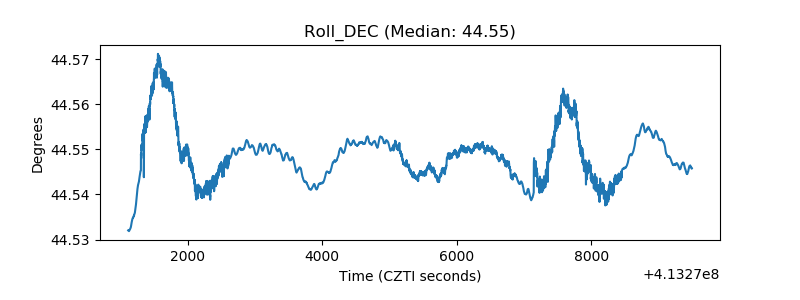 |
| _Roll_RA | 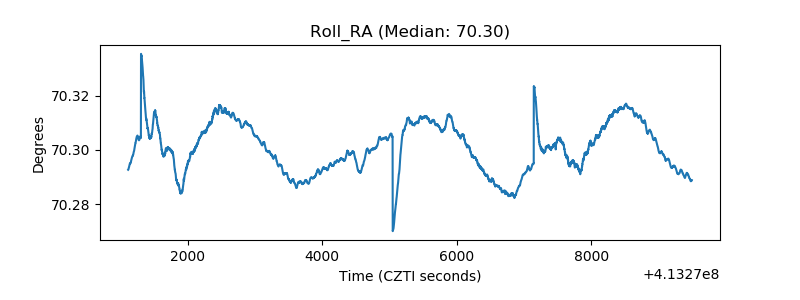 |
| Veto Counter | 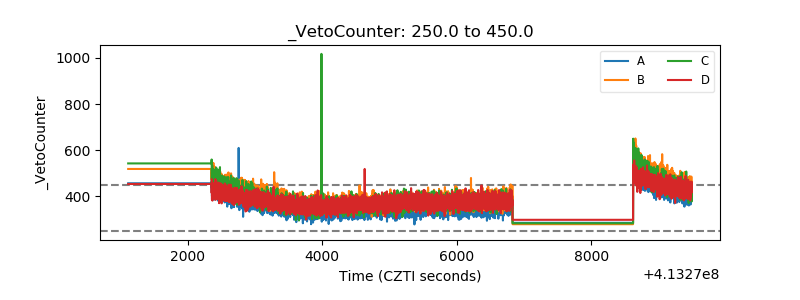 |