| Param | Original file | Final file |
|---|---|---|
| Filename | modeM0/AS1T05_086T01_9000005496_39778cztM0_level2.fits | modeM0/AS1T05_086T01_9000005496_39778cztM0_level2_quad_clean.evt |
| Size (bytes) | 494,962,560 | 101,744,640 |
| Size | 472.0 MB | 97.0 MB |
| Events in quadrant A | 3,566,765 | 739,376 |
| Events in quadrant B | 2,819,420 | 769,804 |
| Events in quadrant C | 8,054,656 | 568,725 |
| Events in quadrant D | 3,476,468 | 638,060 |
| Mode SS | |||
|---|---|---|---|
| Quadrant | BADHDUFLAG | Total packets | Discarded packets |
| A | 0 | 106 | 0 |
| B | 0 | 106 | 0 |
| C | 0 | 106 | 0 |
| D | 0 | 106 | 0 |
| Mode M9 | |||
|---|---|---|---|
| Quadrant | BADHDUFLAG | Total packets | Discarded packets |
| A | 0 | 26 | 0 |
| B | 0 | 26 | 0 |
| C | 0 | 26 | 0 |
| D | 0 | 27 | 0 |
| Mode M0 | |||
|---|---|---|---|
| Quadrant | BADHDUFLAG | Total packets | Discarded packets |
| A | 0 | 13826 | 3 |
| B | 0 | 11444 | 2 |
| C | 0 | 27551 | 2 |
| D | 0 | 13658 | 2 |
| Quadrant | Total seconds | Saturated seconds | Saturation percentage |
|---|---|---|---|
| A | 5214 | 185 | 3.548140% |
| B | 5214 | 24 | 0.460299% |
| C | 5214 | 1431 | 27.445339% |
| D | 5214 | 198 | 3.797468% |
Noise dominated data is calculated using 1-second bins in cleaned event files. If a bin has >2000 counts, and if more than 50% of those come from <1% of pixels, then it is considered to be noise-dominated and hence unusable.
| Quadrant | # 1 sec bins | Bins with >0 counts | Bins with >2000 counts | High rate bins dominated by noise | Noise dominated (total time) | Noise dominated (detector-on time) | Marked lightcurve |
|---|---|---|---|---|---|---|---|
| A | 7126 | 5215 | 127 | 127 | 1.78% | 2.44% | 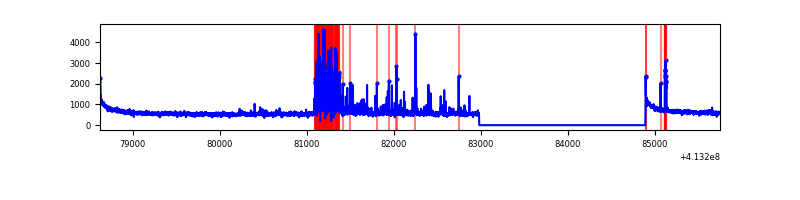 |
| B | 7126 | 5215 | 11 | 11 | 0.15% | 0.21% | 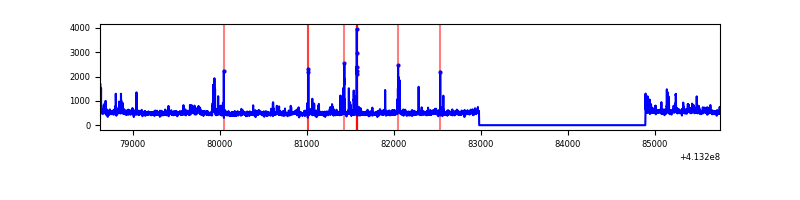 |
| C | 7126 | 5215 | 1418 | 1418 | 19.90% | 27.19% | 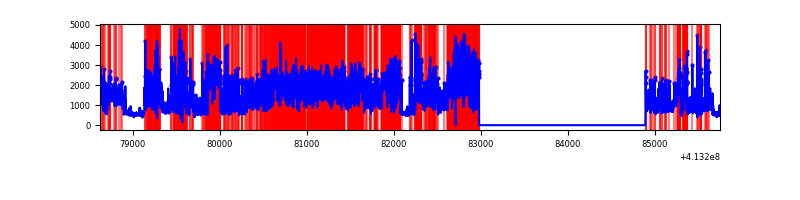 |
| D | 7126 | 5215 | 185 | 185 | 2.60% | 3.55% | 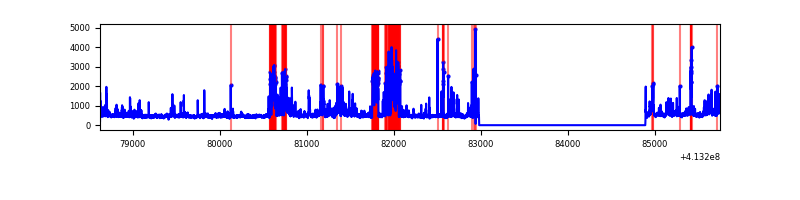 |
Top three noisy pixels from each quadrant. If the there are fewer than three noisy pixels in the level2.evt file, extra rows are filled as -1
| Pixel properties | Quadrant properties | ||||||
|---|---|---|---|---|---|---|---|
| Quadrant | DetID | PixID | Counts | Sigma | Mean | Median | Sigma |
| A | 13 | 248 | 499214 | 3648.06 | 653 | 644 | 136.7 |
| A | 10 | 83 | 445135 | 3252.36 | 653 | 644 | 136.7 |
| A | 9 | 143 | 67800 | 491.38 | 653 | 644 | 136.7 |
| B | 5 | 172 | 130978 | 1014.9 | 651 | 637 | 128.4 |
| B | 0 | 190 | 62790 | 483.95 | 651 | 637 | 128.4 |
| B | 15 | 201 | 26689 | 202.85 | 651 | 637 | 128.4 |
| C | 9 | 187 | 4864635 | 35803.55 | 569 | 575 | 135.9 |
| C | 15 | 208 | 571643 | 4203.54 | 569 | 575 | 135.9 |
| C | 15 | 214 | 201104 | 1476.06 | 569 | 575 | 135.9 |
| D | 12 | 233 | 424392 | 2705.25 | 625 | 610 | 156.7 |
| D | 12 | 227 | 281388 | 1792.37 | 625 | 610 | 156.7 |
| D | 1 | 47 | 177764 | 1130.88 | 625 | 610 | 156.7 |
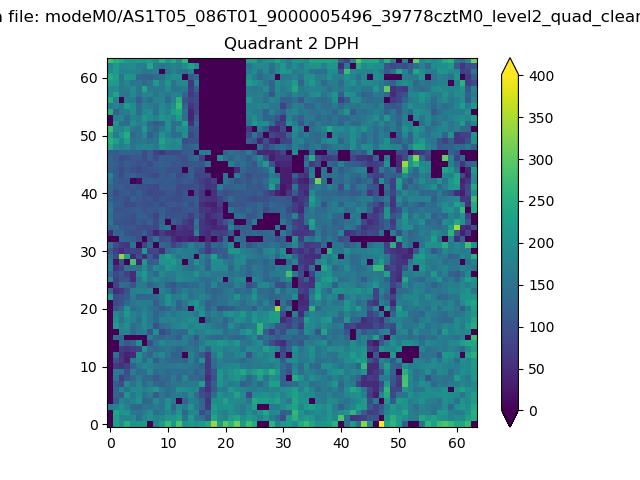
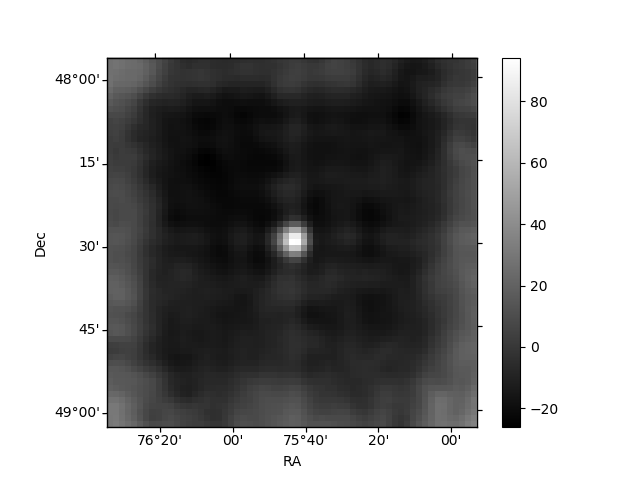
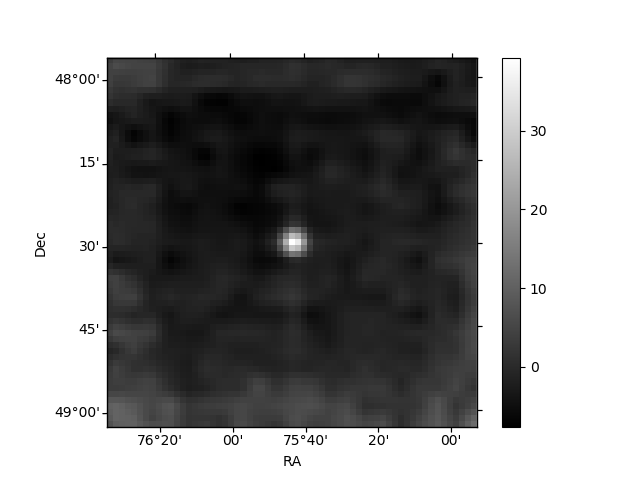
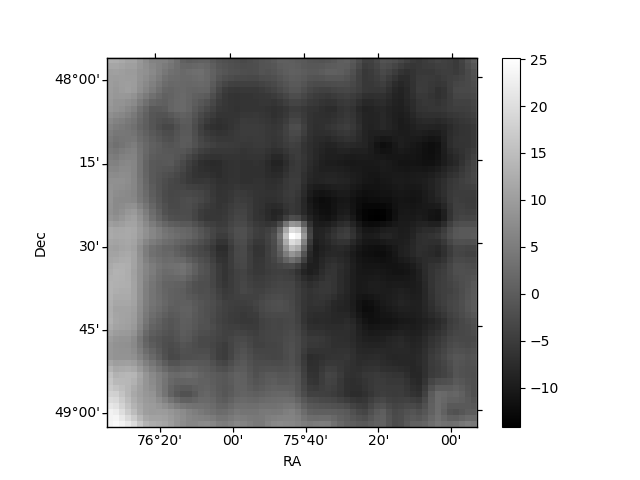
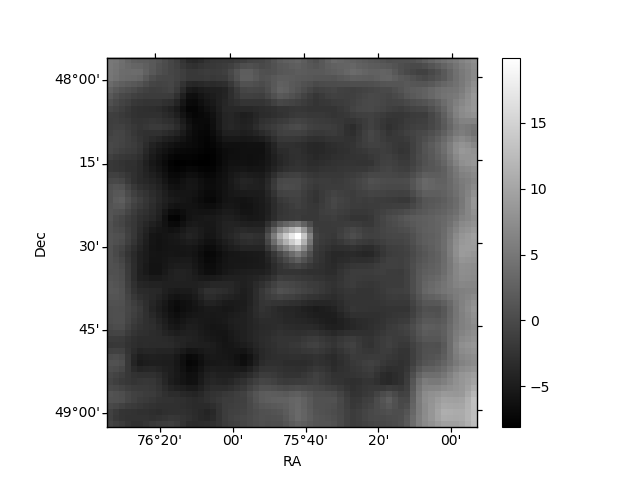
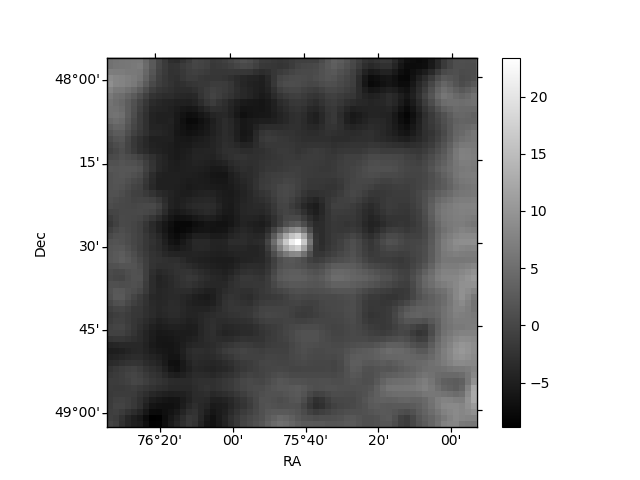
Histogram calculated using DETX and DETY for each event in the final _common_clean file
| Quadrant A | 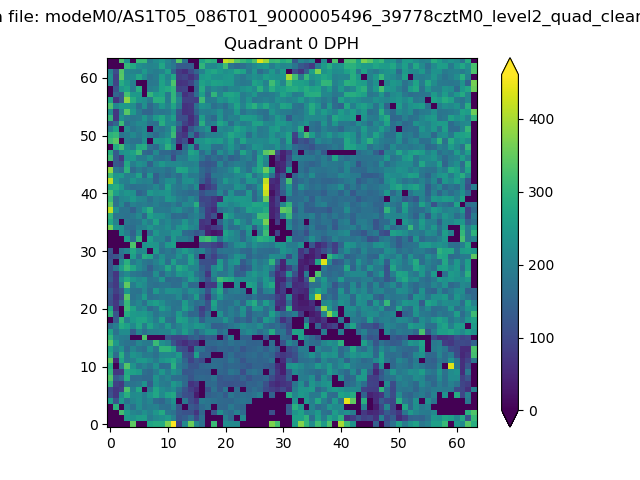 |
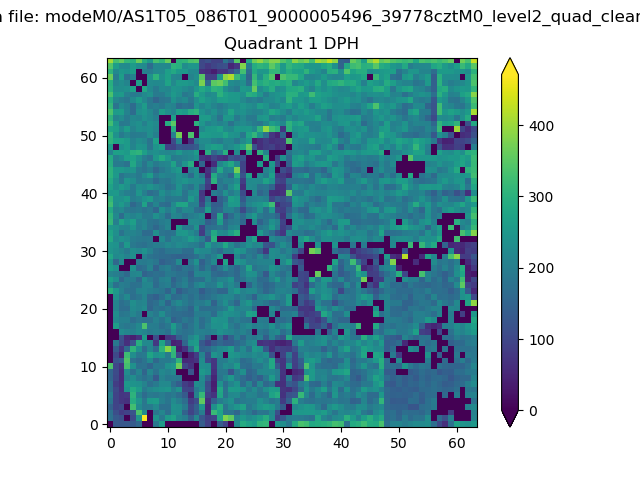 |
Quadrant B |
|---|---|---|---|
| Quadrant D | 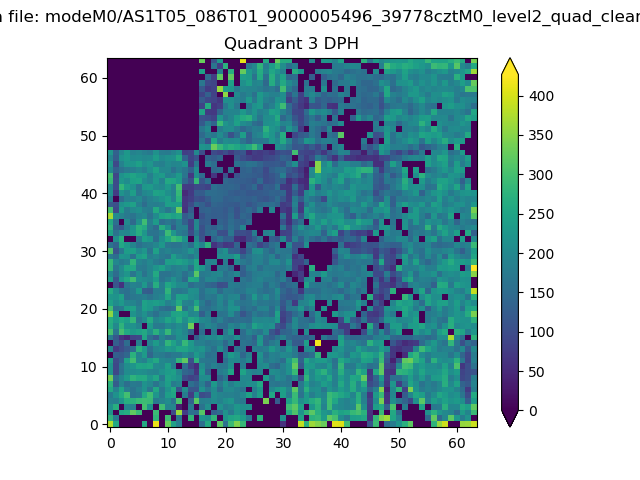 |
 |
Quadrant C |
| Plot type | Count rate plots | Images |
|---|---|---|
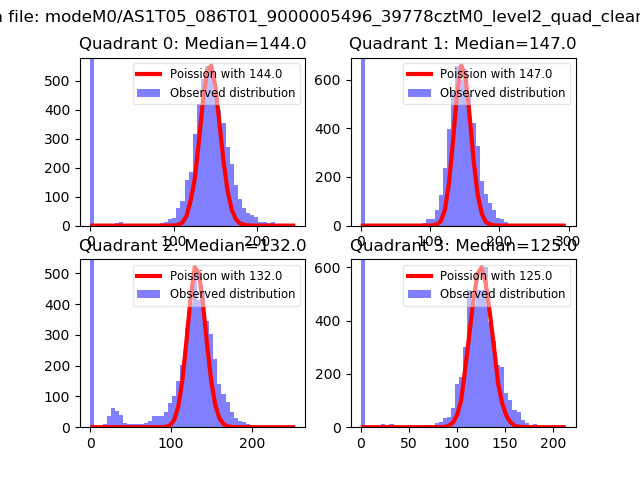
| Comparison with Poisson distribution Blue bars denote a histogram of data divided into 1 sec bins. Red curve is a Poisson curve with rate = median count rate of data. |
 |
 |
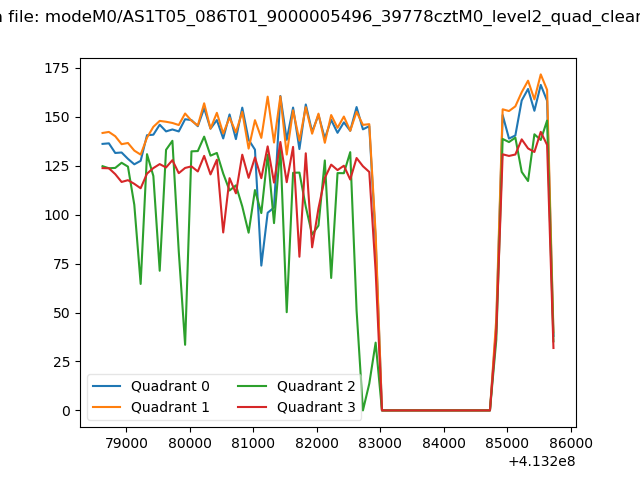
| Quadrant-wise count rates Data is divided into 100 sec bins |
 |
|
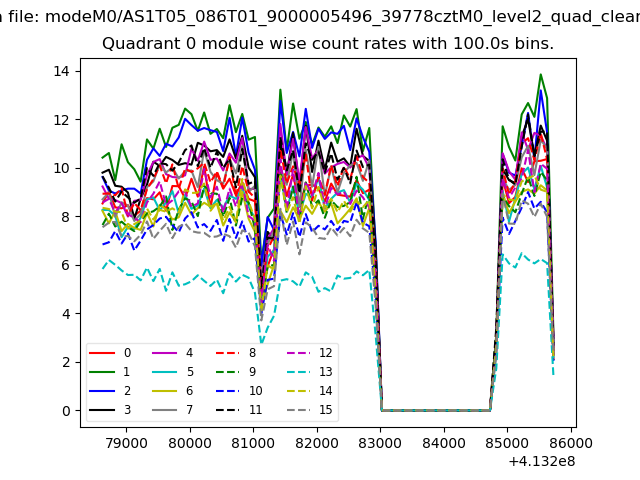
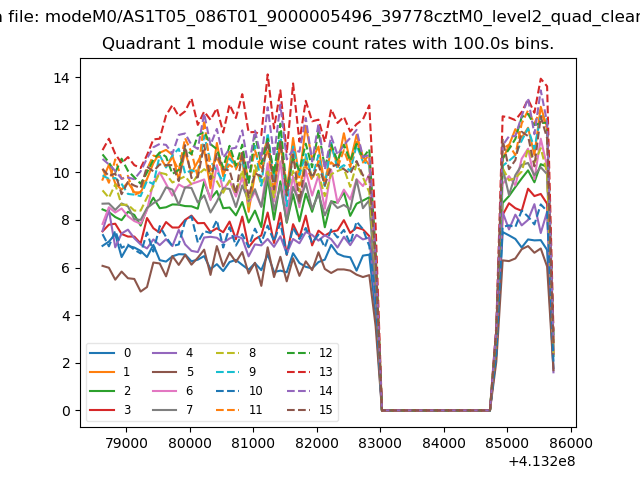
| Module-wise count rates for Quadrant A Data is divided into 100 sec bins |
 |
 |
| Module-wise count rates for Quadrant B Data is divided into 100 sec bins |
 |
 |
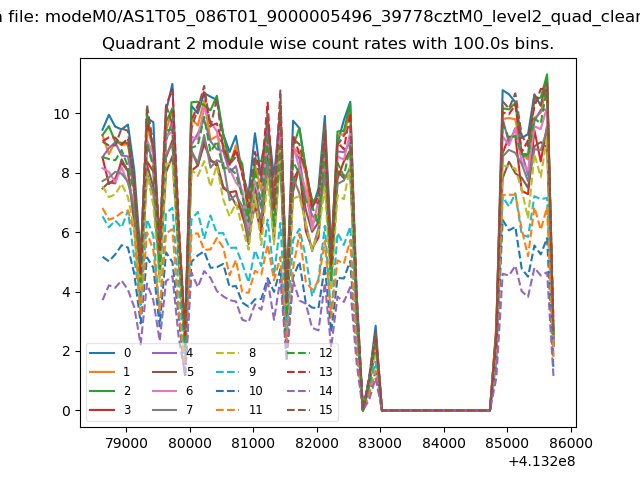
| Module-wise count rates for Quadrant C Data is divided into 100 sec bins |
 |
 |
| Module-wise count rates for Quadrant D Data is divided into 100 sec bins |
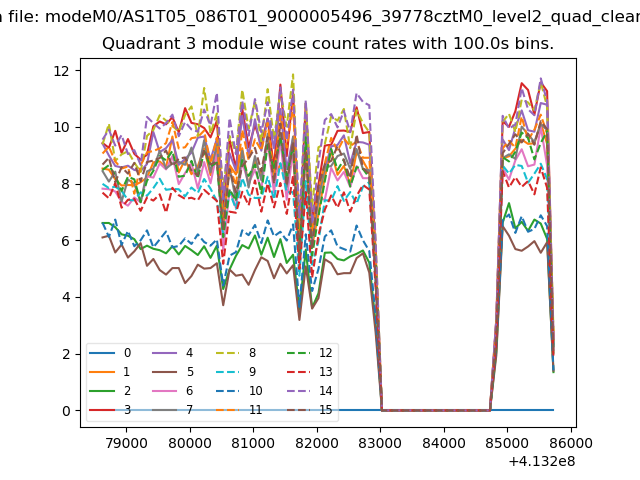 |
 |
| Parameter | Plot |
|---|---|
| CZT HV Monitor | 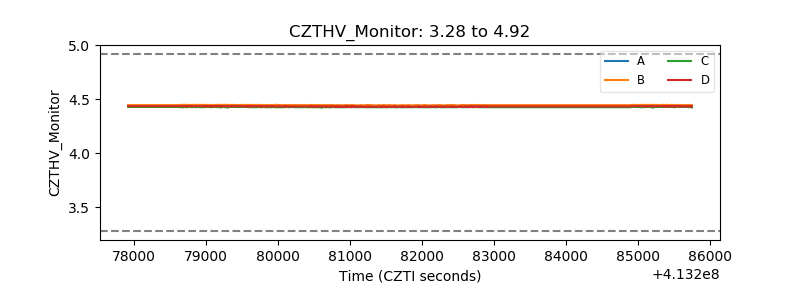 |
| D_VDD | 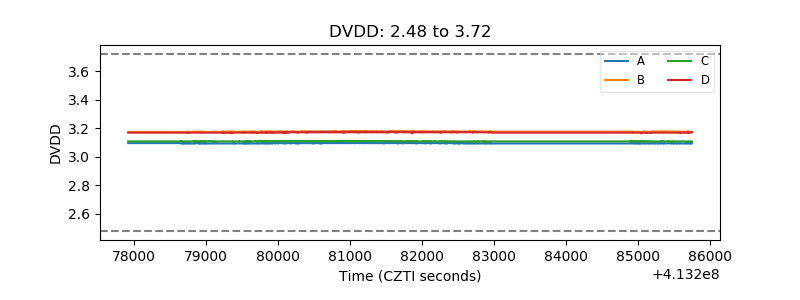 |
| Temperature 1 |  |
| Veto HV Monitor | 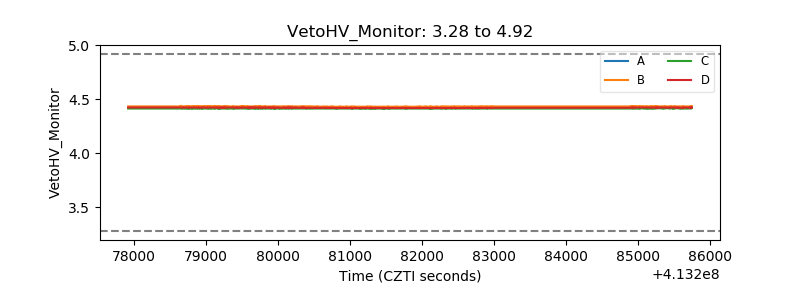 |
| Veto LLD | 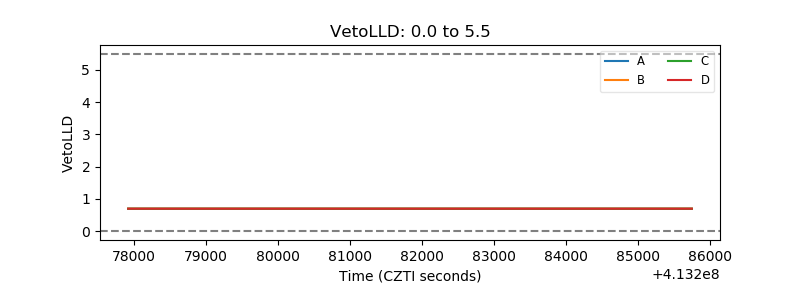 |
| Alpha Counter | 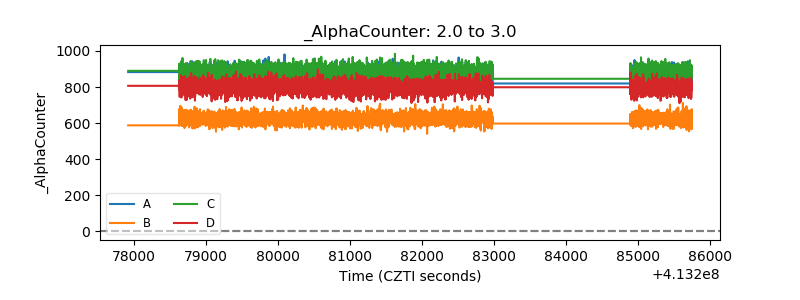 |
| _CPM_Rate | 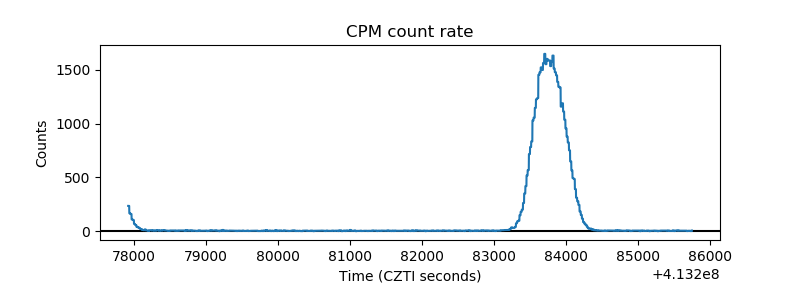 |
| CZT Counter | 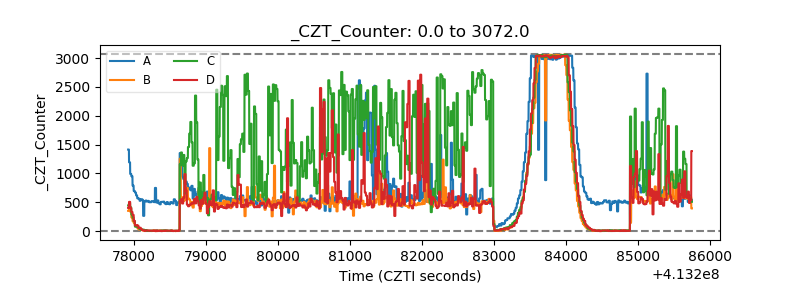 |
| +2.5 Volts monitor | 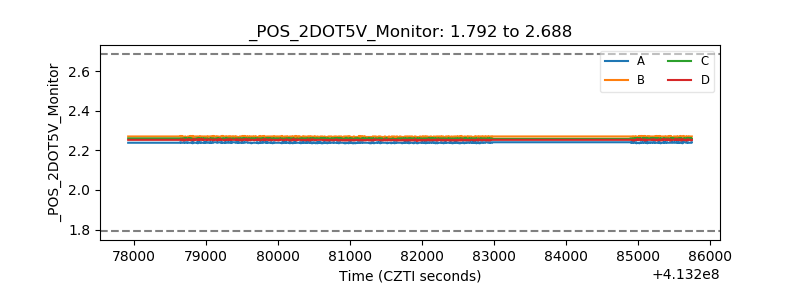 |
| +5 Volts monitor | 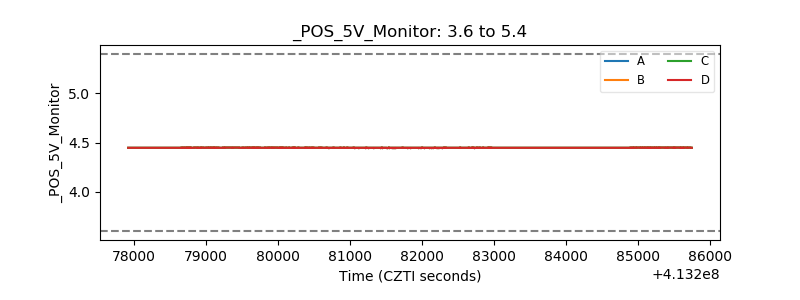 |
| _ROLL_ROT | 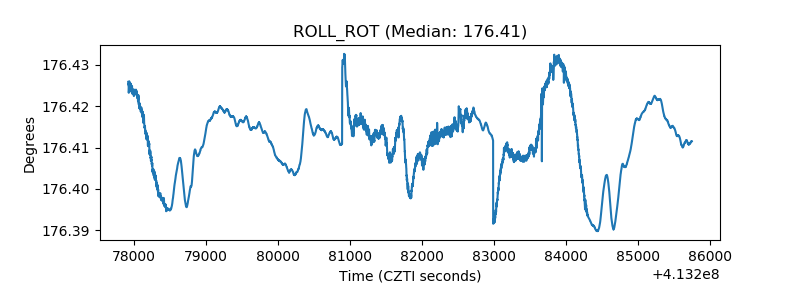 |
| _Roll_DEC | 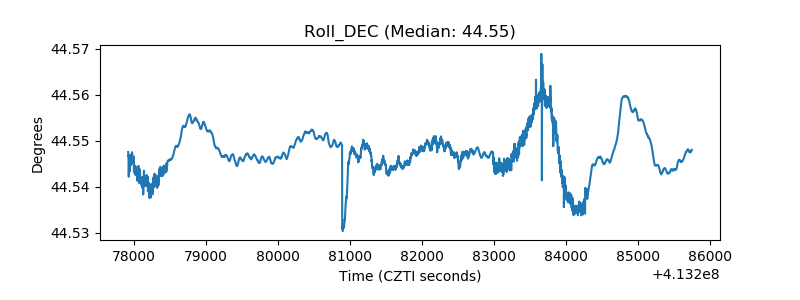 |
| _Roll_RA | 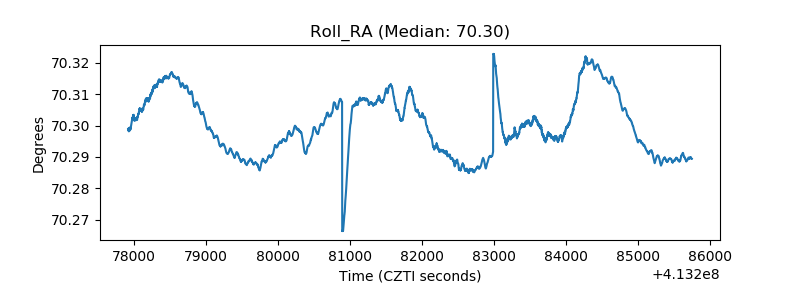 |
| Veto Counter | 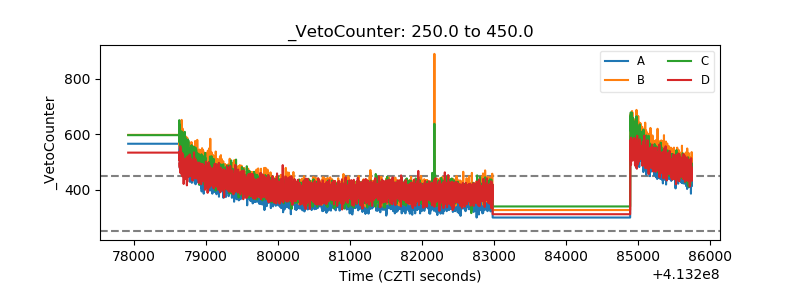 |