| Param | Original file | Final file |
|---|---|---|
| Filename | modeM0/AS1T05_086T01_9000005496_39779cztM0_level2.fits | modeM0/AS1T05_086T01_9000005496_39779cztM0_level2_quad_clean.evt |
| Size (bytes) | 424,895,040 | 108,434,880 |
| Size | 405.2 MB | 103.4 MB |
| Events in quadrant A | 3,513,559 | 778,812 |
| Events in quadrant B | 2,816,740 | 799,377 |
| Events in quadrant C | 5,328,049 | 690,831 |
| Events in quadrant D | 3,676,154 | 659,217 |
| Mode SS | |||
|---|---|---|---|
| Quadrant | BADHDUFLAG | Total packets | Discarded packets |
| A | 0 | 104 | 0 |
| B | 0 | 104 | 0 |
| C | 0 | 104 | 0 |
| D | 0 | 104 | 0 |
| Mode M9 | |||
|---|---|---|---|
| Quadrant | BADHDUFLAG | Total packets | Discarded packets |
| A | 0 | 33 | 0 |
| B | 0 | 33 | 0 |
| C | 0 | 33 | 0 |
| D | 0 | 34 | 0 |
| Mode M0 | |||
|---|---|---|---|
| Quadrant | BADHDUFLAG | Total packets | Discarded packets |
| A | 0 | 13827 | 3 |
| B | 0 | 11327 | 2 |
| C | 0 | 19345 | 2 |
| D | 0 | 14151 | 2 |
| Quadrant | Total seconds | Saturated seconds | Saturation percentage |
|---|---|---|---|
| A | 5075 | 122 | 2.403941% |
| B | 5075 | 9 | 0.177340% |
| C | 5075 | 471 | 9.280788% |
| D | 5075 | 189 | 3.724138% |
Noise dominated data is calculated using 1-second bins in cleaned event files. If a bin has >2000 counts, and if more than 50% of those come from <1% of pixels, then it is considered to be noise-dominated and hence unusable.
| Quadrant | # 1 sec bins | Bins with >0 counts | Bins with >2000 counts | High rate bins dominated by noise | Noise dominated (total time) | Noise dominated (detector-on time) | Marked lightcurve |
|---|---|---|---|---|---|---|---|
| A | 7107 | 5076 | 84 | 84 | 1.18% | 1.65% | 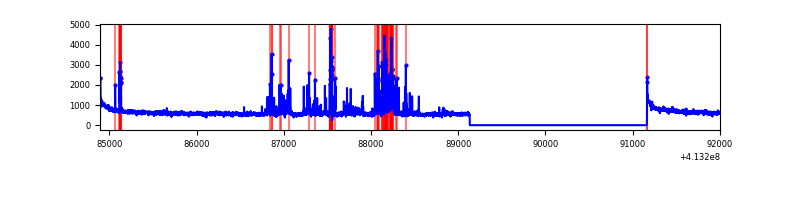 |
| B | 7107 | 5076 | 2 | 2 | 0.03% | 0.04% | 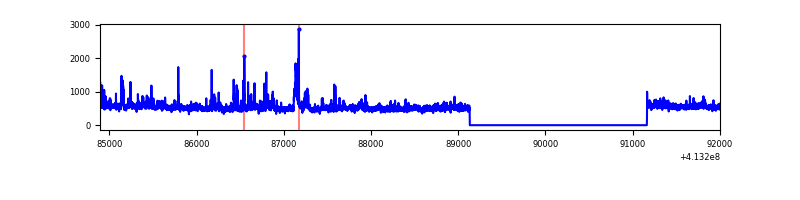 |
| C | 7107 | 5076 | 450 | 450 | 6.33% | 8.87% | 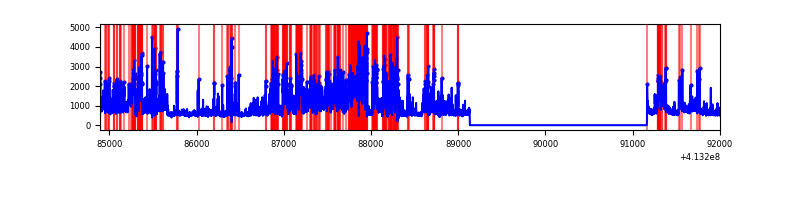 |
| D | 7107 | 5076 | 157 | 157 | 2.21% | 3.09% | 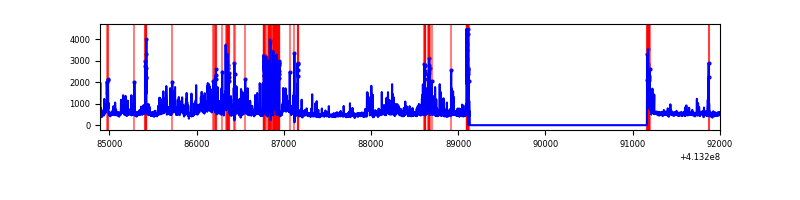 |
Top three noisy pixels from each quadrant. If the there are fewer than three noisy pixels in the level2.evt file, extra rows are filled as -1
| Pixel properties | Quadrant properties | ||||||
|---|---|---|---|---|---|---|---|
| Quadrant | DetID | PixID | Counts | Sigma | Mean | Median | Sigma |
| A | 10 | 83 | 450300 | 3236.92 | 660 | 650 | 138.9 |
| A | 13 | 248 | 280672 | 2015.81 | 660 | 650 | 138.9 |
| A | 9 | 143 | 213163 | 1529.83 | 660 | 650 | 138.9 |
| B | 5 | 172 | 85715 | 662.3 | 653 | 641 | 128.5 |
| B | 5 | 32 | 63750 | 491.3 | 653 | 641 | 128.5 |
| B | 0 | 190 | 43435 | 333.15 | 653 | 641 | 128.5 |
| C | 9 | 187 | 1875128 | 12809.38 | 612 | 619 | 146.3 |
| C | 15 | 208 | 582572 | 3976.75 | 612 | 619 | 146.3 |
| C | 15 | 214 | 207183 | 1411.55 | 612 | 619 | 146.3 |
| D | 12 | 233 | 478136 | 3020.78 | 627 | 613 | 158.1 |
| D | 13 | 249 | 393948 | 2488.21 | 627 | 613 | 158.1 |
| D | 12 | 227 | 204191 | 1287.82 | 627 | 613 | 158.1 |
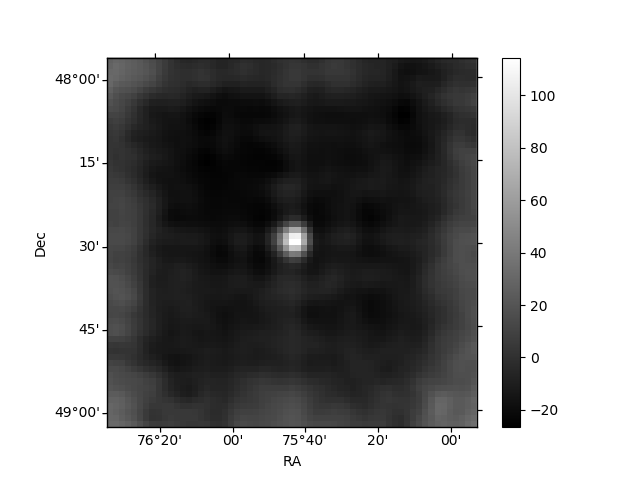
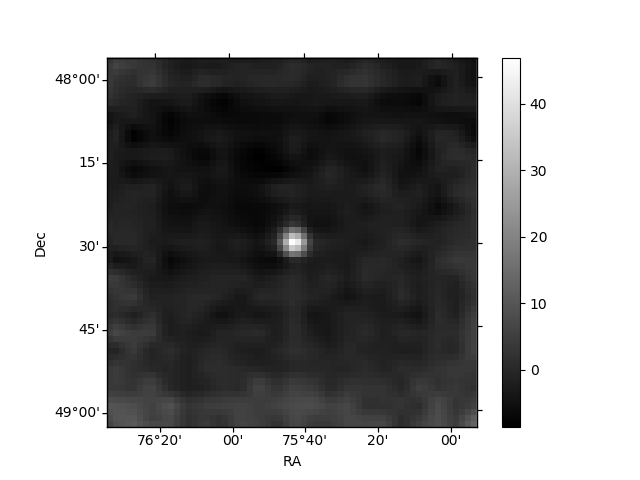
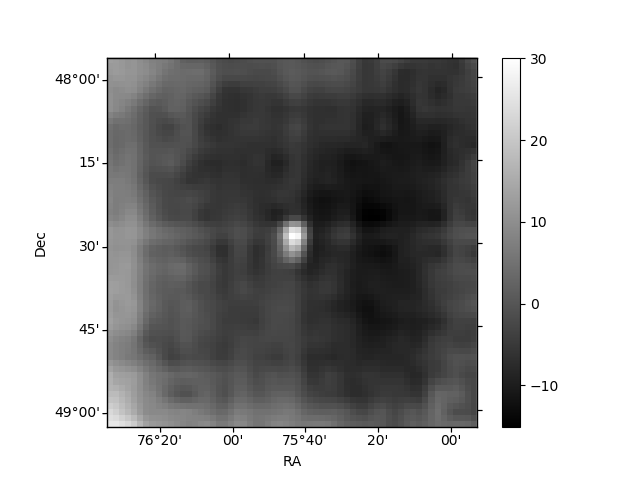
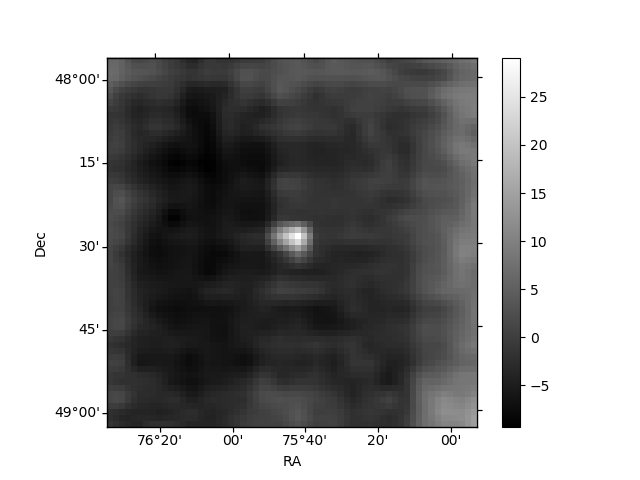
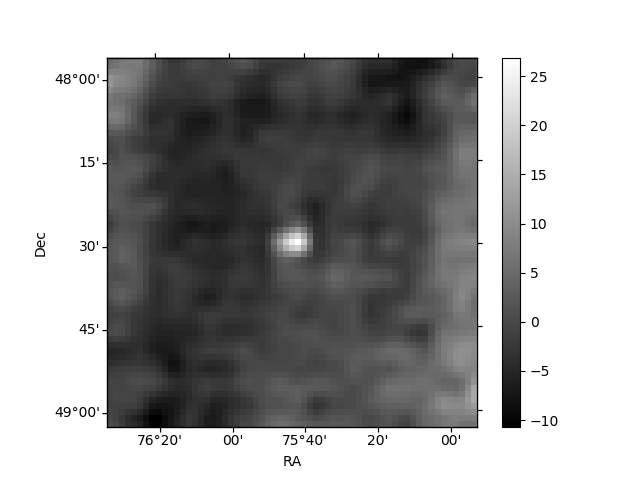
Histogram calculated using DETX and DETY for each event in the final _common_clean file
| Quadrant A | 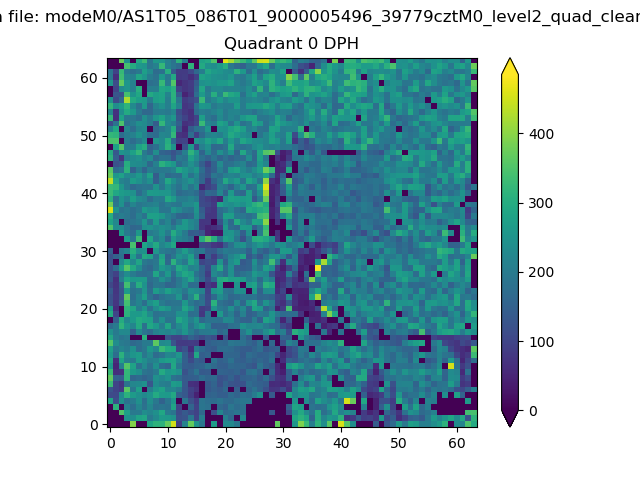 |
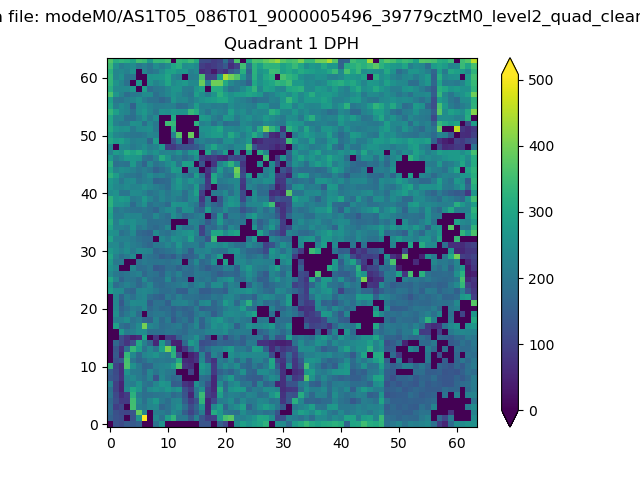 |
Quadrant B |
|---|---|---|---|
| Quadrant D | 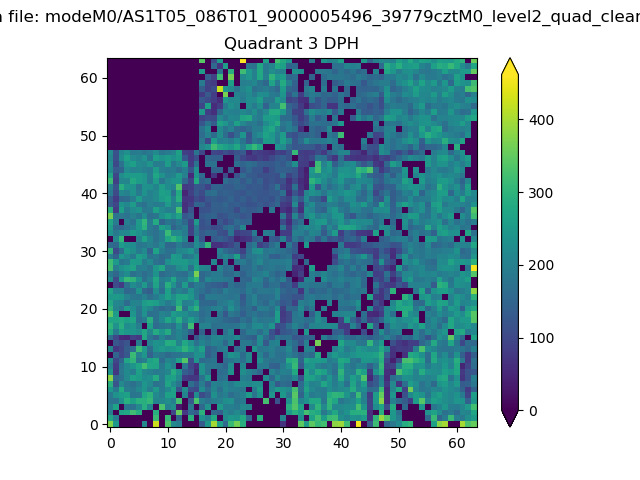 |
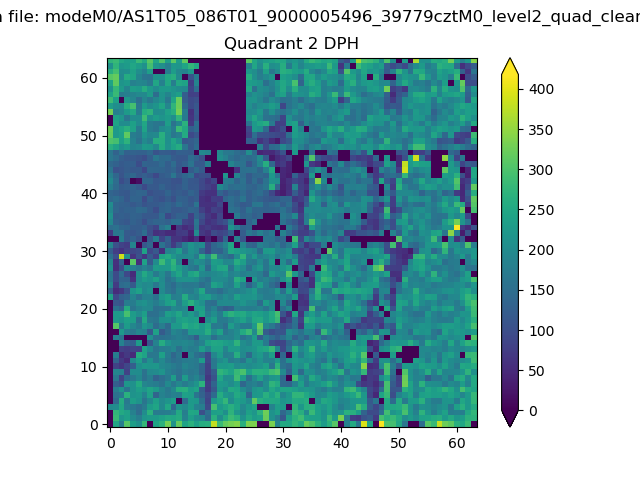 |
Quadrant C |
| Plot type | Count rate plots | Images |
|---|---|---|
| Comparison with Poisson distribution Blue bars denote a histogram of data divided into 1 sec bins. Red curve is a Poisson curve with rate = median count rate of data. |
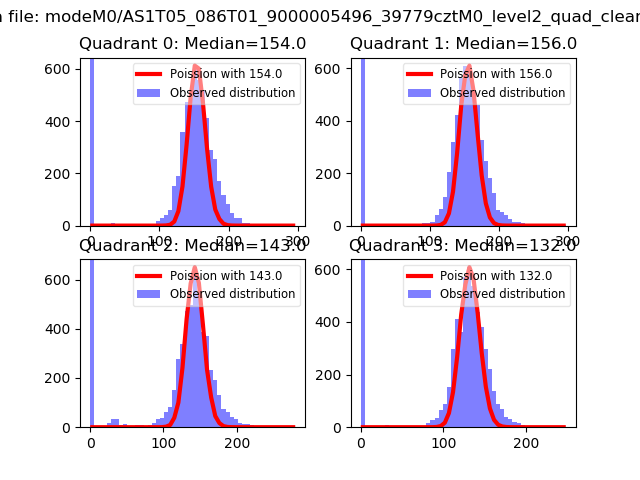 |
 |
| Quadrant-wise count rates Data is divided into 100 sec bins |
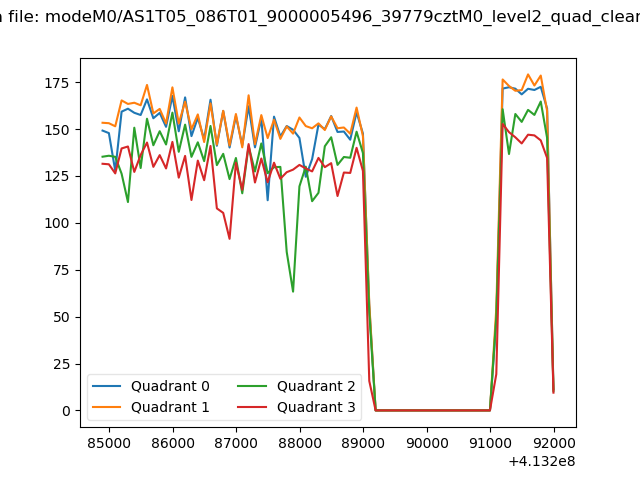 |
|
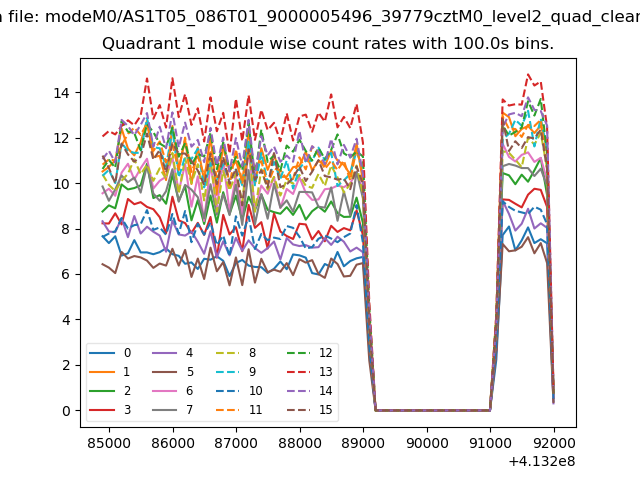
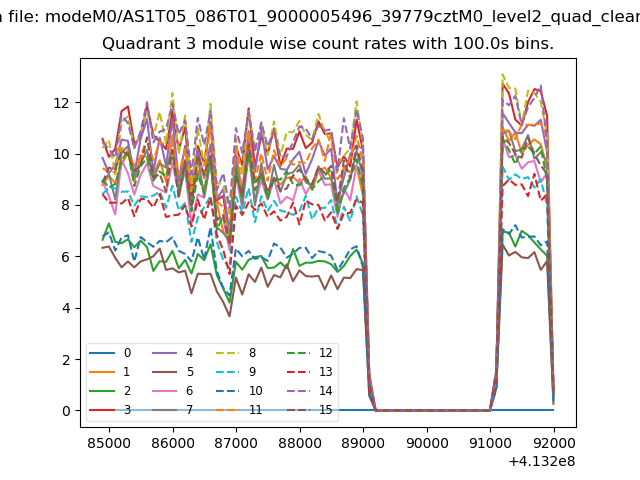
| Module-wise count rates for Quadrant A Data is divided into 100 sec bins |
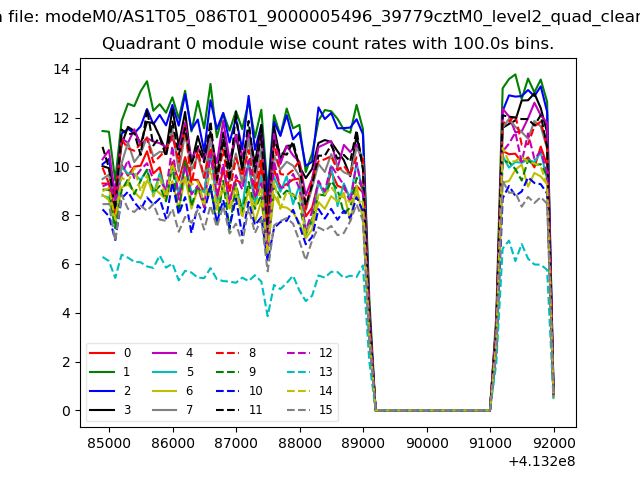 |
 |
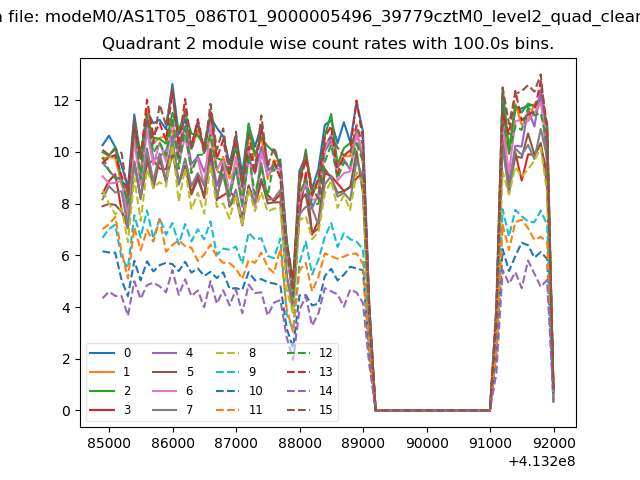
| Module-wise count rates for Quadrant B Data is divided into 100 sec bins |
 |
 |
| Module-wise count rates for Quadrant C Data is divided into 100 sec bins |
 |
 |
| Module-wise count rates for Quadrant D Data is divided into 100 sec bins |
 |
 |
| Parameter | Plot |
|---|---|
| CZT HV Monitor | 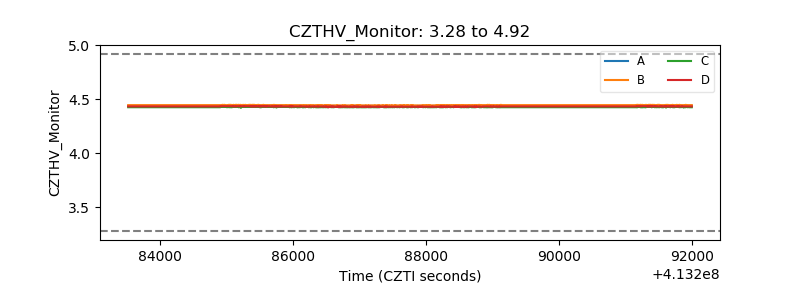 |
| D_VDD | 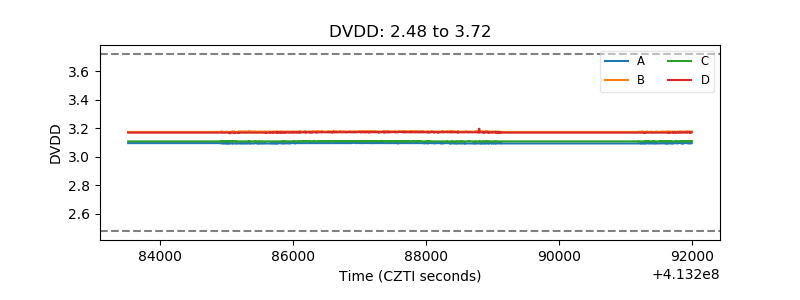 |
| Temperature 1 | 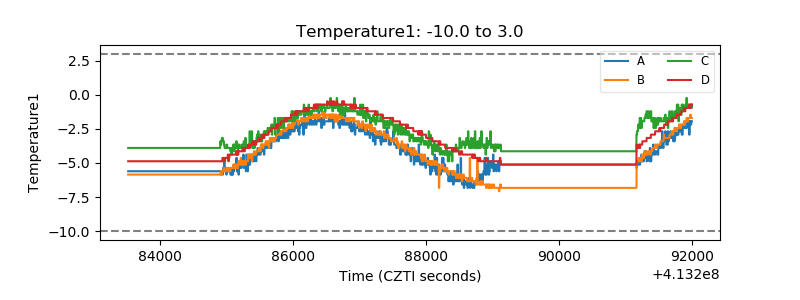 |
| Veto HV Monitor | 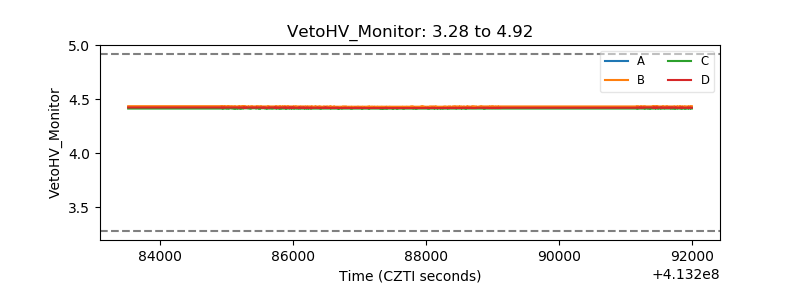 |
| Veto LLD |  |
| Alpha Counter | 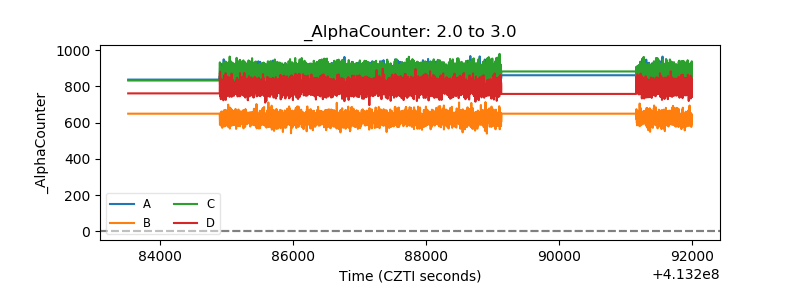 |
| _CPM_Rate | 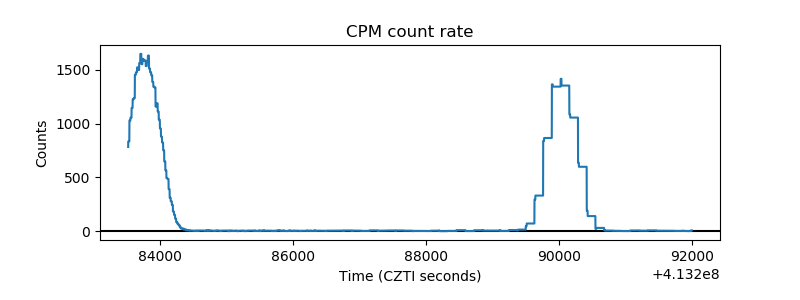 |
| CZT Counter | 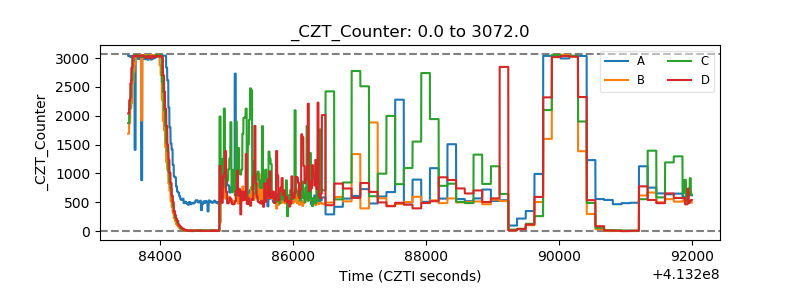 |
| +2.5 Volts monitor | 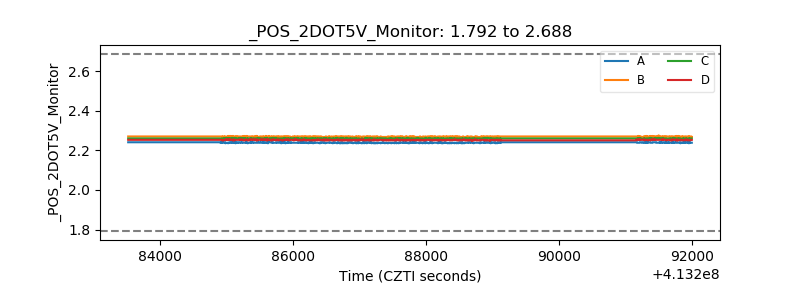 |
| +5 Volts monitor | 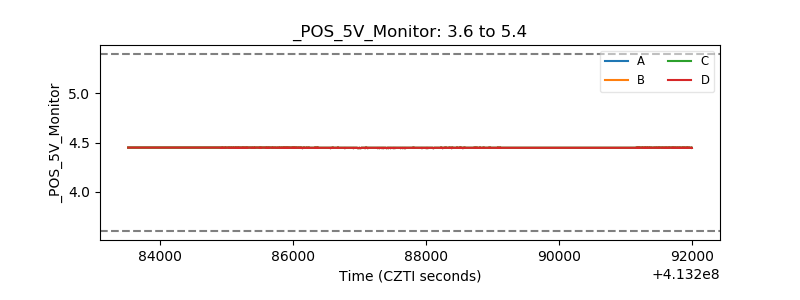 |
| _ROLL_ROT | 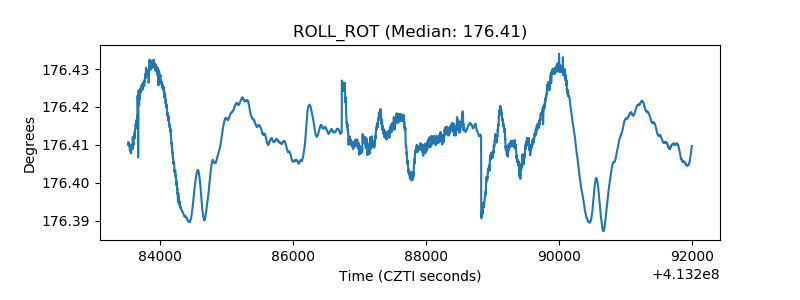 |
| _Roll_DEC | 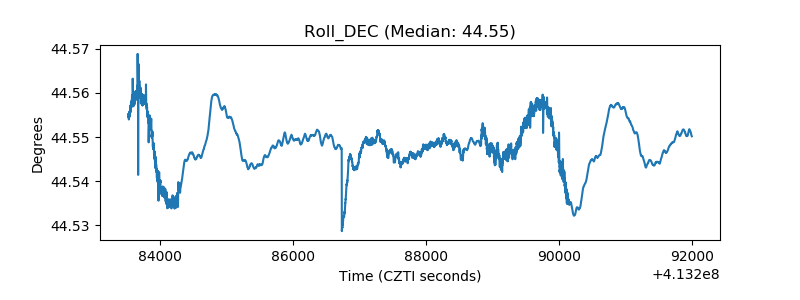 |
| _Roll_RA | 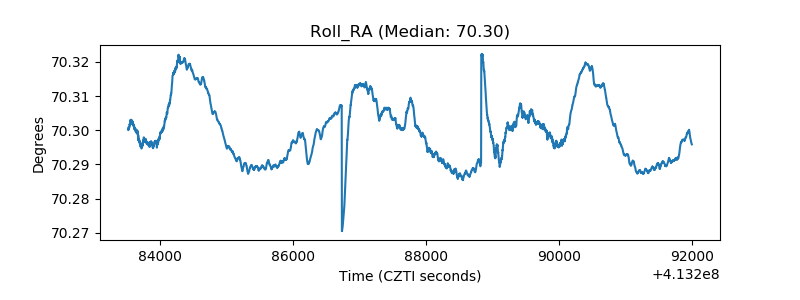 |
| Veto Counter | 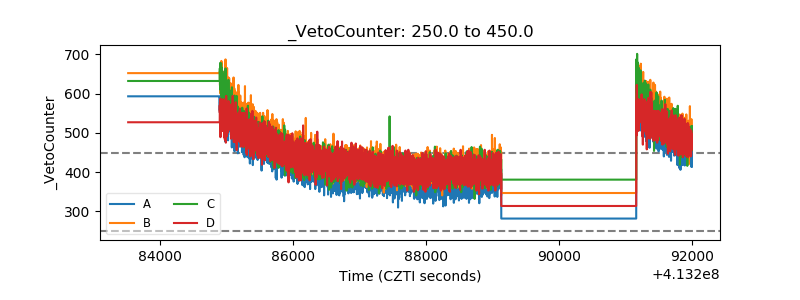 |