| Param | Original file | Final file |
|---|---|---|
| Filename | modeM0/AS1T05_086T01_9000005496_39780cztM0_level2.fits | modeM0/AS1T05_086T01_9000005496_39780cztM0_level2_quad_clean.evt |
| Size (bytes) | 389,234,880 | 106,375,680 |
| Size | 371.2 MB | 101.4 MB |
| Events in quadrant A | 3,104,564 | 776,186 |
| Events in quadrant B | 2,699,060 | 778,048 |
| Events in quadrant C | 4,924,058 | 671,443 |
| Events in quadrant D | 3,296,734 | 649,760 |
| Mode SS | |||
|---|---|---|---|
| Quadrant | BADHDUFLAG | Total packets | Discarded packets |
| A | 0 | 100 | 0 |
| B | 0 | 100 | 0 |
| C | 0 | 100 | 0 |
| D | 0 | 100 | 0 |
| Mode M9 | |||
|---|---|---|---|
| Quadrant | BADHDUFLAG | Total packets | Discarded packets |
| A | 0 | 22 | 0 |
| B | 0 | 22 | 0 |
| C | 0 | 22 | 0 |
| D | 0 | 22 | 0 |
| Mode M0 | |||
|---|---|---|---|
| Quadrant | BADHDUFLAG | Total packets | Discarded packets |
| A | 0 | 12383 | 3 |
| B | 0 | 10863 | 2 |
| C | 0 | 18005 | 2 |
| D | 0 | 12791 | 2 |
| Quadrant | Total seconds | Saturated seconds | Saturation percentage |
|---|---|---|---|
| A | 4937 | 25 | 0.506380% |
| B | 4937 | 21 | 0.425360% |
| C | 4937 | 494 | 10.006077% |
| D | 4938 | 166 | 3.361685% |
Noise dominated data is calculated using 1-second bins in cleaned event files. If a bin has >2000 counts, and if more than 50% of those come from <1% of pixels, then it is considered to be noise-dominated and hence unusable.
| Quadrant | # 1 sec bins | Bins with >0 counts | Bins with >2000 counts | High rate bins dominated by noise | Noise dominated (total time) | Noise dominated (detector-on time) | Marked lightcurve |
|---|---|---|---|---|---|---|---|
| A | 7060 | 4938 | 18 | 18 | 0.25% | 0.36% | 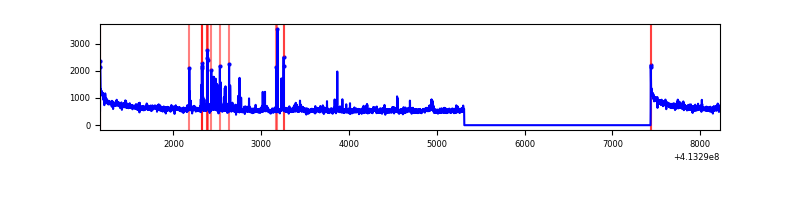 |
| B | 7060 | 4938 | 5 | 5 | 0.07% | 0.10% | 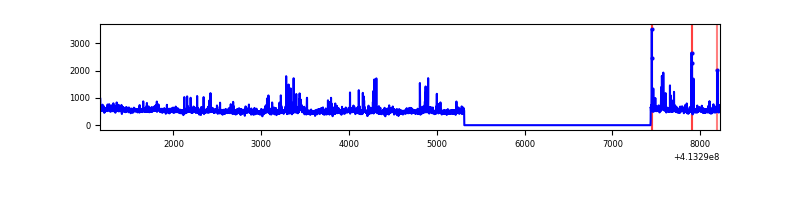 |
| C | 7060 | 4938 | 461 | 461 | 6.53% | 9.34% | 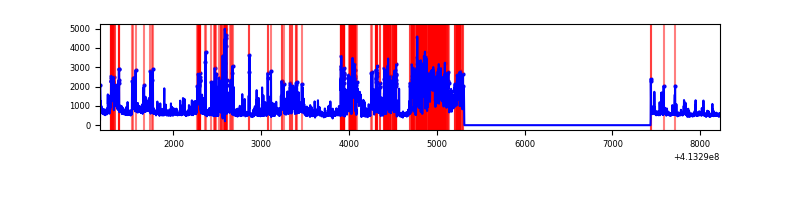 |
| D | 7061 | 4939 | 145 | 145 | 2.05% | 2.94% | 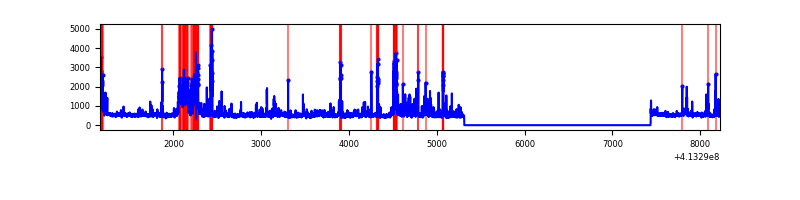 |
Top three noisy pixels from each quadrant. If the there are fewer than three noisy pixels in the level2.evt file, extra rows are filled as -1
| Pixel properties | Quadrant properties | ||||||
|---|---|---|---|---|---|---|---|
| Quadrant | DetID | PixID | Counts | Sigma | Mean | Median | Sigma |
| A | 10 | 83 | 455758 | 3375.26 | 643 | 633 | 134.8 |
| A | 13 | 248 | 66649 | 489.58 | 643 | 633 | 134.8 |
| A | 9 | 143 | 51639 | 378.27 | 643 | 633 | 134.8 |
| B | 5 | 172 | 110752 | 882.2 | 631 | 619 | 124.8 |
| B | 0 | 190 | 32232 | 253.23 | 631 | 619 | 124.8 |
| B | 5 | 255 | 22908 | 178.54 | 631 | 619 | 124.8 |
| C | 9 | 187 | 2015350 | 14118.07 | 593 | 600 | 142.7 |
| C | 15 | 208 | 268852 | 1879.74 | 593 | 600 | 142.7 |
| C | 15 | 214 | 204118 | 1426.12 | 593 | 600 | 142.7 |
| D | 12 | 233 | 518977 | 3337.01 | 613 | 599 | 155.3 |
| D | 13 | 249 | 202358 | 1298.8 | 613 | 599 | 155.3 |
| D | 12 | 227 | 129626 | 830.6 | 613 | 599 | 155.3 |
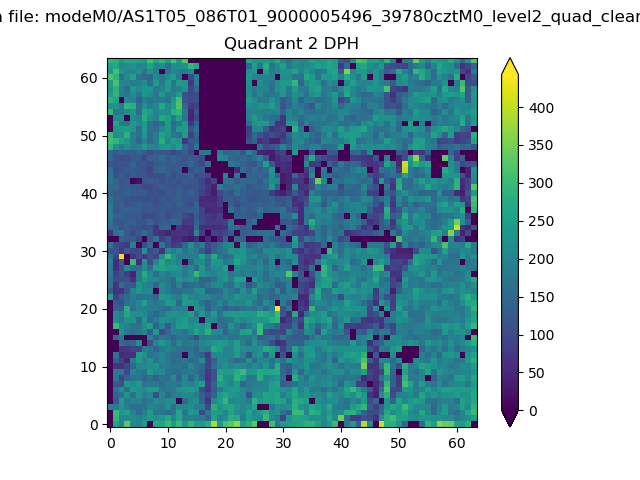
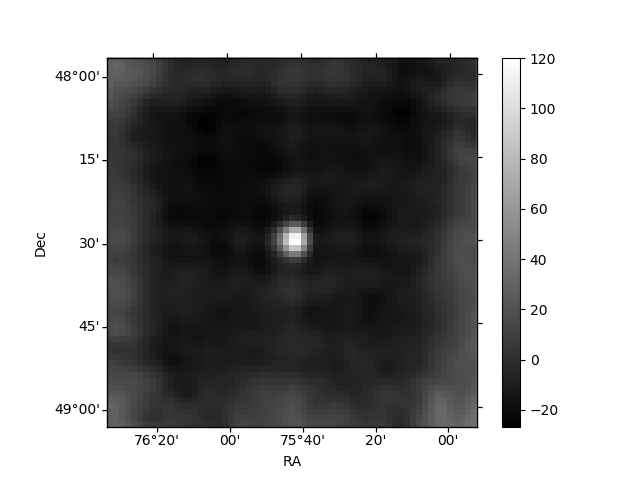
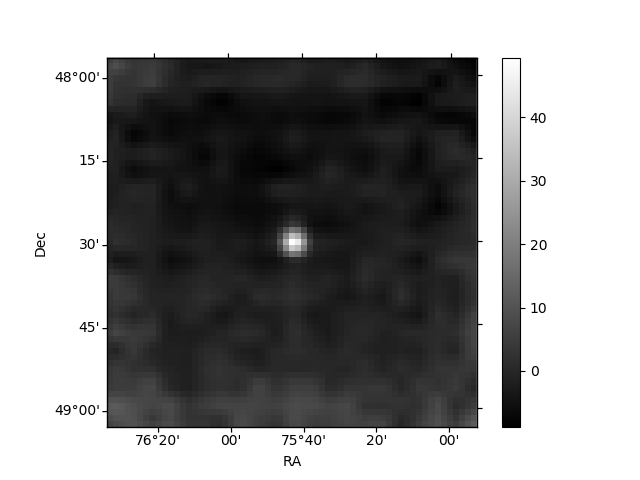
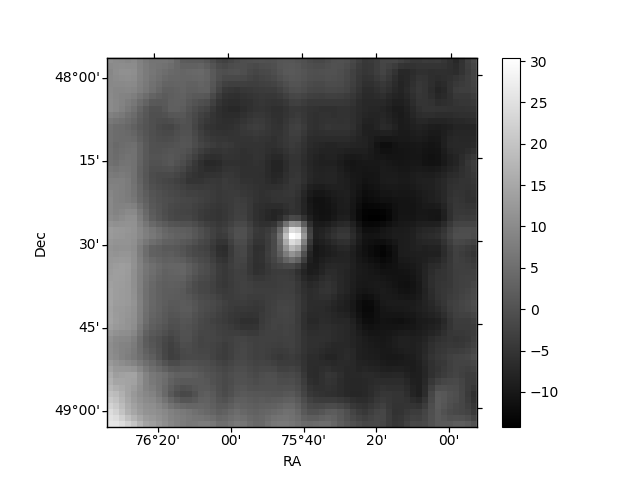
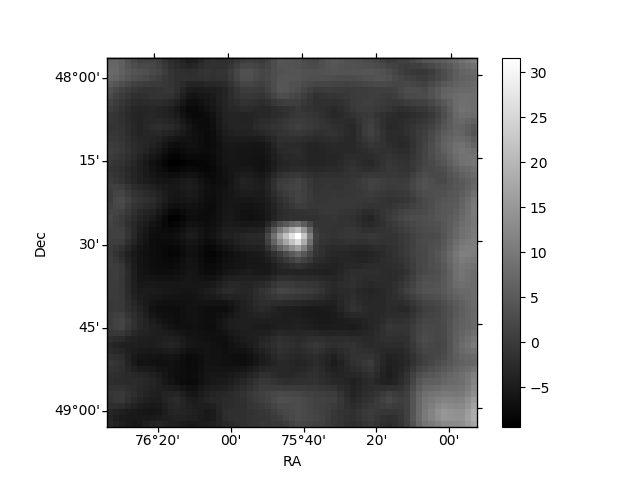
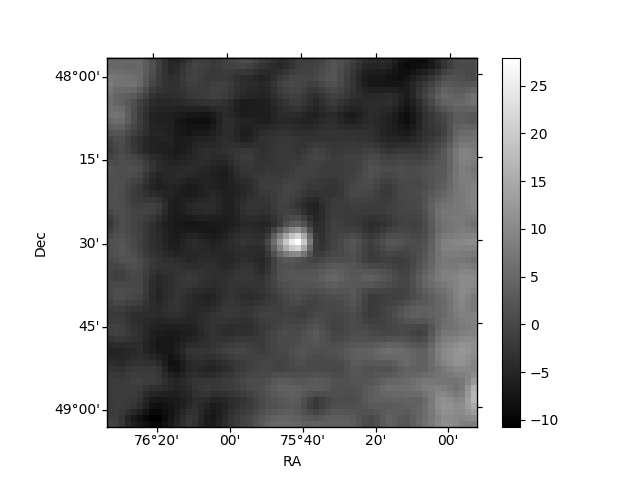
Histogram calculated using DETX and DETY for each event in the final _common_clean file
| Quadrant A | 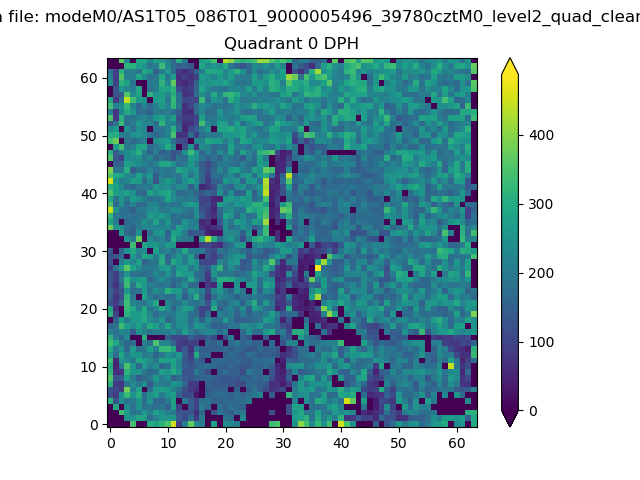 |
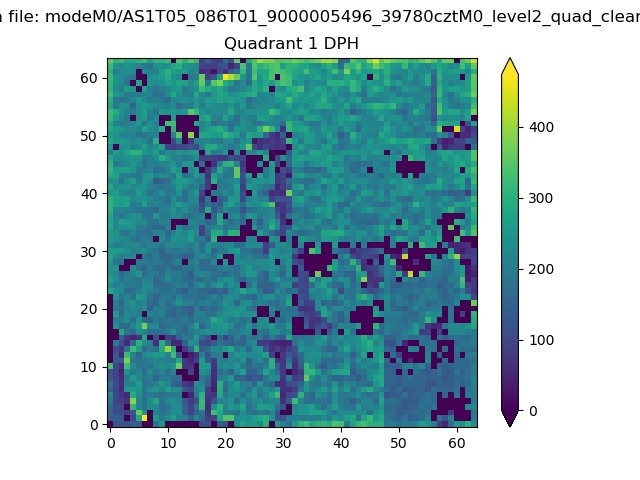 |
Quadrant B |
|---|---|---|---|
| Quadrant D | 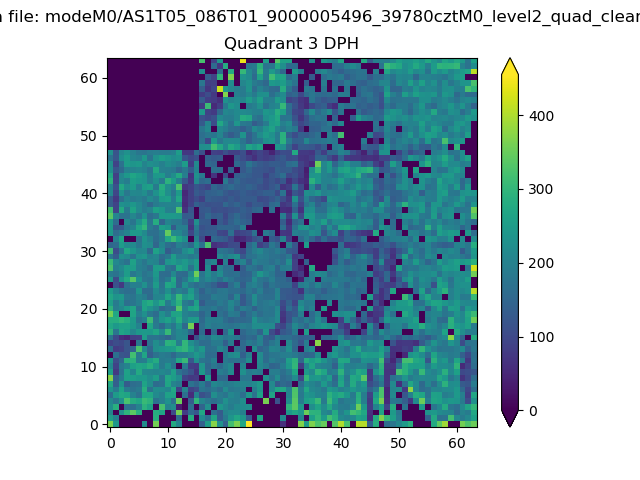 |
 |
Quadrant C |
| Plot type | Count rate plots | Images |
|---|---|---|
| Comparison with Poisson distribution Blue bars denote a histogram of data divided into 1 sec bins. Red curve is a Poisson curve with rate = median count rate of data. |
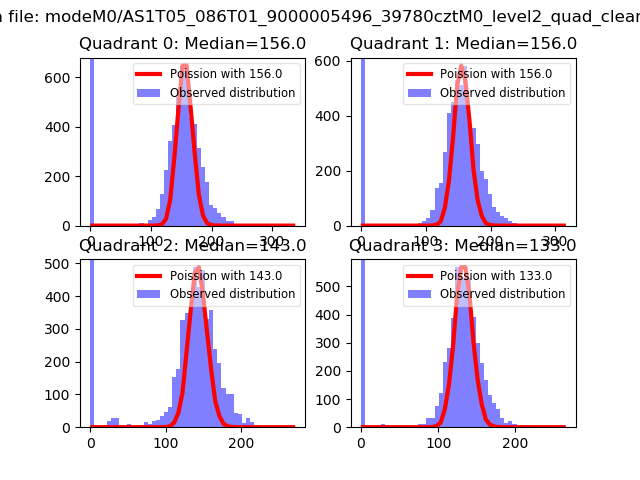 |
 |
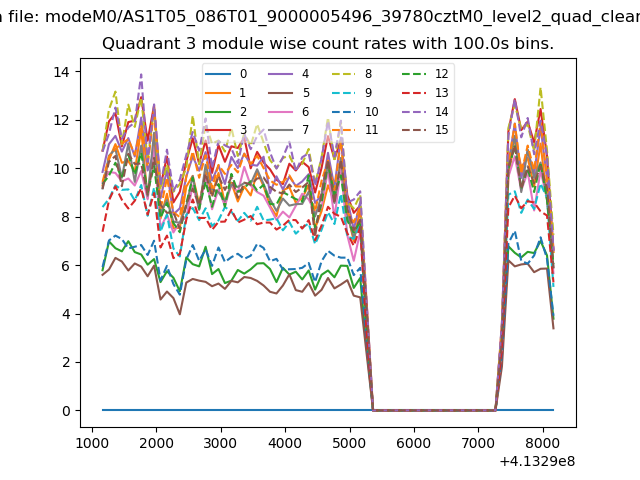
| Quadrant-wise count rates Data is divided into 100 sec bins |
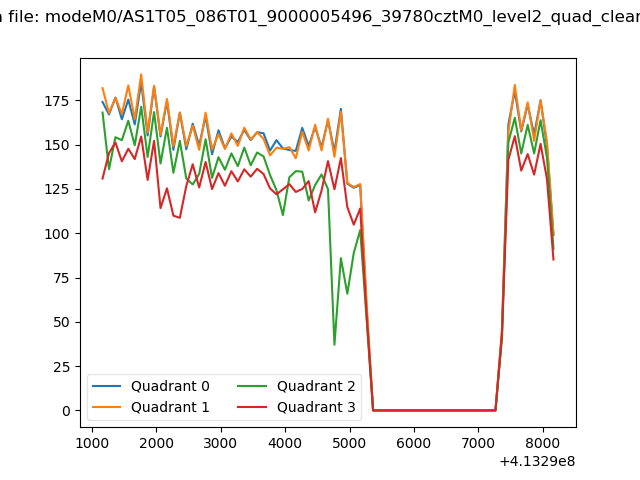 |
|
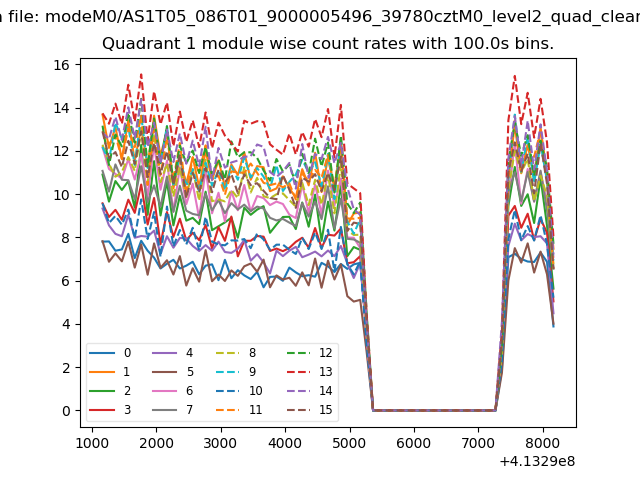
| Module-wise count rates for Quadrant A Data is divided into 100 sec bins |
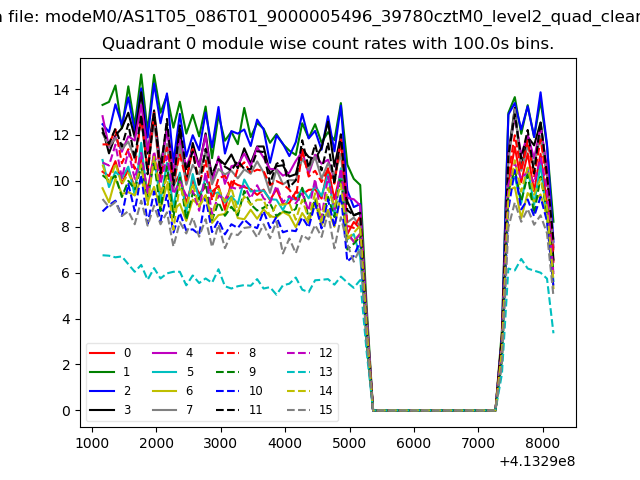 |
 |
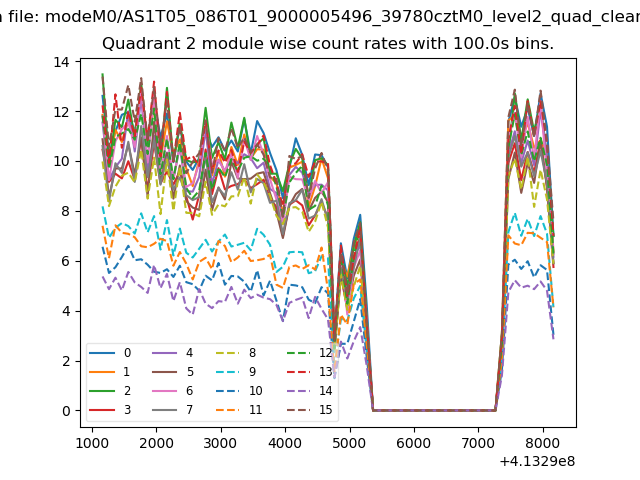
| Module-wise count rates for Quadrant B Data is divided into 100 sec bins |
 |
 |
| Module-wise count rates for Quadrant C Data is divided into 100 sec bins |
 |
 |
| Module-wise count rates for Quadrant D Data is divided into 100 sec bins |
 |
 |
| Parameter | Plot |
|---|---|
| CZT HV Monitor | 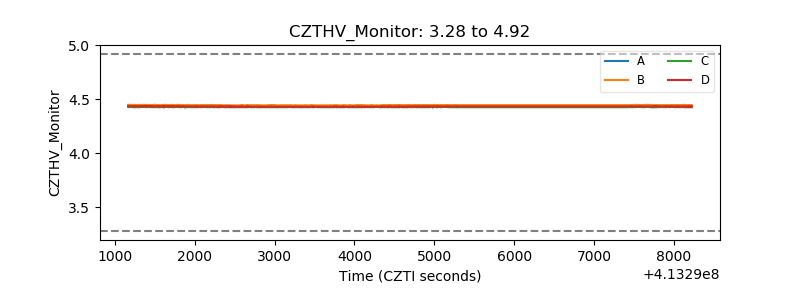 |
| D_VDD | 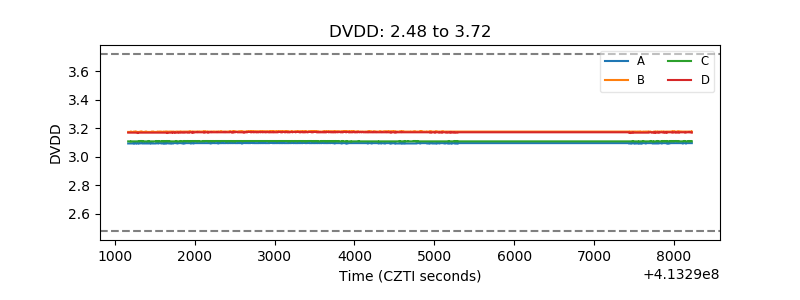 |
| Temperature 1 | 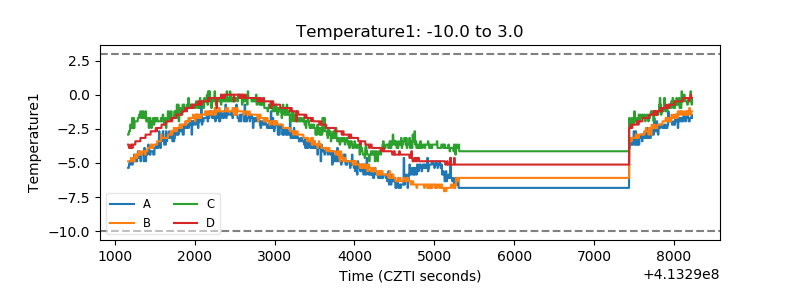 |
| Veto HV Monitor | 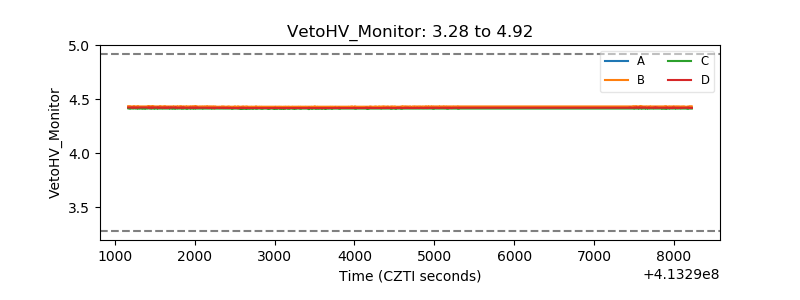 |
| Veto LLD | 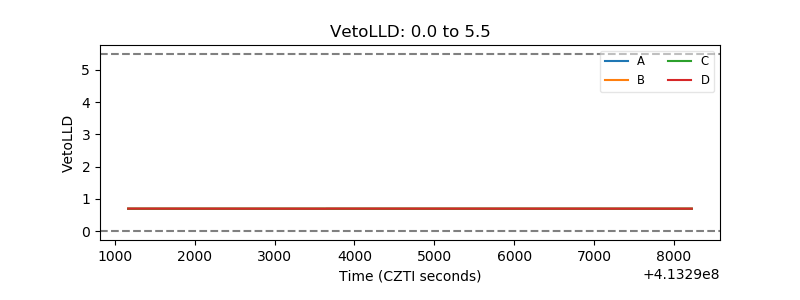 |
| Alpha Counter | 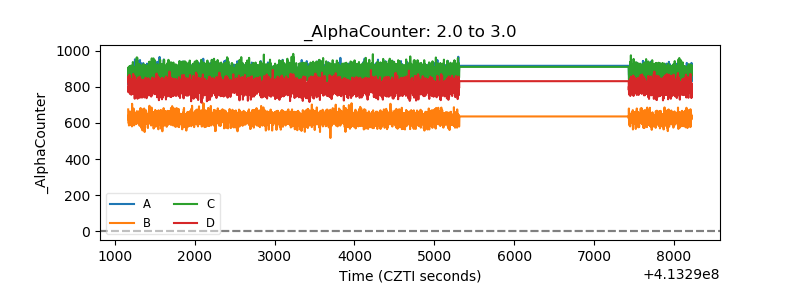 |
| _CPM_Rate | 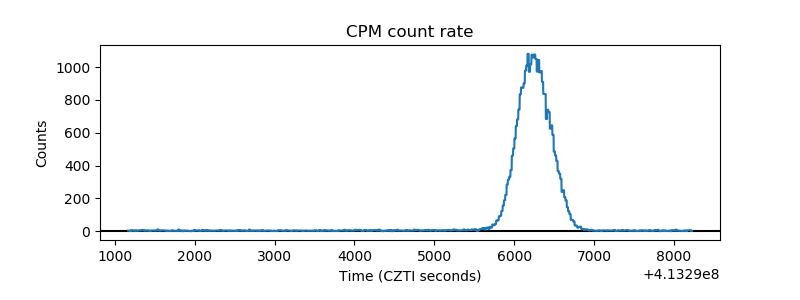 |
| CZT Counter | 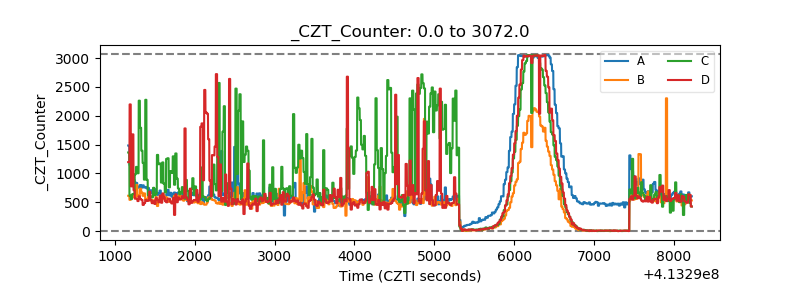 |
| +2.5 Volts monitor | 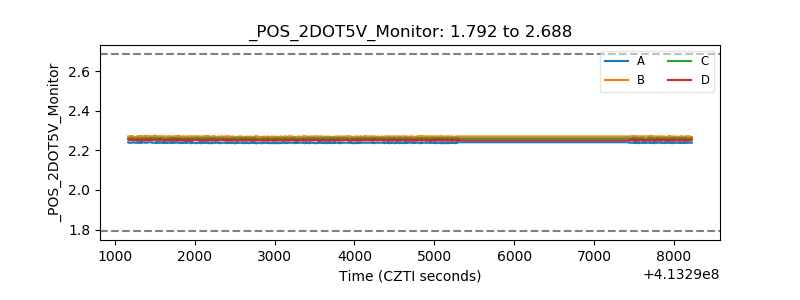 |
| +5 Volts monitor | 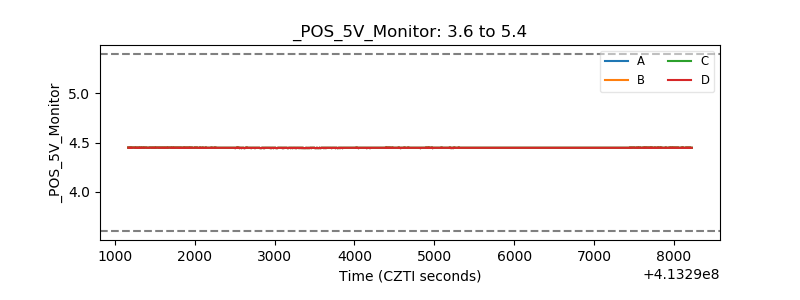 |
| _ROLL_ROT | 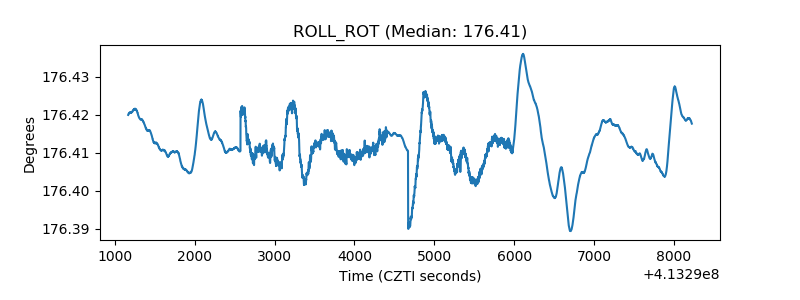 |
| _Roll_DEC | 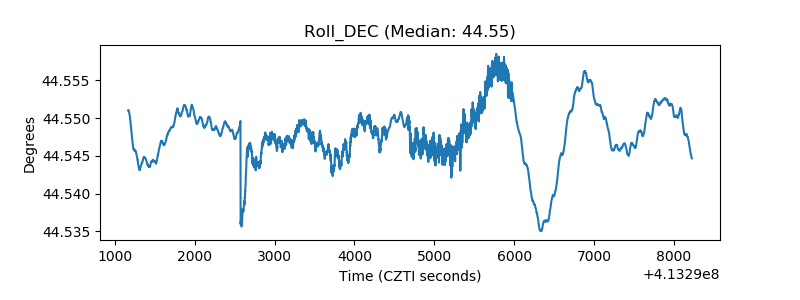 |
| _Roll_RA | 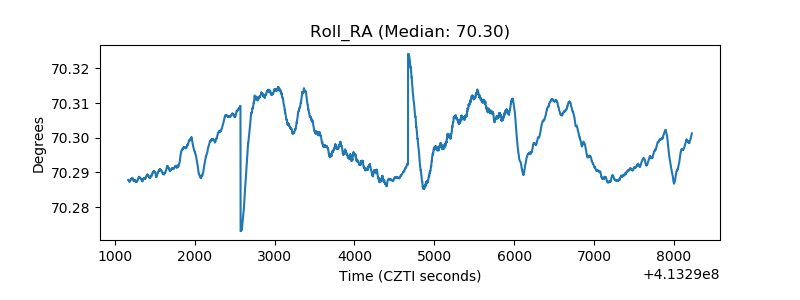 |
| Veto Counter | 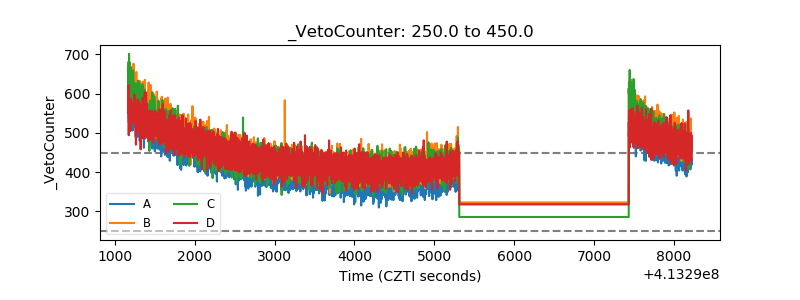 |