| Param | Original file | Final file |
|---|---|---|
| Filename | modeM0/AS1T05_086T01_9000005496_39782cztM0_level2.fits | modeM0/AS1T05_086T01_9000005496_39782cztM0_level2_quad_clean.evt |
| Size (bytes) | 460,301,760 | 94,921,920 |
| Size | 439.0 MB | 90.5 MB |
| Events in quadrant A | 2,943,122 | 704,956 |
| Events in quadrant B | 3,202,927 | 696,884 |
| Events in quadrant C | 4,513,457 | 649,257 |
| Events in quadrant D | 5,981,480 | 463,998 |
| Mode SS | |||
|---|---|---|---|
| Quadrant | BADHDUFLAG | Total packets | Discarded packets |
| A | 0 | 106 | 0 |
| B | 0 | 106 | 0 |
| C | 0 | 106 | 0 |
| D | 0 | 106 | 0 |
| Mode M9 | |||
|---|---|---|---|
| Quadrant | BADHDUFLAG | Total packets | Discarded packets |
| A | 0 | 20 | 0 |
| B | 0 | 20 | 0 |
| C | 0 | 20 | 0 |
| D | 0 | 20 | 0 |
| Mode M0 | |||
|---|---|---|---|
| Quadrant | BADHDUFLAG | Total packets | Discarded packets |
| A | 0 | 11826 | 2 |
| B | 0 | 12785 | 1 |
| C | 0 | 16889 | 1 |
| D | 0 | 21252 | 1 |
| Quadrant | Total seconds | Saturated seconds | Saturation percentage |
|---|---|---|---|
| A | 5123 | 25 | 0.487995% |
| B | 5123 | 126 | 2.459496% |
| C | 5123 | 209 | 4.079641% |
| D | 5123 | 1337 | 26.097989% |
Noise dominated data is calculated using 1-second bins in cleaned event files. If a bin has >2000 counts, and if more than 50% of those come from <1% of pixels, then it is considered to be noise-dominated and hence unusable.
| Quadrant | # 1 sec bins | Bins with >0 counts | Bins with >2000 counts | High rate bins dominated by noise | Noise dominated (total time) | Noise dominated (detector-on time) | Marked lightcurve |
|---|---|---|---|---|---|---|---|
| A | 7156 | 5124 | 17 | 17 | 0.24% | 0.33% | 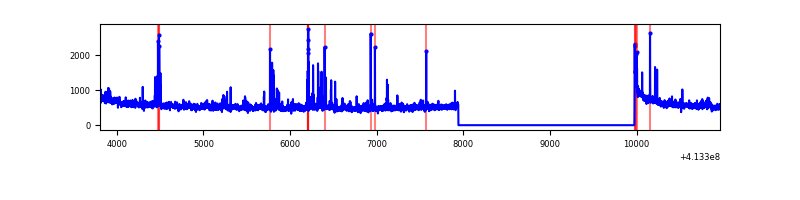 |
| B | 7156 | 5124 | 97 | 97 | 1.36% | 1.89% | 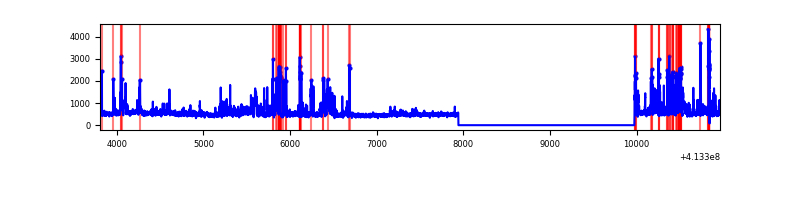 |
| C | 7156 | 5124 | 249 | 249 | 3.48% | 4.86% | 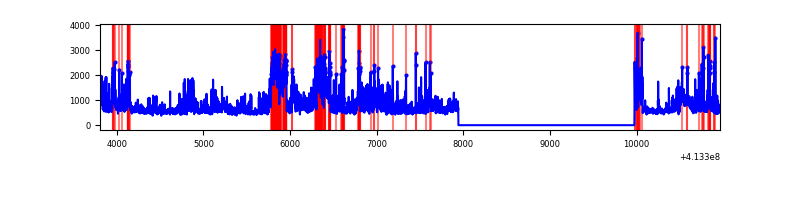 |
| D | 7156 | 5124 | 1299 | 1299 | 18.15% | 25.35% | 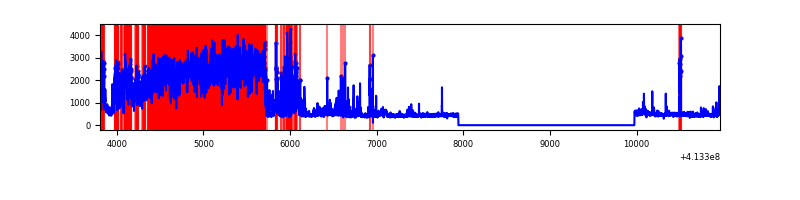 |
Top three noisy pixels from each quadrant. If the there are fewer than three noisy pixels in the level2.evt file, extra rows are filled as -1
| Pixel properties | Quadrant properties | ||||||
|---|---|---|---|---|---|---|---|
| Quadrant | DetID | PixID | Counts | Sigma | Mean | Median | Sigma |
| A | 10 | 83 | 430131 | 3370.45 | 605 | 596 | 127.4 |
| A | 9 | 143 | 61404 | 477.14 | 605 | 596 | 127.4 |
| A | 2 | 79 | 57440 | 446.04 | 605 | 596 | 127.4 |
| B | 5 | 172 | 689820 | 5881.83 | 595 | 582 | 117.2 |
| B | 5 | 32 | 75369 | 638.22 | 595 | 582 | 117.2 |
| B | 0 | 190 | 43164 | 363.39 | 595 | 582 | 117.2 |
| C | 9 | 187 | 1107348 | 7961.57 | 581 | 589 | 139.0 |
| C | 15 | 208 | 550084 | 3952.84 | 581 | 589 | 139.0 |
| C | 14 | 254 | 358851 | 2577.19 | 581 | 589 | 139.0 |
| D | 12 | 233 | 3028222 | 22943.99 | 526 | 513 | 132.0 |
| D | 12 | 227 | 270546 | 2046.31 | 526 | 513 | 132.0 |
| D | 6 | 240 | 257115 | 1944.53 | 526 | 513 | 132.0 |
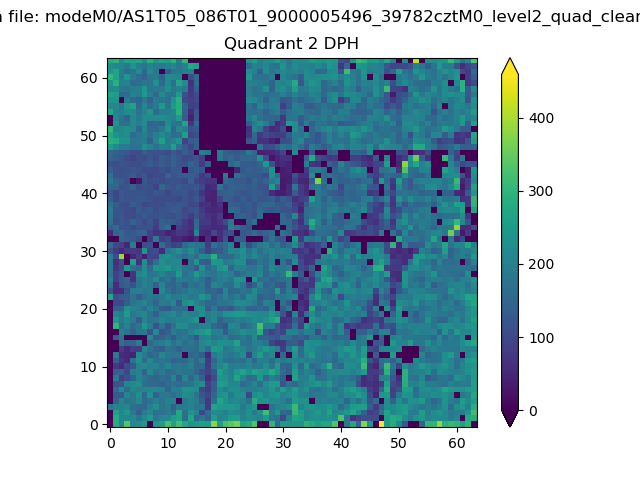
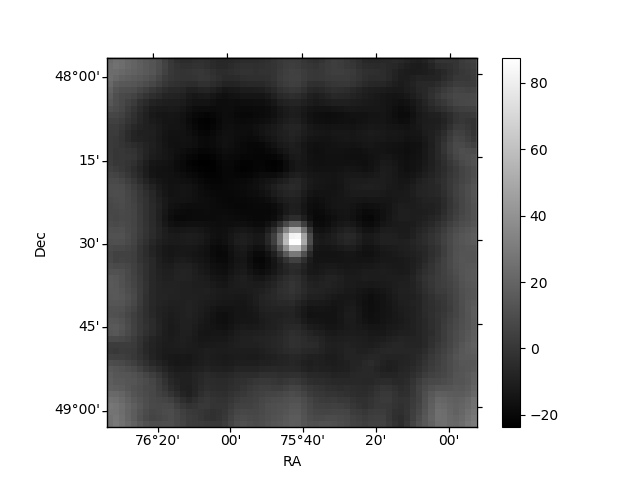
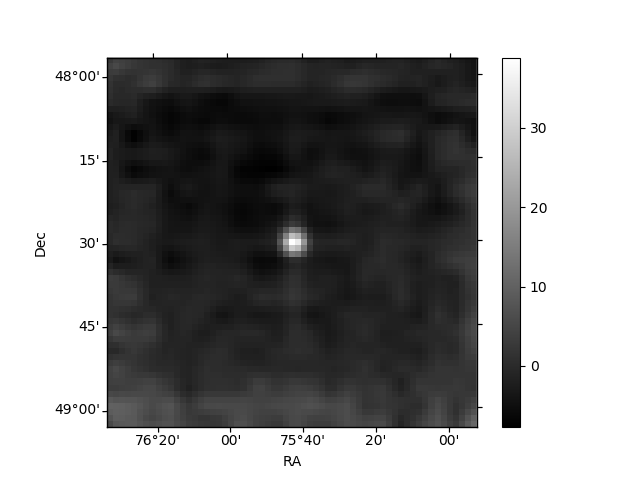
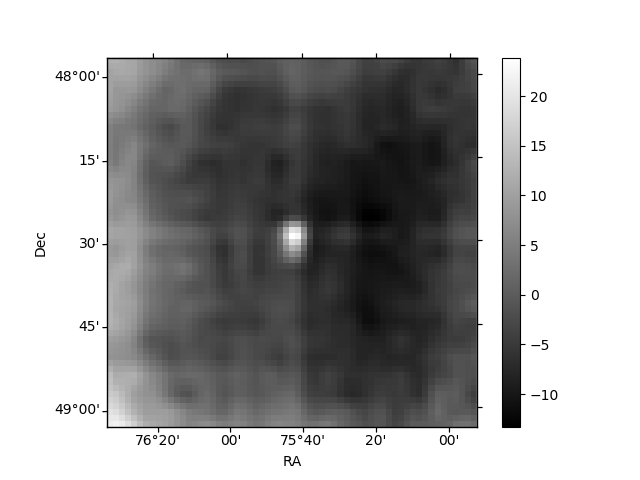
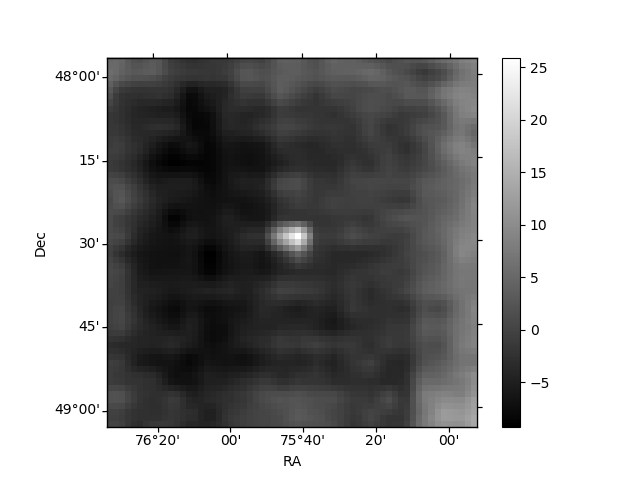
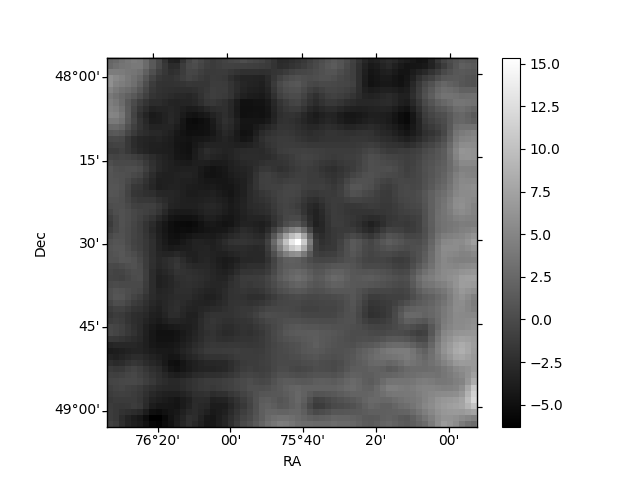
Histogram calculated using DETX and DETY for each event in the final _common_clean file
| Quadrant A | 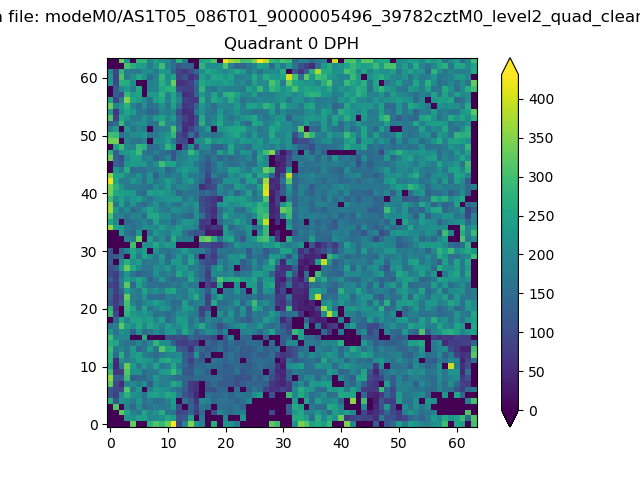 |
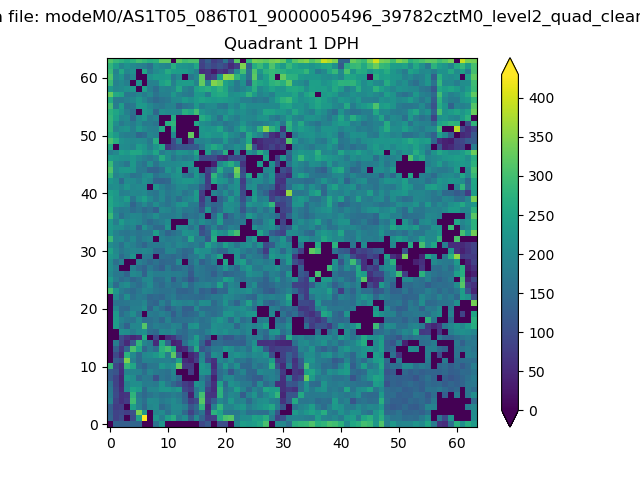 |
Quadrant B |
|---|---|---|---|
| Quadrant D | 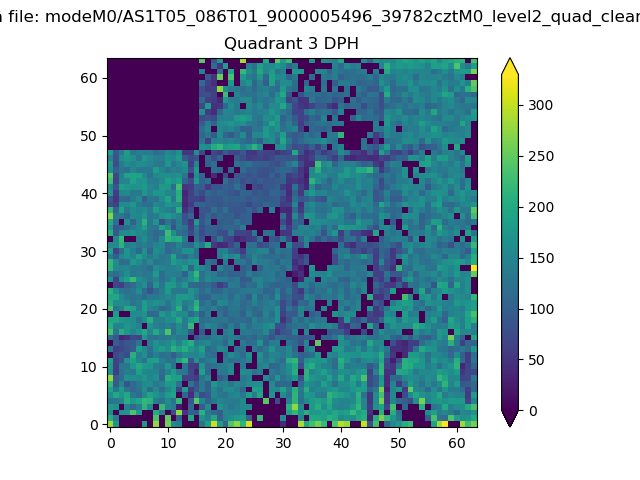 |
 |
Quadrant C |
| Plot type | Count rate plots | Images |
|---|---|---|
| Comparison with Poisson distribution Blue bars denote a histogram of data divided into 1 sec bins. Red curve is a Poisson curve with rate = median count rate of data. |
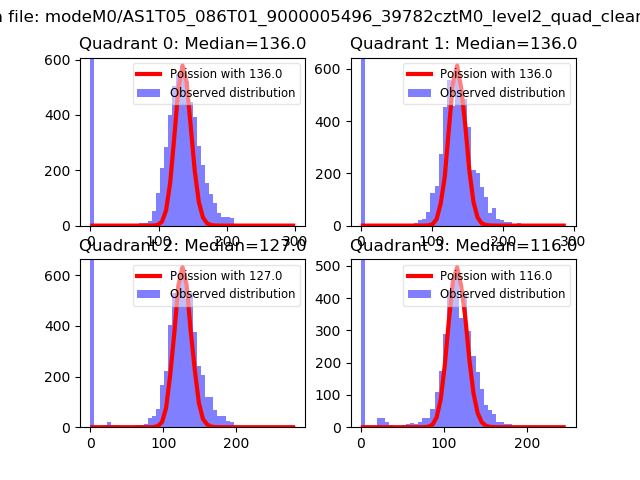 |
 |
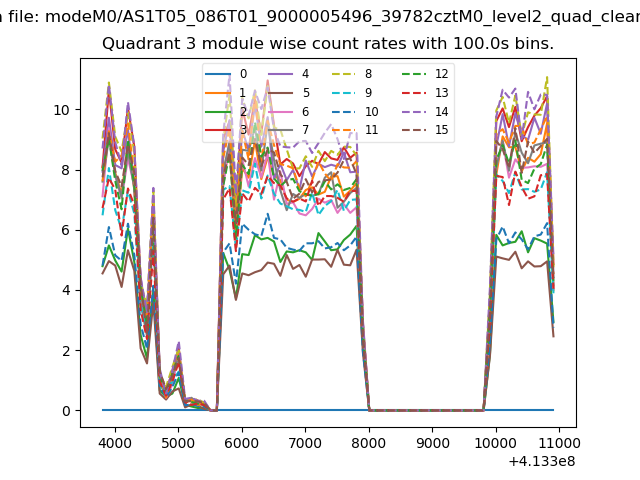
| Quadrant-wise count rates Data is divided into 100 sec bins |
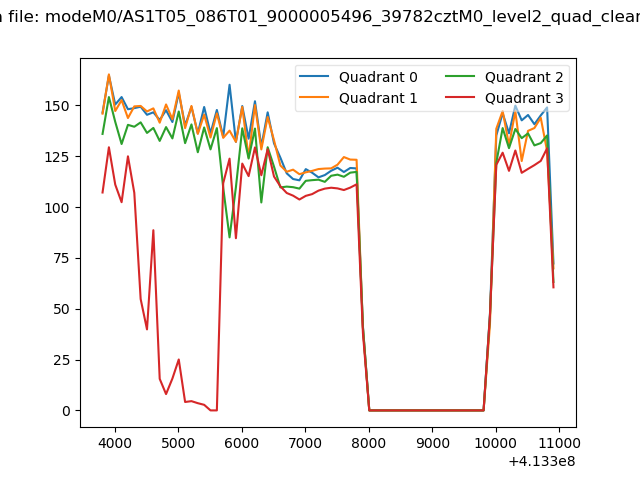 |
|
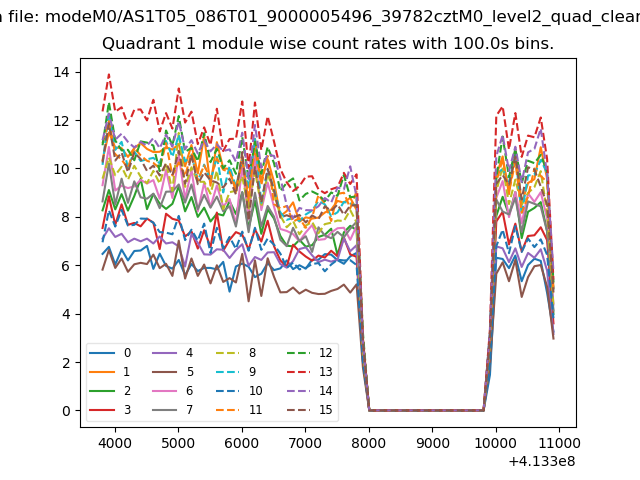
| Module-wise count rates for Quadrant A Data is divided into 100 sec bins |
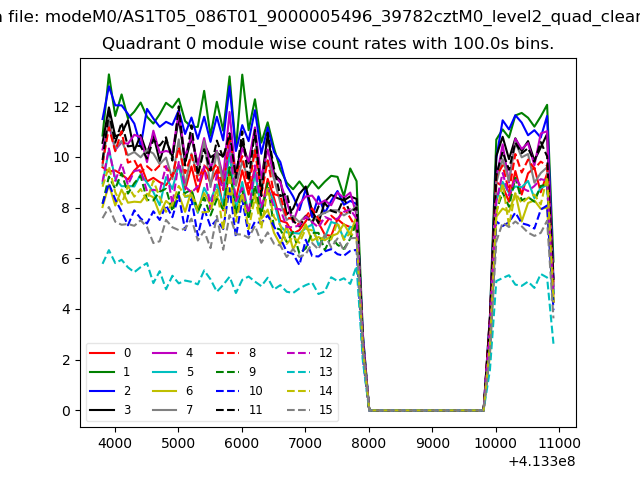 |
 |
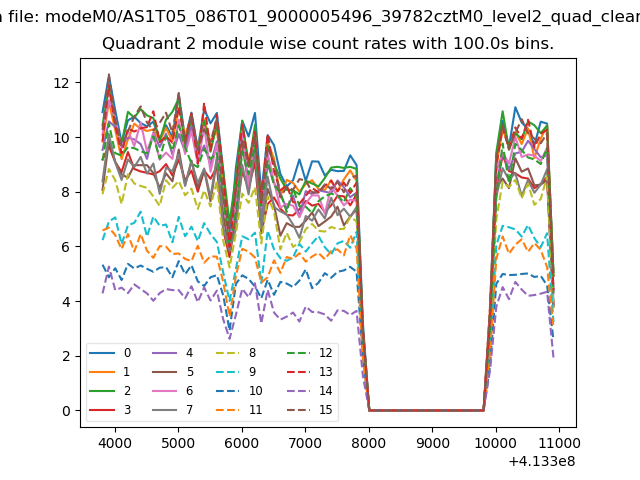
| Module-wise count rates for Quadrant B Data is divided into 100 sec bins |
 |
 |
| Module-wise count rates for Quadrant C Data is divided into 100 sec bins |
 |
 |
| Module-wise count rates for Quadrant D Data is divided into 100 sec bins |
 |
 |
| Parameter | Plot |
|---|---|
| CZT HV Monitor | 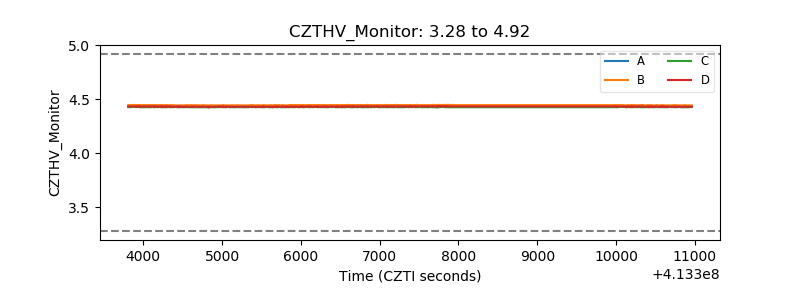 |
| D_VDD | 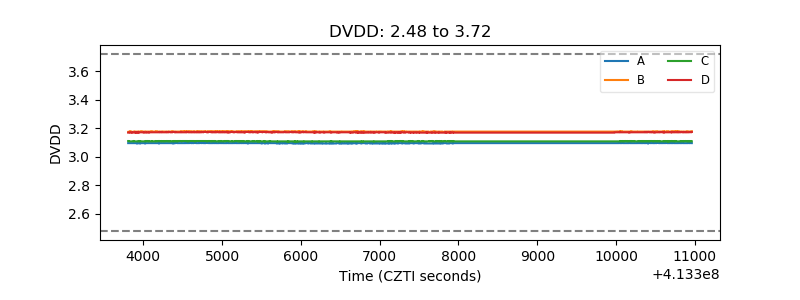 |
| Temperature 1 | 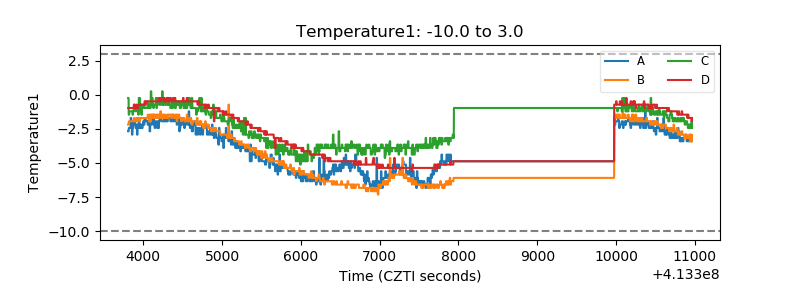 |
| Veto HV Monitor | 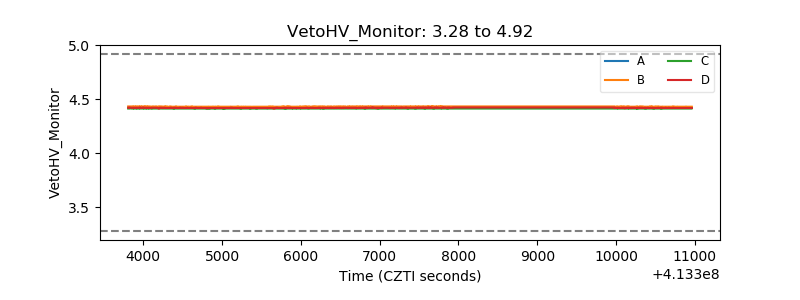 |
| Veto LLD | 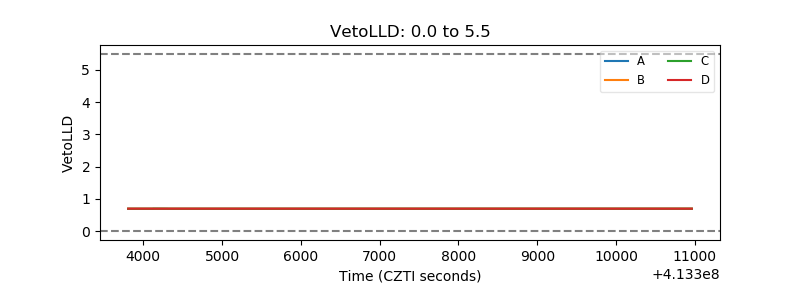 |
| Alpha Counter | 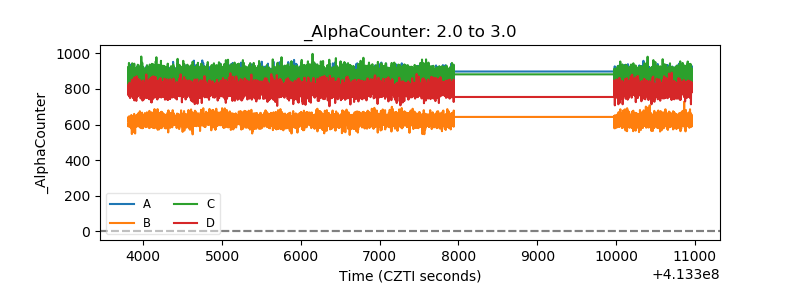 |
| _CPM_Rate | 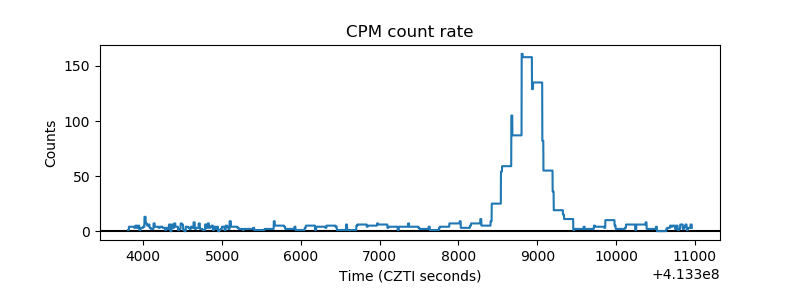 |
| CZT Counter | 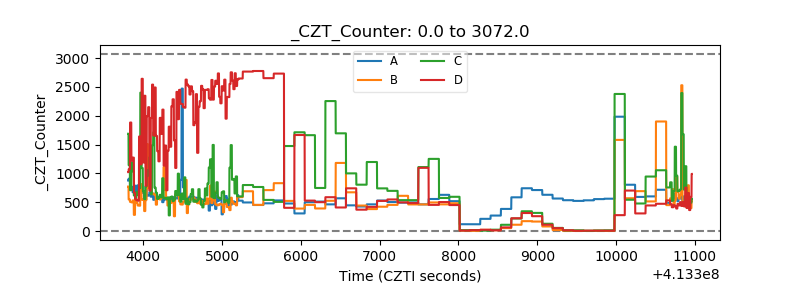 |
| +2.5 Volts monitor | 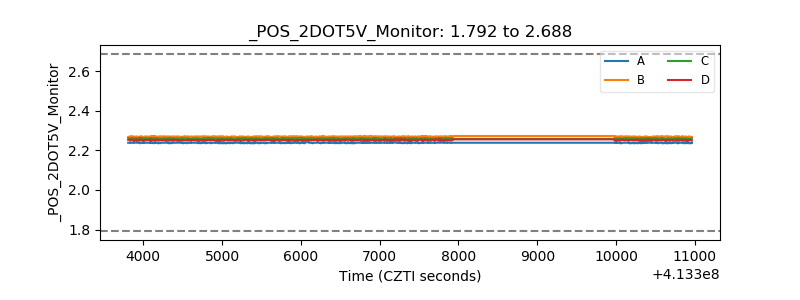 |
| +5 Volts monitor | 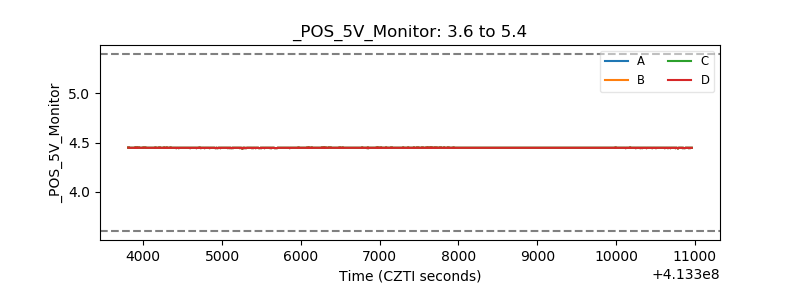 |
| _ROLL_ROT | 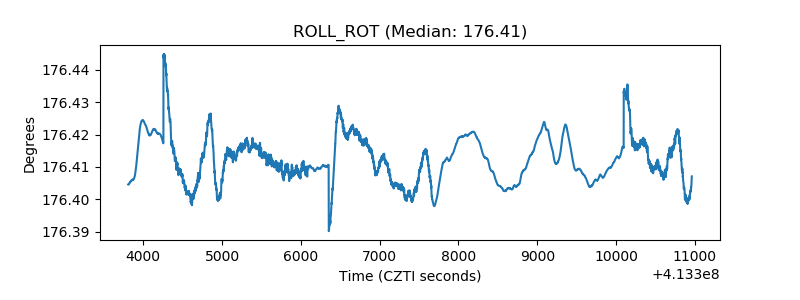 |
| _Roll_DEC | 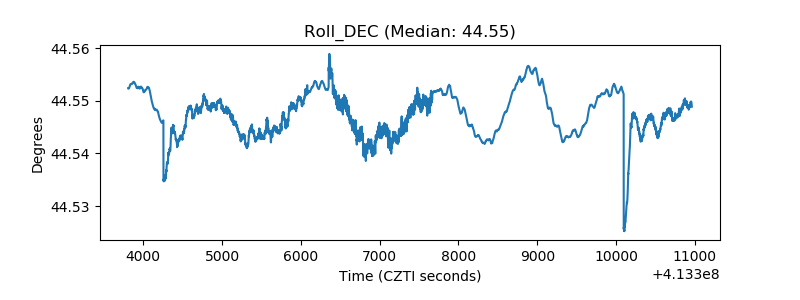 |
| _Roll_RA | 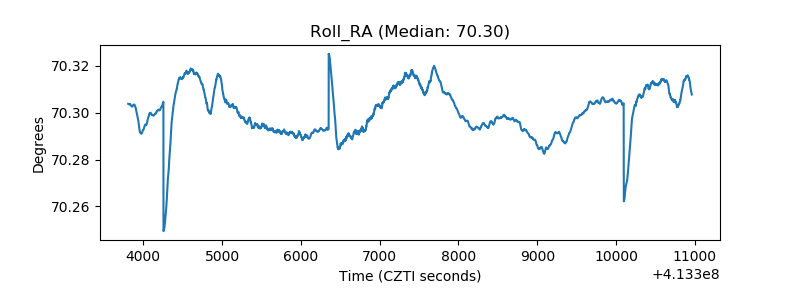 |
| Veto Counter | 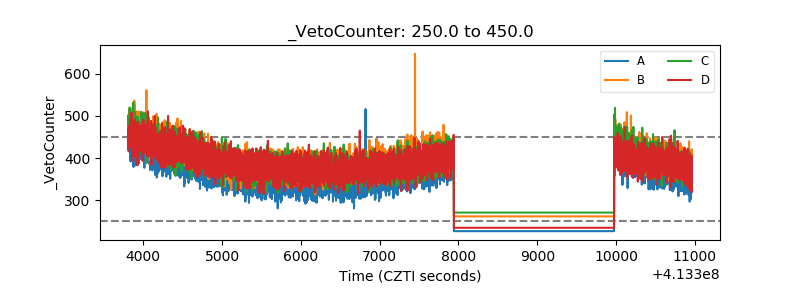 |