| Param | Original file | Final file |
|---|---|---|
| Filename | modeM0/AS1T05_086T01_9000005496_39783cztM0_level2.fits | modeM0/AS1T05_086T01_9000005496_39783cztM0_level2_quad_clean.evt |
| Size (bytes) | 345,539,520 | 99,745,920 |
| Size | 329.5 MB | 95.1 MB |
| Events in quadrant A | 2,985,403 | 696,179 |
| Events in quadrant B | 3,150,732 | 689,692 |
| Events in quadrant C | 3,382,893 | 661,078 |
| Events in quadrant D | 2,857,451 | 601,086 |
| Mode SS | |||
|---|---|---|---|
| Quadrant | BADHDUFLAG | Total packets | Discarded packets |
| A | 0 | 108 | 0 |
| B | 0 | 108 | 0 |
| C | 0 | 108 | 0 |
| D | 0 | 108 | 0 |
| Mode M9 | |||
|---|---|---|---|
| Quadrant | BADHDUFLAG | Total packets | Discarded packets |
| A | 0 | 19 | 0 |
| B | 0 | 19 | 0 |
| C | 0 | 19 | 0 |
| D | 0 | 20 | 0 |
| Mode M0 | |||
|---|---|---|---|
| Quadrant | BADHDUFLAG | Total packets | Discarded packets |
| A | 0 | 12125 | 3 |
| B | 0 | 12818 | 2 |
| C | 0 | 13490 | 2 |
| D | 0 | 12049 | 2 |
| Quadrant | Total seconds | Saturated seconds | Saturation percentage |
|---|---|---|---|
| A | 5323 | 19 | 0.356942% |
| B | 5323 | 118 | 2.216795% |
| C | 5323 | 63 | 1.183543% |
| D | 5323 | 93 | 1.747135% |
Noise dominated data is calculated using 1-second bins in cleaned event files. If a bin has >2000 counts, and if more than 50% of those come from <1% of pixels, then it is considered to be noise-dominated and hence unusable.
| Quadrant | # 1 sec bins | Bins with >0 counts | Bins with >2000 counts | High rate bins dominated by noise | Noise dominated (total time) | Noise dominated (detector-on time) | Marked lightcurve |
|---|---|---|---|---|---|---|---|
| A | 7084 | 5324 | 8 | 8 | 0.11% | 0.15% | 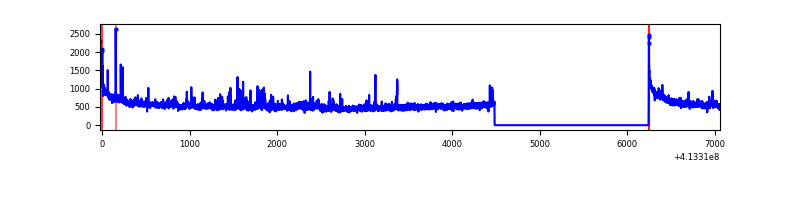 |
| B | 7084 | 5324 | 79 | 79 | 1.12% | 1.48% | 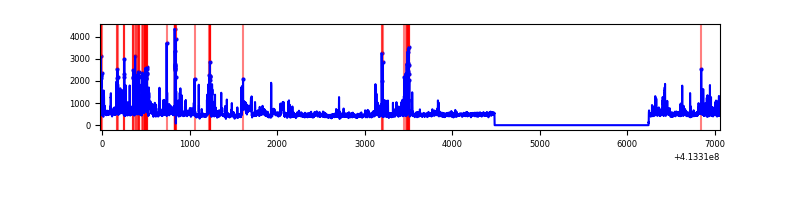 |
| C | 7084 | 5324 | 54 | 54 | 0.76% | 1.01% | 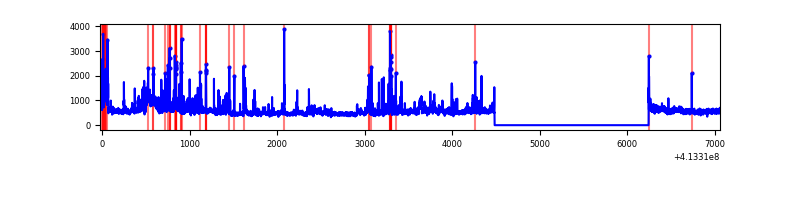 |
| D | 7084 | 5324 | 85 | 85 | 1.20% | 1.60% | 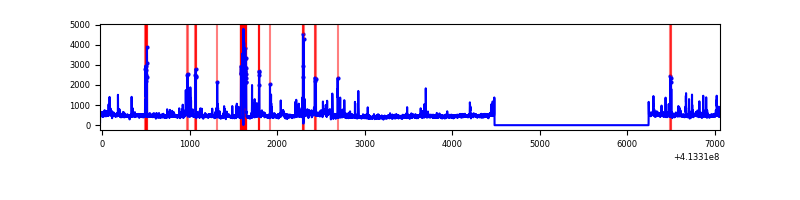 |
Top three noisy pixels from each quadrant. If the there are fewer than three noisy pixels in the level2.evt file, extra rows are filled as -1
| Pixel properties | Quadrant properties | ||||||
|---|---|---|---|---|---|---|---|
| Quadrant | DetID | PixID | Counts | Sigma | Mean | Median | Sigma |
| A | 10 | 83 | 481657 | 3737.55 | 613 | 605 | 128.7 |
| A | 2 | 79 | 73109 | 563.32 | 613 | 605 | 128.7 |
| A | 9 | 143 | 36306 | 277.38 | 613 | 605 | 128.7 |
| B | 5 | 172 | 517593 | 4306.34 | 606 | 593 | 120.1 |
| B | 5 | 32 | 89217 | 738.19 | 606 | 593 | 120.1 |
| B | 15 | 85 | 59607 | 491.56 | 606 | 593 | 120.1 |
| C | 15 | 208 | 426567 | 3003.17 | 595 | 601 | 141.8 |
| C | 14 | 254 | 391700 | 2757.34 | 595 | 601 | 141.8 |
| C | 15 | 214 | 221265 | 1555.74 | 595 | 601 | 141.8 |
| D | 13 | 249 | 276102 | 1831.54 | 592 | 576 | 150.4 |
| D | 6 | 240 | 115193 | 761.91 | 592 | 576 | 150.4 |
| D | 12 | 233 | 53318 | 350.6 | 592 | 576 | 150.4 |
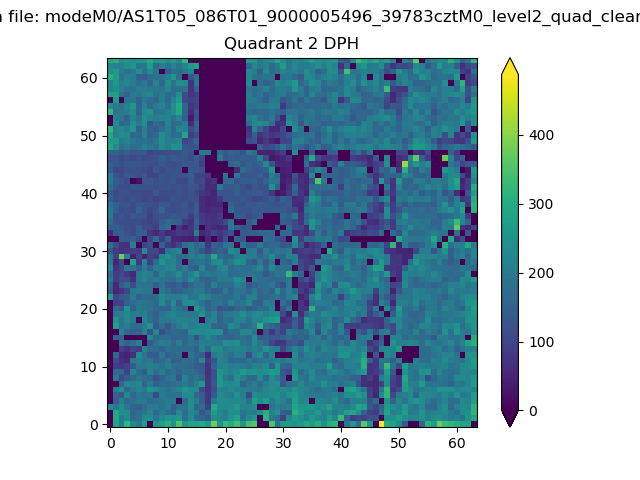
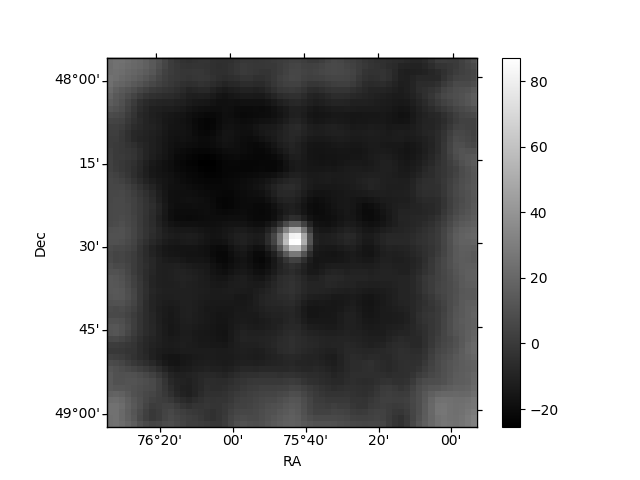
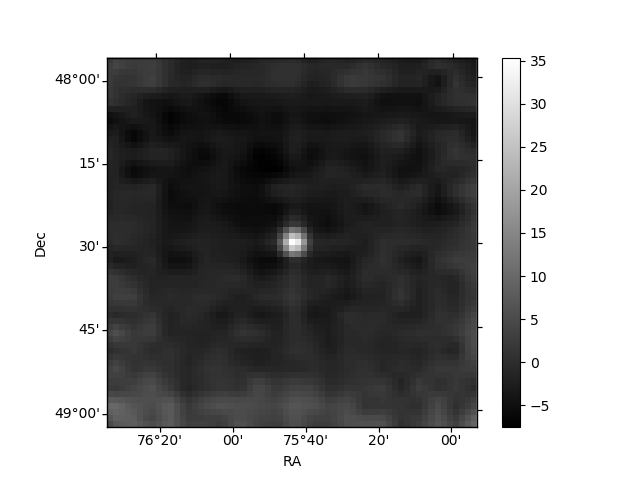
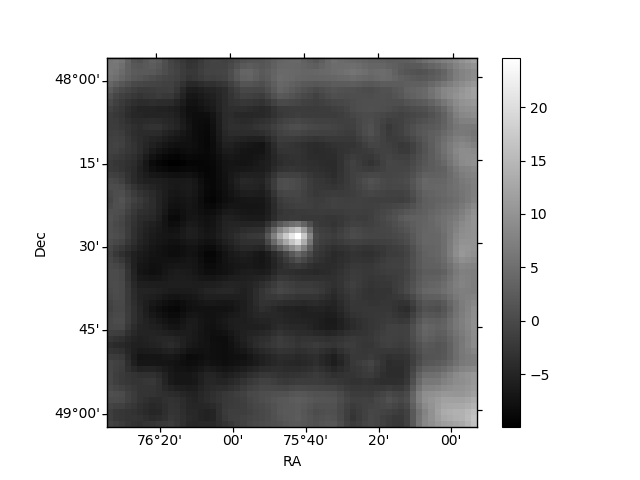
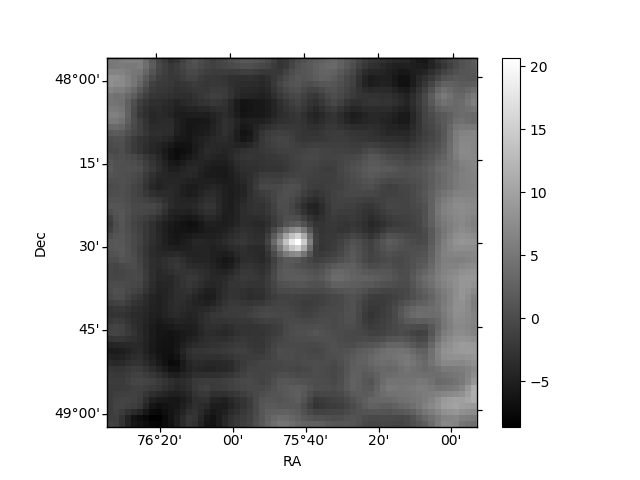
Histogram calculated using DETX and DETY for each event in the final _common_clean file
| Quadrant A | 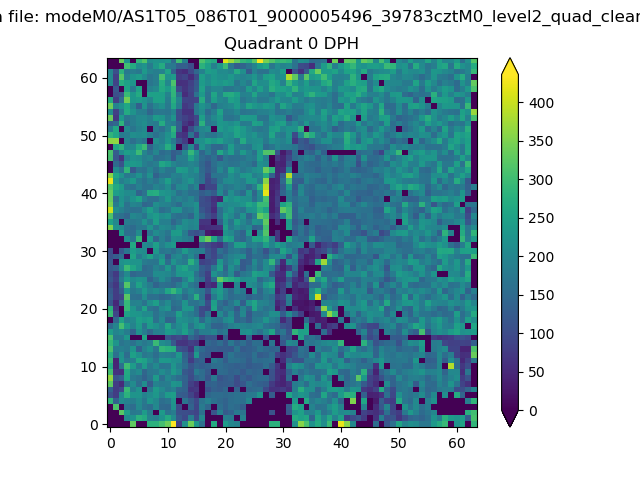 |
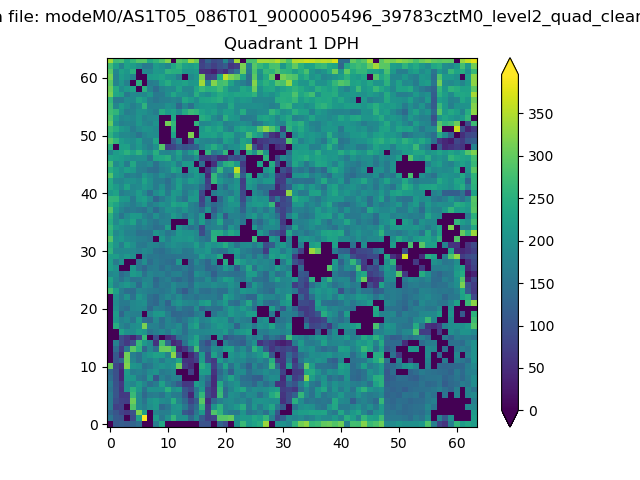 |
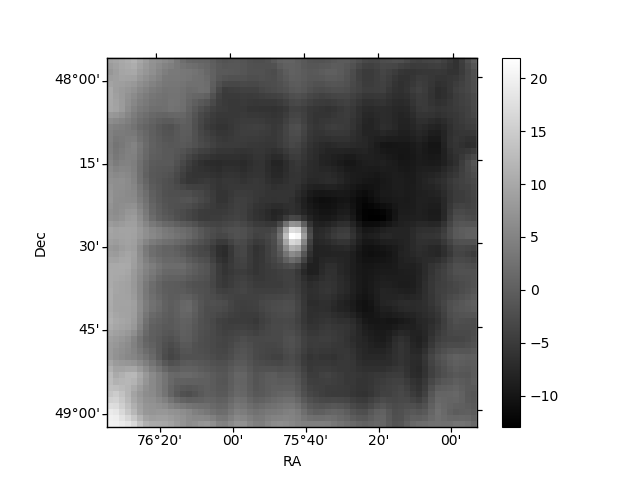
Quadrant B |
|---|---|---|---|
| Quadrant D | 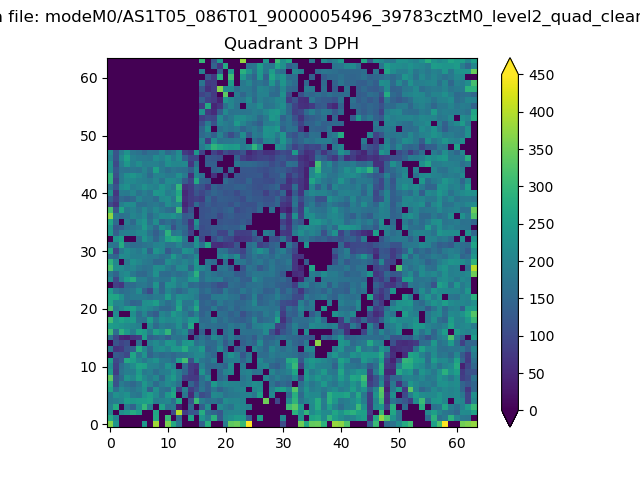 |
 |
Quadrant C |
| Plot type | Count rate plots | Images |
|---|---|---|
| Comparison with Poisson distribution Blue bars denote a histogram of data divided into 1 sec bins. Red curve is a Poisson curve with rate = median count rate of data. |
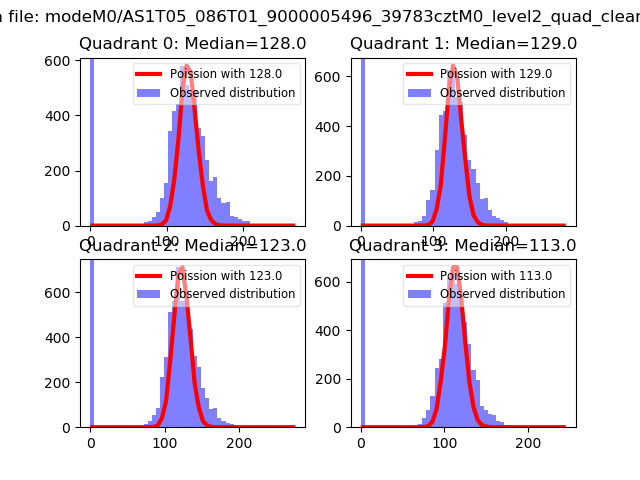 |
 |
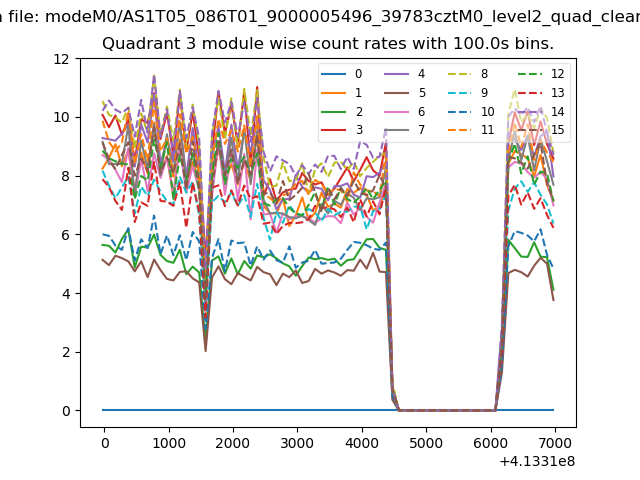
| Quadrant-wise count rates Data is divided into 100 sec bins |
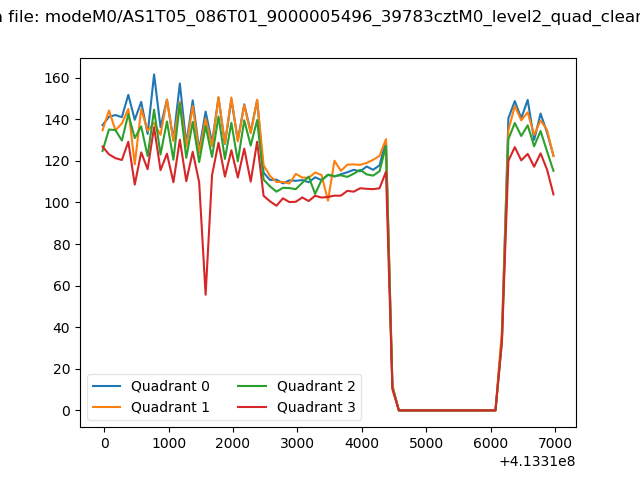 |
|
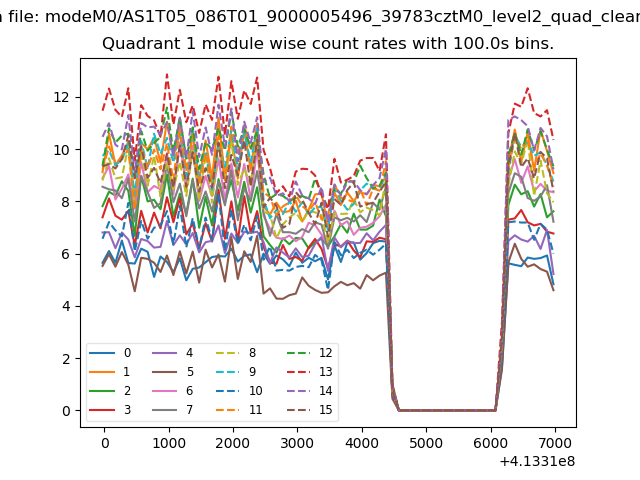
| Module-wise count rates for Quadrant A Data is divided into 100 sec bins |
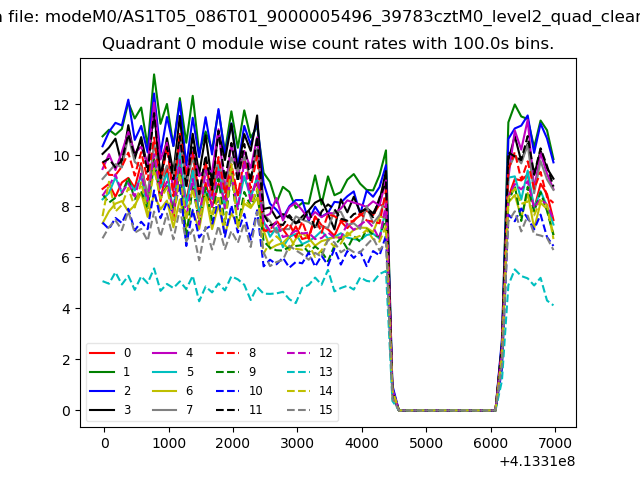 |
 |
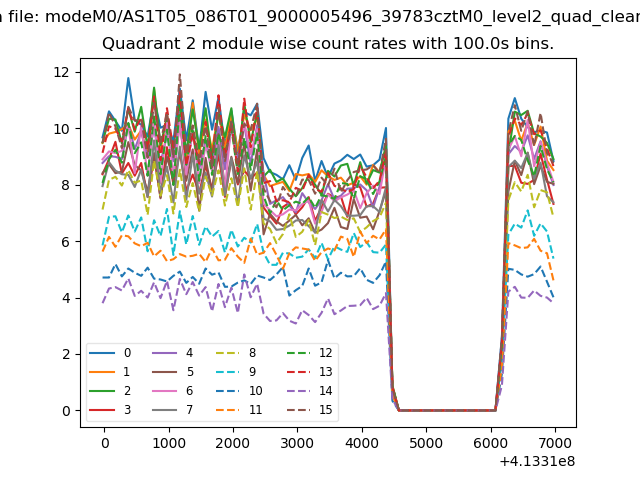
| Module-wise count rates for Quadrant B Data is divided into 100 sec bins |
 |
 |
| Module-wise count rates for Quadrant C Data is divided into 100 sec bins |
 |
 |
| Module-wise count rates for Quadrant D Data is divided into 100 sec bins |
 |
 |
| Parameter | Plot |
|---|---|
| CZT HV Monitor | 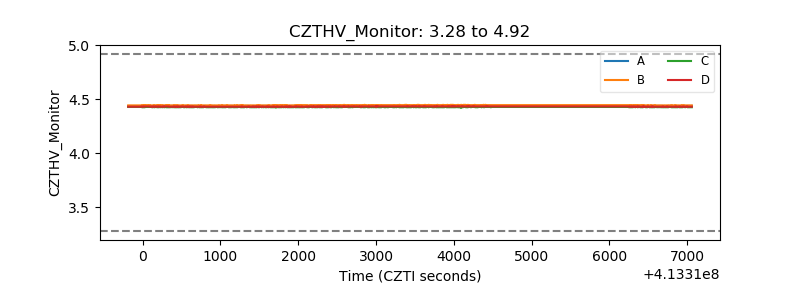 |
| D_VDD | 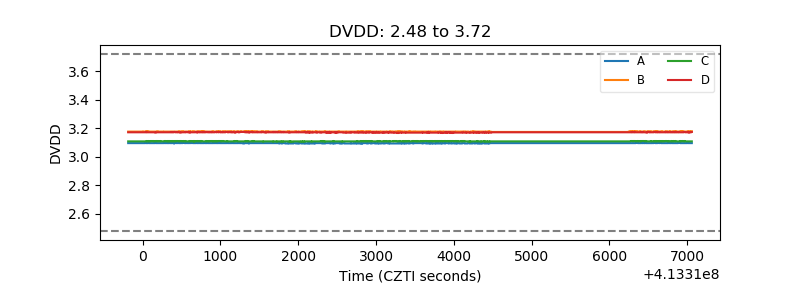 |
| Temperature 1 | 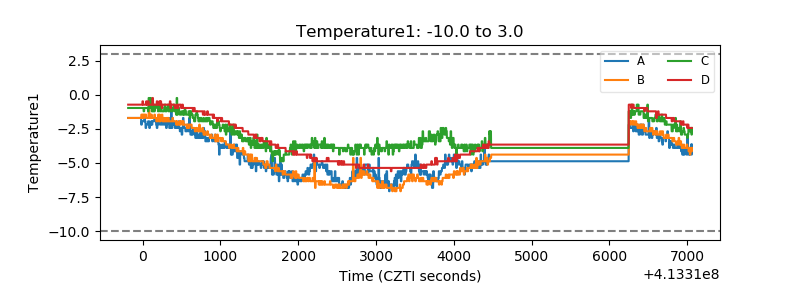 |
| Veto HV Monitor | 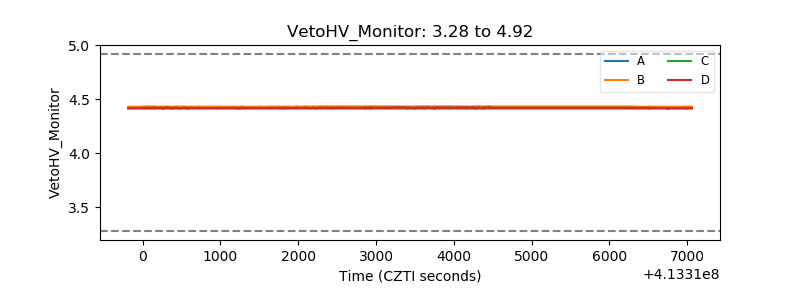 |
| Veto LLD | 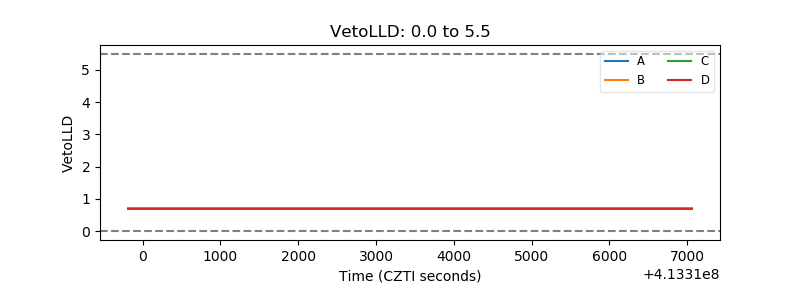 |
| Alpha Counter | 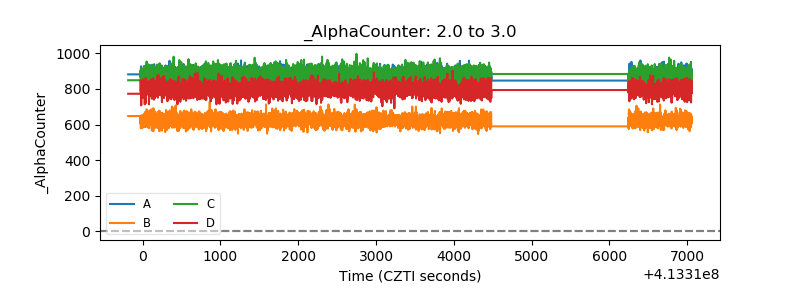 |
| _CPM_Rate | 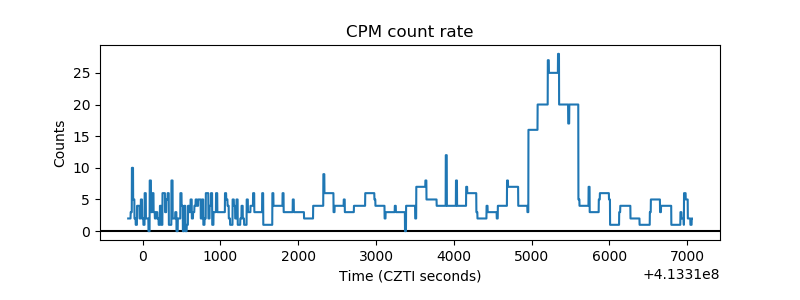 |
| CZT Counter | 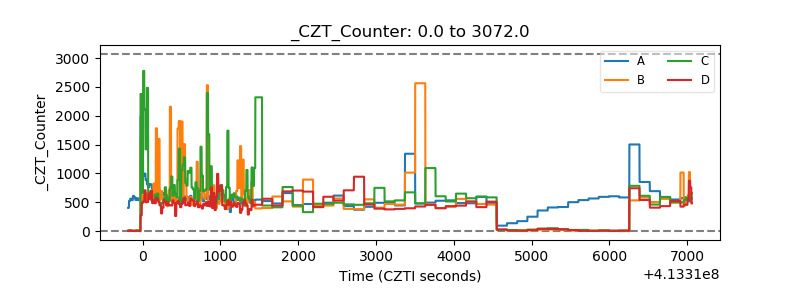 |
| +2.5 Volts monitor | 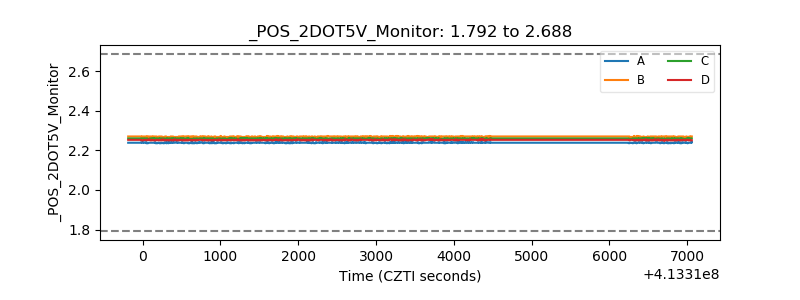 |
| +5 Volts monitor |  |
| _ROLL_ROT | 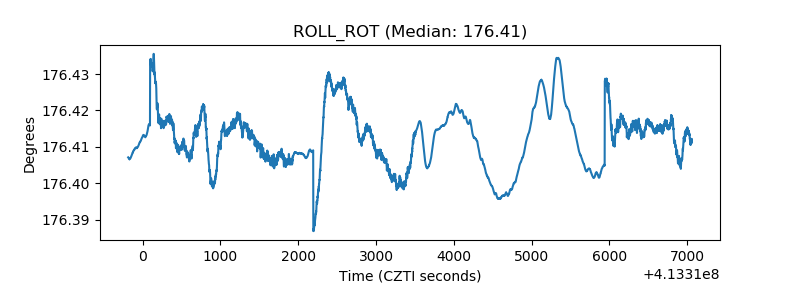 |
| _Roll_DEC | 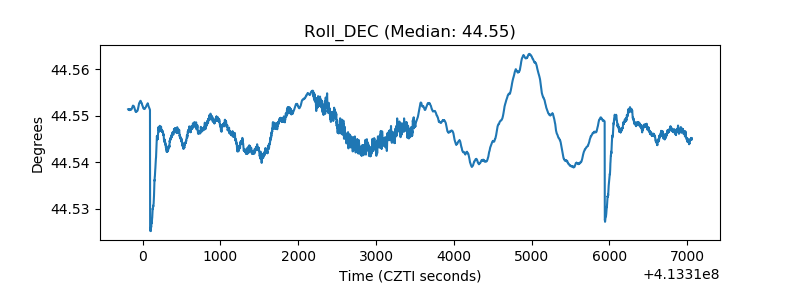 |
| _Roll_RA | 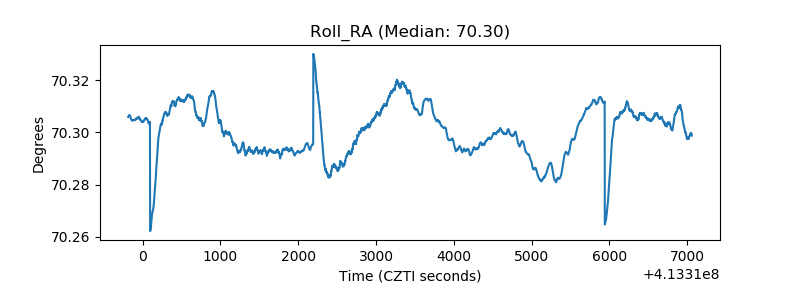 |
| Veto Counter | 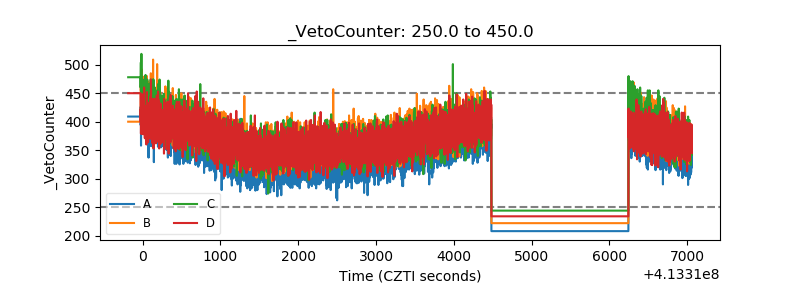 |