| Param | Original file | Final file |
|---|---|---|
| Filename | modeM0/AS1T05_086T01_9000005496_39784cztM0_level2.fits | modeM0/AS1T05_086T01_9000005496_39784cztM0_level2_quad_clean.evt |
| Size (bytes) | 407,304,000 | 103,867,200 |
| Size | 388.4 MB | 99.1 MB |
| Events in quadrant A | 3,231,520 | 726,590 |
| Events in quadrant B | 3,171,130 | 723,980 |
| Events in quadrant C | 4,894,072 | 673,342 |
| Events in quadrant D | 3,339,233 | 624,209 |
| Mode SS | |||
|---|---|---|---|
| Quadrant | BADHDUFLAG | Total packets | Discarded packets |
| A | 0 | 116 | 0 |
| B | 0 | 116 | 0 |
| C | 0 | 116 | 0 |
| D | 0 | 116 | 0 |
| Mode M9 | |||
|---|---|---|---|
| Quadrant | BADHDUFLAG | Total packets | Discarded packets |
| A | 0 | 16 | 0 |
| B | 0 | 16 | 0 |
| C | 0 | 16 | 0 |
| D | 0 | 17 | 0 |
| Mode M0 | |||
|---|---|---|---|
| Quadrant | BADHDUFLAG | Total packets | Discarded packets |
| A | 0 | 13211 | 3 |
| B | 0 | 13246 | 2 |
| C | 0 | 18353 | 2 |
| D | 0 | 13725 | 2 |
| Quadrant | Total seconds | Saturated seconds | Saturation percentage |
|---|---|---|---|
| A | 5675 | 28 | 0.493392% |
| B | 5675 | 119 | 2.096916% |
| C | 5675 | 314 | 5.533040% |
| D | 5675 | 161 | 2.837004% |
Noise dominated data is calculated using 1-second bins in cleaned event files. If a bin has >2000 counts, and if more than 50% of those come from <1% of pixels, then it is considered to be noise-dominated and hence unusable.
| Quadrant | # 1 sec bins | Bins with >0 counts | Bins with >2000 counts | High rate bins dominated by noise | Noise dominated (total time) | Noise dominated (detector-on time) | Marked lightcurve |
|---|---|---|---|---|---|---|---|
| A | 7107 | 5675 | 6 | 6 | 0.08% | 0.11% | 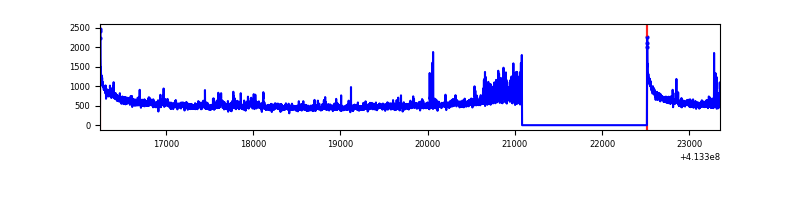 |
| B | 7107 | 5675 | 54 | 54 | 0.76% | 0.95% | 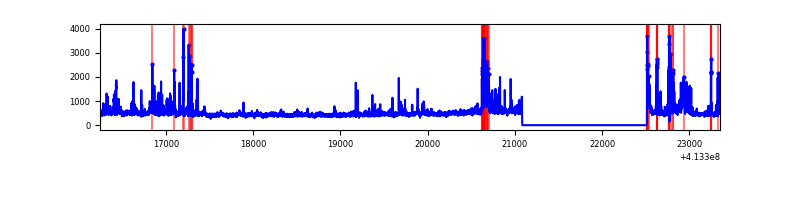 |
| C | 7107 | 5675 | 281 | 281 | 3.95% | 4.95% | 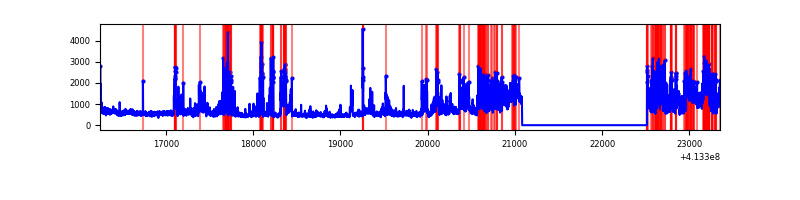 |
| D | 7107 | 5675 | 156 | 156 | 2.20% | 2.75% | 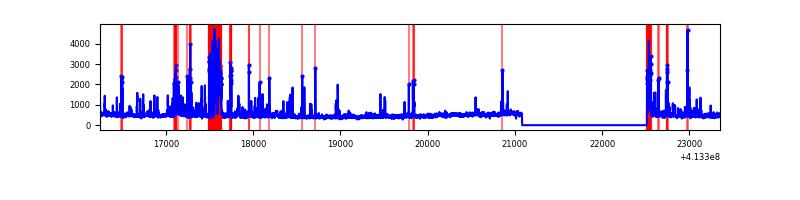 |
Top three noisy pixels from each quadrant. If the there are fewer than three noisy pixels in the level2.evt file, extra rows are filled as -1
| Pixel properties | Quadrant properties | ||||||
|---|---|---|---|---|---|---|---|
| Quadrant | DetID | PixID | Counts | Sigma | Mean | Median | Sigma |
| A | 10 | 83 | 496219 | 3636.13 | 651 | 640 | 136.3 |
| A | 2 | 79 | 164635 | 1203.25 | 651 | 640 | 136.3 |
| A | 9 | 143 | 19974 | 141.86 | 651 | 640 | 136.3 |
| B | 5 | 172 | 205975 | 1596.75 | 645 | 631 | 128.6 |
| B | 5 | 255 | 166534 | 1290.06 | 645 | 631 | 128.6 |
| B | 5 | 32 | 120932 | 935.46 | 645 | 631 | 128.6 |
| C | 9 | 187 | 1394140 | 9269.77 | 625 | 632 | 150.3 |
| C | 15 | 208 | 551667 | 3665.55 | 625 | 632 | 150.3 |
| C | 14 | 254 | 249844 | 1657.79 | 625 | 632 | 150.3 |
| D | 13 | 249 | 345812 | 2191.55 | 626 | 612 | 157.5 |
| D | 12 | 233 | 206522 | 1307.25 | 626 | 612 | 157.5 |
| D | 12 | 227 | 103426 | 652.73 | 626 | 612 | 157.5 |
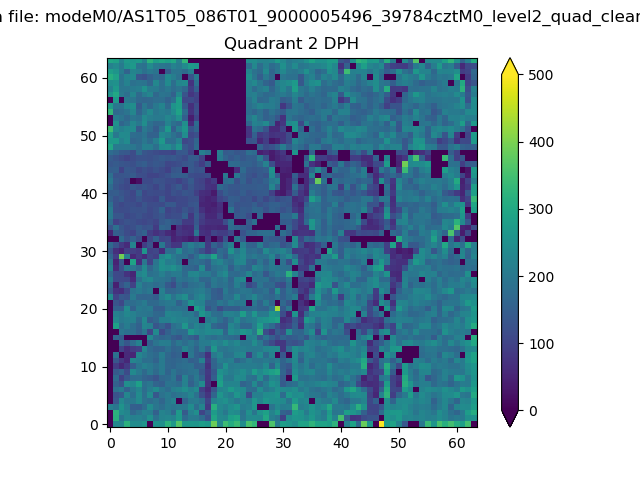
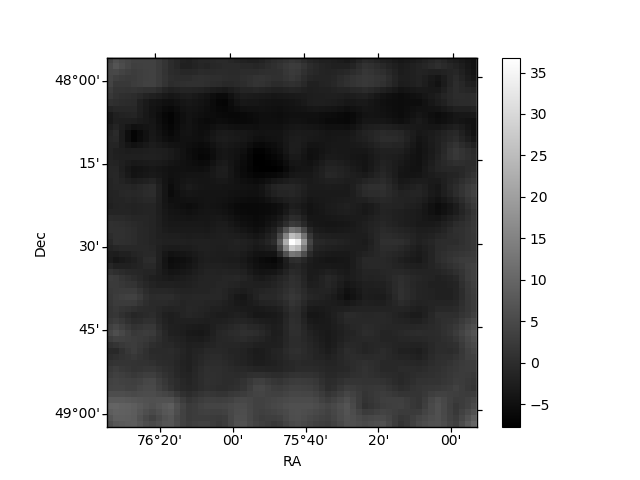
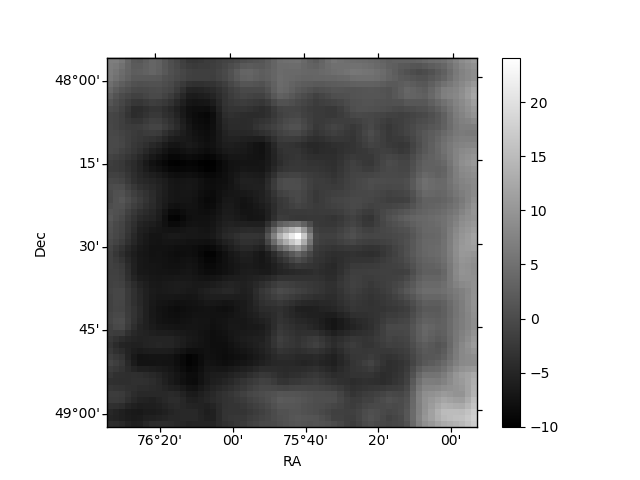
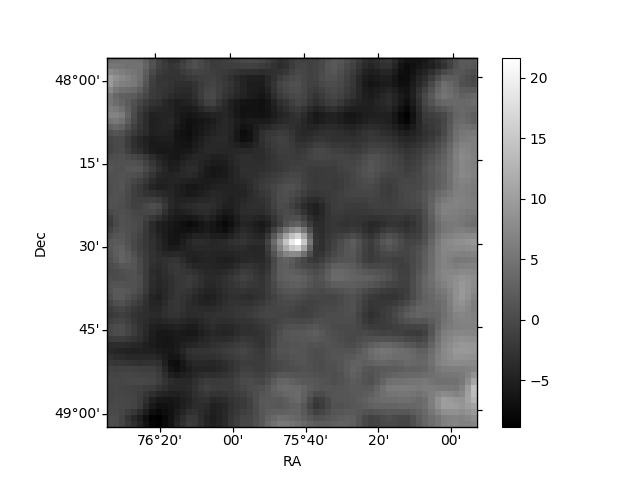
Histogram calculated using DETX and DETY for each event in the final _common_clean file
| Quadrant A | 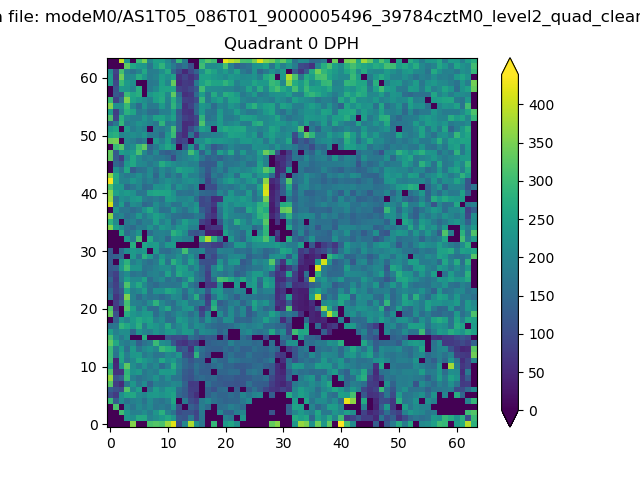 |
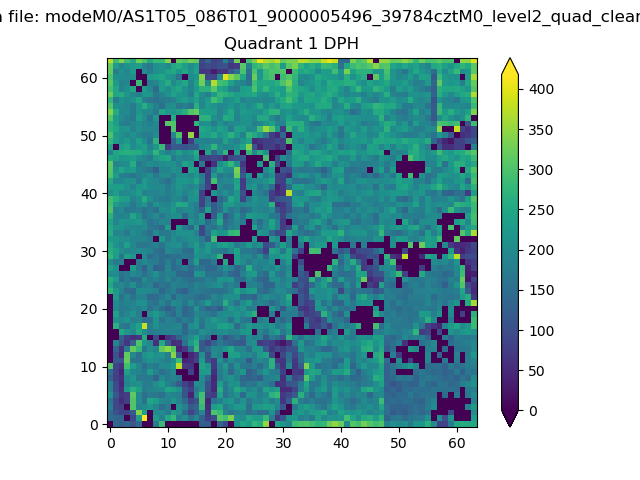 |
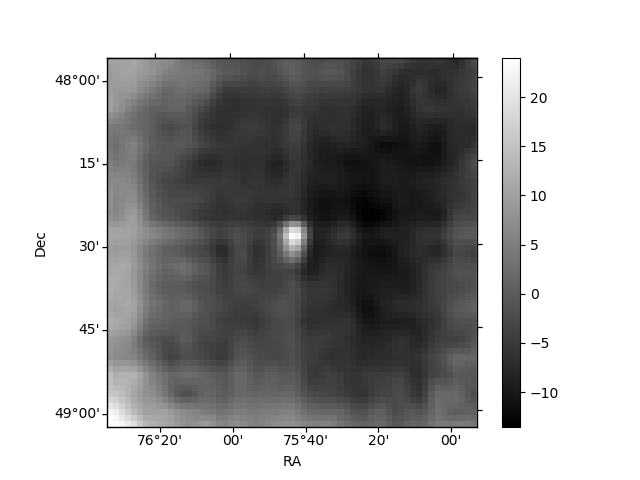
Quadrant B |
|---|---|---|---|
| Quadrant D | 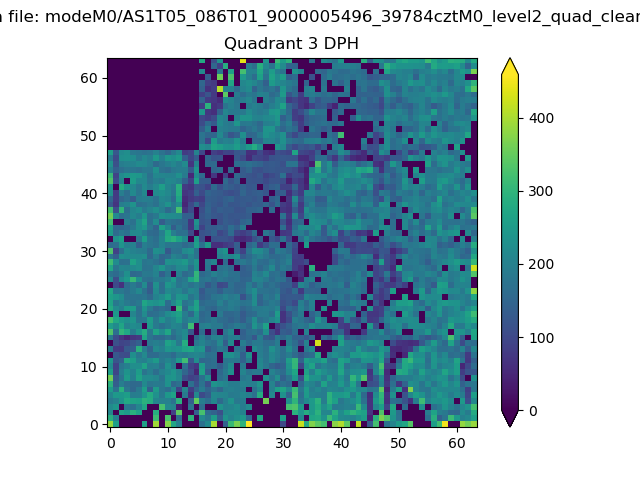 |
 |
Quadrant C |
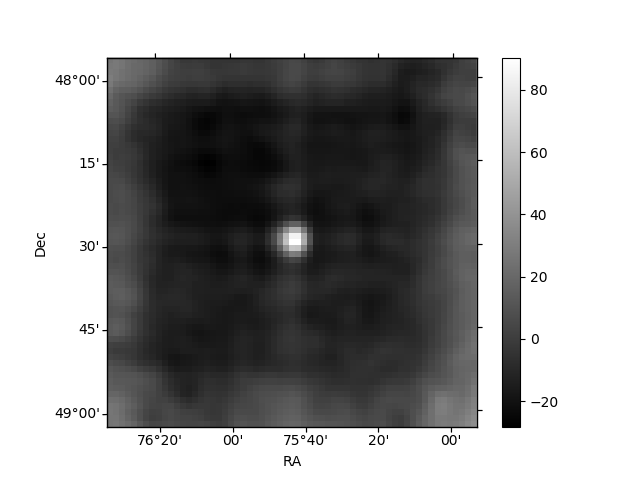
| Plot type | Count rate plots | Images |
|---|---|---|
| Comparison with Poisson distribution Blue bars denote a histogram of data divided into 1 sec bins. Red curve is a Poisson curve with rate = median count rate of data. |
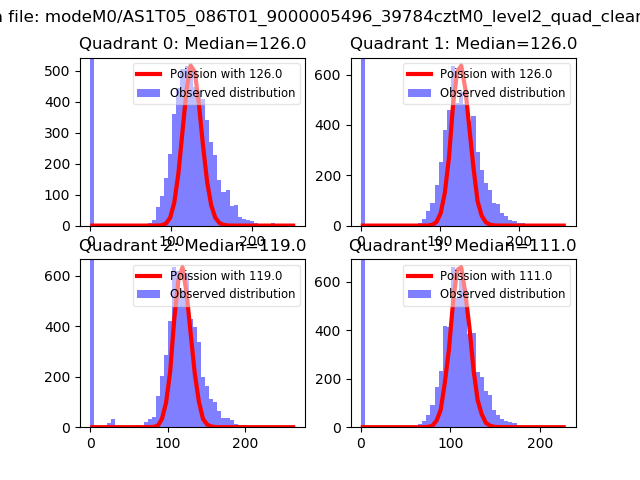 |
 |
| Quadrant-wise count rates Data is divided into 100 sec bins |
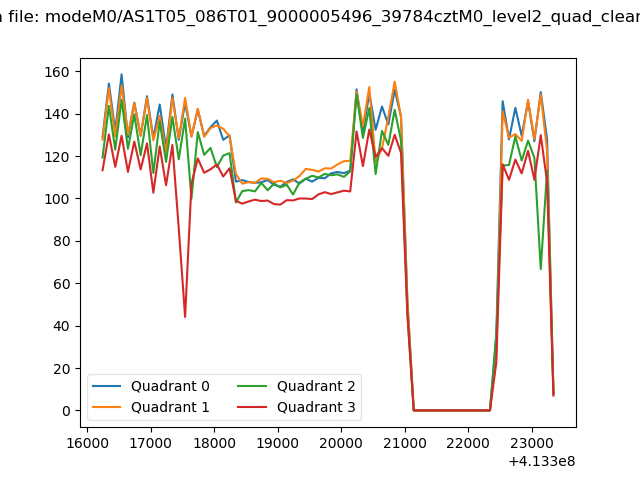 |
|
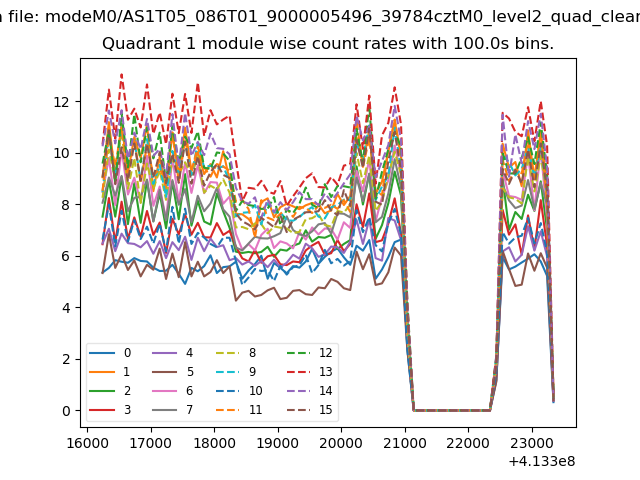
| Module-wise count rates for Quadrant A Data is divided into 100 sec bins |
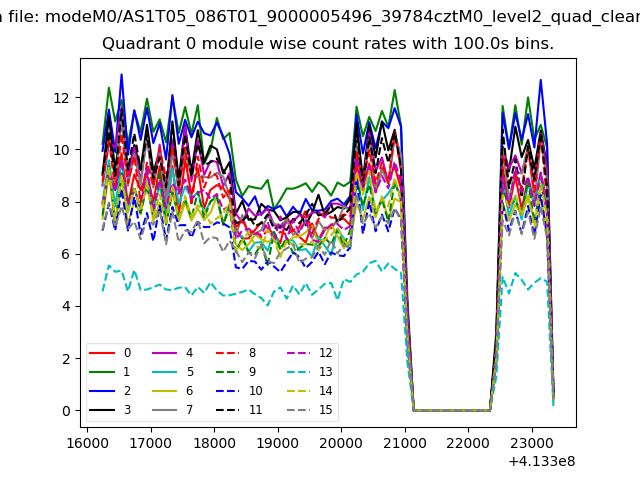 |
 |
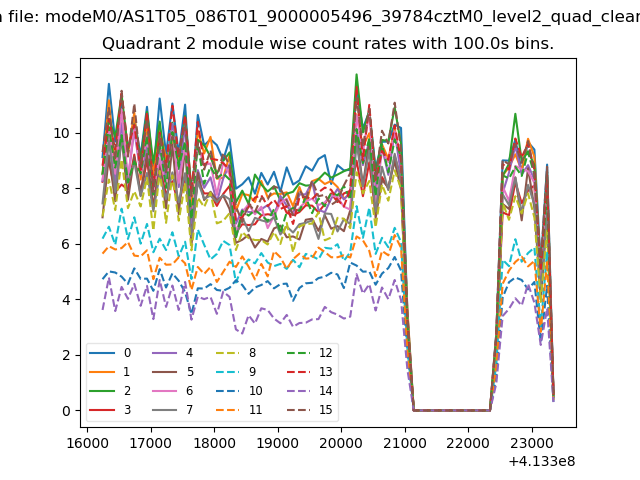
| Module-wise count rates for Quadrant B Data is divided into 100 sec bins |
 |
 |
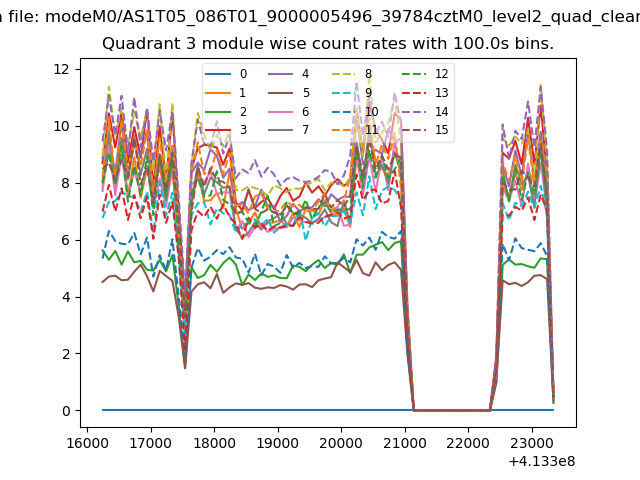
| Module-wise count rates for Quadrant C Data is divided into 100 sec bins |
 |
 |
| Module-wise count rates for Quadrant D Data is divided into 100 sec bins |
 |
 |
| Parameter | Plot |
|---|---|
| CZT HV Monitor | 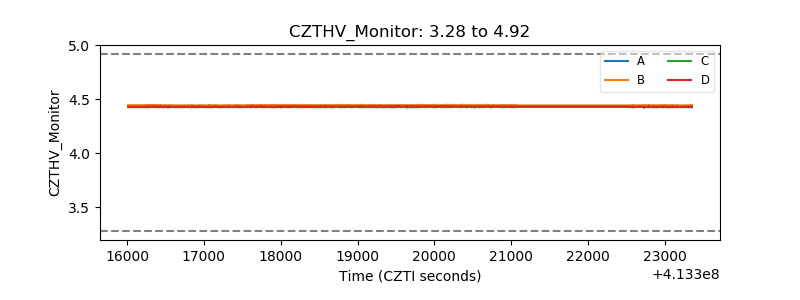 |
| D_VDD | 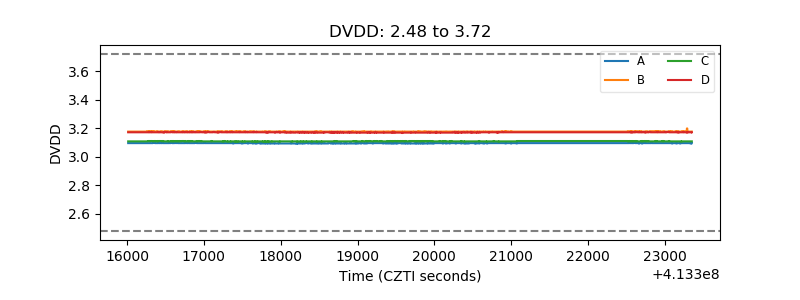 |
| Temperature 1 | 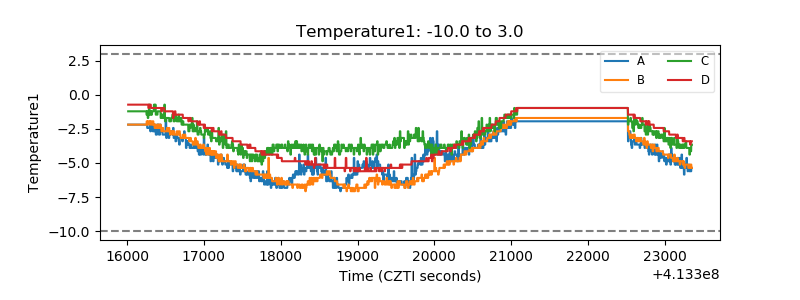 |
| Veto HV Monitor | 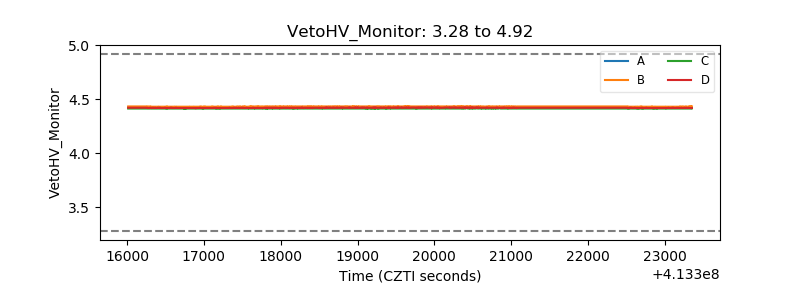 |
| Veto LLD | 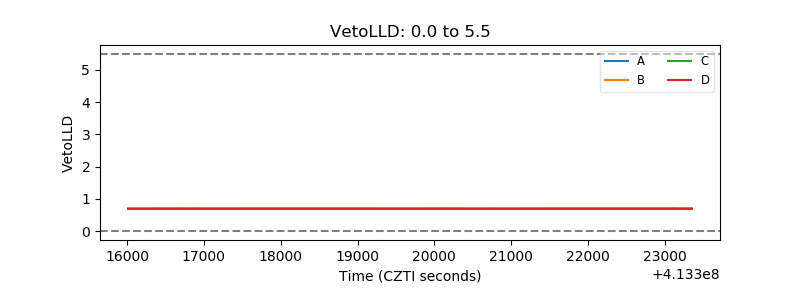 |
| Alpha Counter | 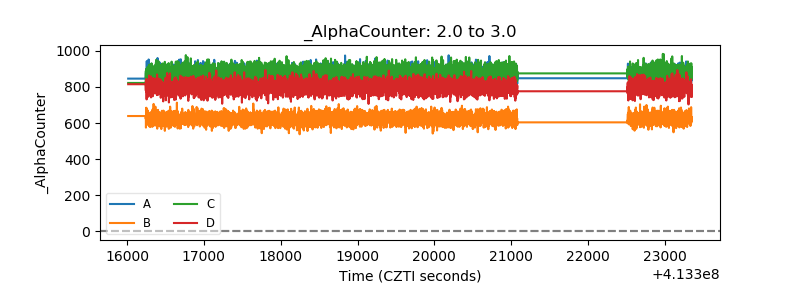 |
| _CPM_Rate | 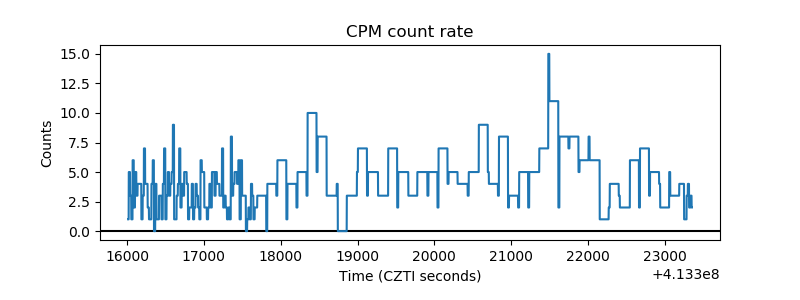 |
| CZT Counter | 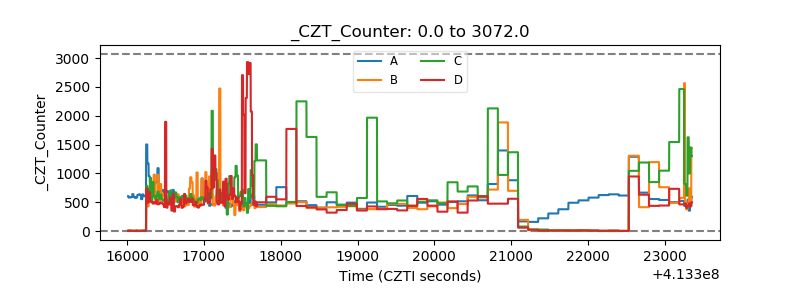 |
| +2.5 Volts monitor | 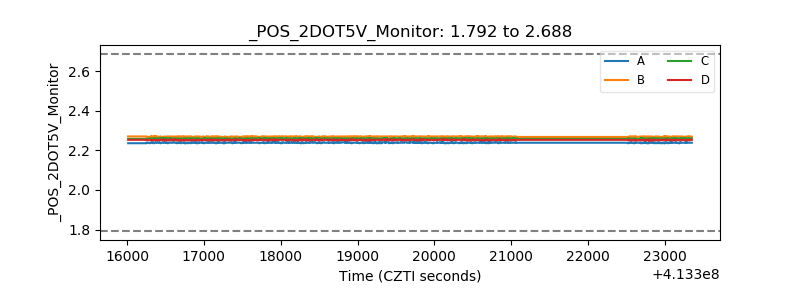 |
| +5 Volts monitor | 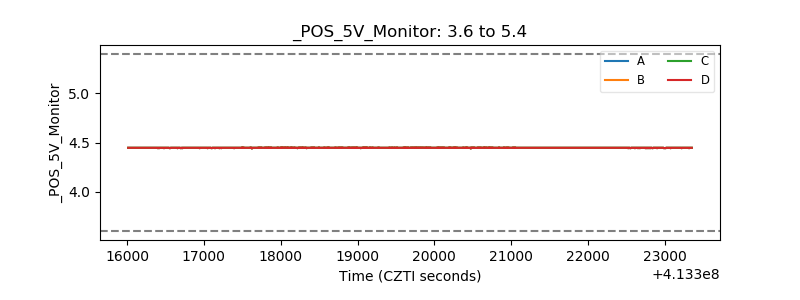 |
| _ROLL_ROT | 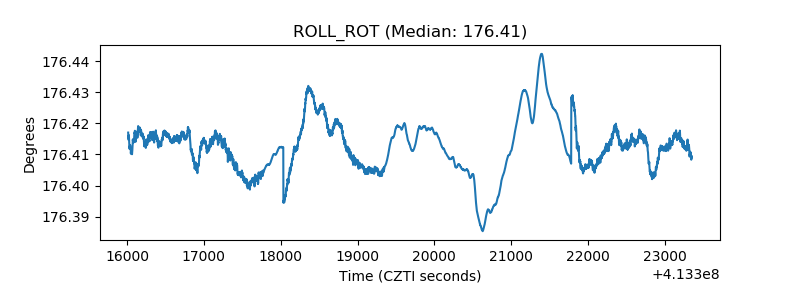 |
| _Roll_DEC |  |
| _Roll_RA | 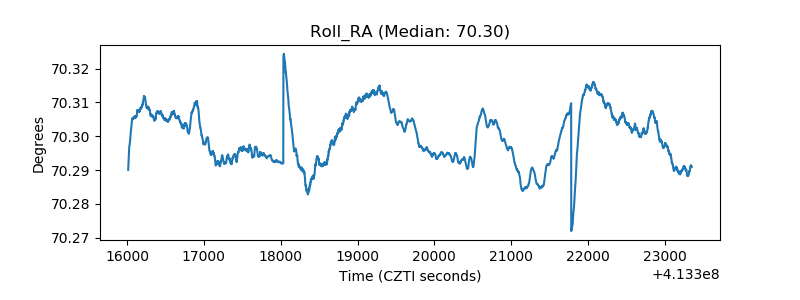 |
| Veto Counter | 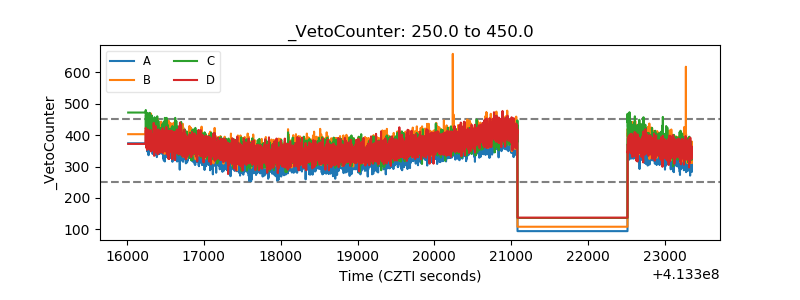 |