| Param | Original file | Final file |
|---|---|---|
| Filename | modeM0/AS1T05_086T01_9000005496_39785cztM0_level2.fits | modeM0/AS1T05_086T01_9000005496_39785cztM0_level2_quad_clean.evt |
| Size (bytes) | 461,992,320 | 106,862,400 |
| Size | 440.6 MB | 101.9 MB |
| Events in quadrant A | 3,397,912 | 758,152 |
| Events in quadrant B | 3,971,401 | 741,286 |
| Events in quadrant C | 6,062,912 | 658,253 |
| Events in quadrant D | 3,207,692 | 662,673 |
| Mode SS | |||
|---|---|---|---|
| Quadrant | BADHDUFLAG | Total packets | Discarded packets |
| A | 0 | 122 | 0 |
| B | 0 | 122 | 0 |
| C | 0 | 122 | 0 |
| D | 0 | 122 | 0 |
| Mode M9 | |||
|---|---|---|---|
| Quadrant | BADHDUFLAG | Total packets | Discarded packets |
| A | 0 | 17 | 0 |
| B | 0 | 17 | 0 |
| C | 0 | 17 | 0 |
| D | 0 | 18 | 0 |
| Mode M0 | |||
|---|---|---|---|
| Quadrant | BADHDUFLAG | Total packets | Discarded packets |
| A | 0 | 14033 | 3 |
| B | 0 | 15806 | 2 |
| C | 0 | 22050 | 2 |
| D | 0 | 13612 | 2 |
| Quadrant | Total seconds | Saturated seconds | Saturation percentage |
|---|---|---|---|
| A | 5943 | 48 | 0.807673% |
| B | 5943 | 278 | 4.677772% |
| C | 5943 | 688 | 11.576645% |
| D | 5943 | 93 | 1.564866% |
Noise dominated data is calculated using 1-second bins in cleaned event files. If a bin has >2000 counts, and if more than 50% of those come from <1% of pixels, then it is considered to be noise-dominated and hence unusable.
| Quadrant | # 1 sec bins | Bins with >0 counts | Bins with >2000 counts | High rate bins dominated by noise | Noise dominated (total time) | Noise dominated (detector-on time) | Marked lightcurve |
|---|---|---|---|---|---|---|---|
| A | 7224 | 5943 | 34 | 34 | 0.47% | 0.57% | 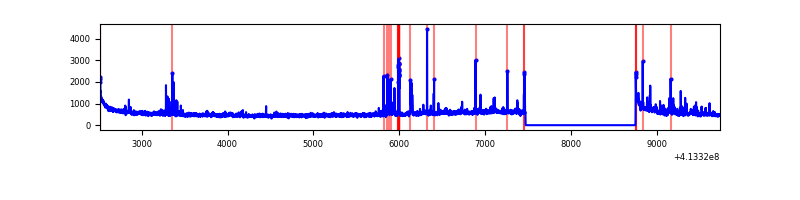 |
| B | 7224 | 5943 | 203 | 203 | 2.81% | 3.42% | 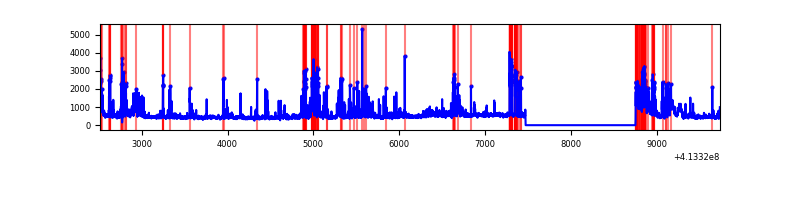 |
| C | 7224 | 5943 | 601 | 601 | 8.32% | 10.11% | 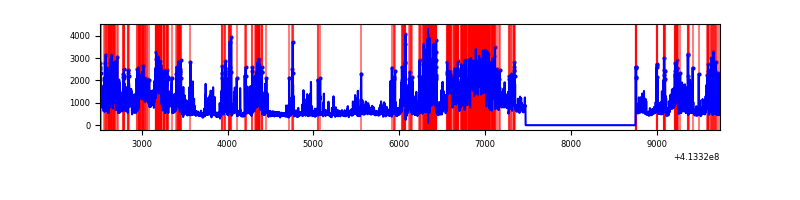 |
| D | 7224 | 5943 | 79 | 79 | 1.09% | 1.33% | 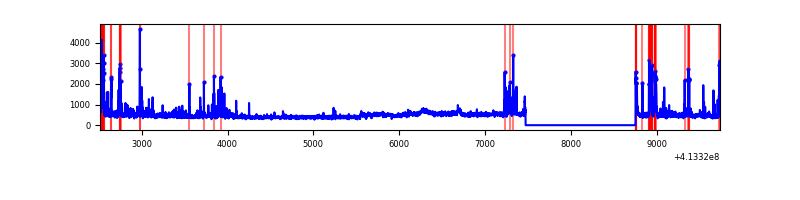 |
Top three noisy pixels from each quadrant. If the there are fewer than three noisy pixels in the level2.evt file, extra rows are filled as -1
| Pixel properties | Quadrant properties | ||||||
|---|---|---|---|---|---|---|---|
| Quadrant | DetID | PixID | Counts | Sigma | Mean | Median | Sigma |
| A | 10 | 83 | 505456 | 3524.83 | 680 | 667 | 143.2 |
| A | 9 | 143 | 130013 | 903.19 | 680 | 667 | 143.2 |
| A | 2 | 79 | 61358 | 423.79 | 680 | 667 | 143.2 |
| B | 5 | 255 | 572784 | 4294.45 | 667 | 650 | 133.2 |
| B | 5 | 172 | 289657 | 2169.29 | 667 | 650 | 133.2 |
| B | 5 | 32 | 273616 | 2048.89 | 667 | 650 | 133.2 |
| C | 9 | 187 | 2640297 | 17033.8 | 640 | 647 | 155.0 |
| C | 15 | 208 | 415475 | 2676.91 | 640 | 647 | 155.0 |
| C | 14 | 254 | 248121 | 1596.96 | 640 | 647 | 155.0 |
| D | 6 | 240 | 140789 | 838.24 | 664 | 648 | 167.2 |
| D | 12 | 233 | 110498 | 657.06 | 664 | 648 | 167.2 |
| D | 10 | 246 | 108423 | 644.65 | 664 | 648 | 167.2 |
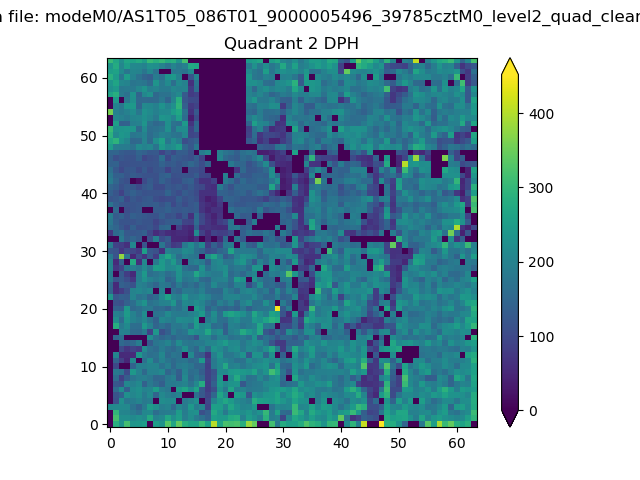
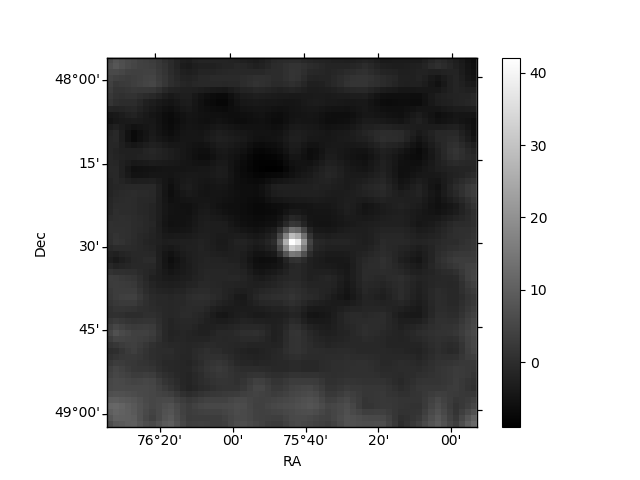
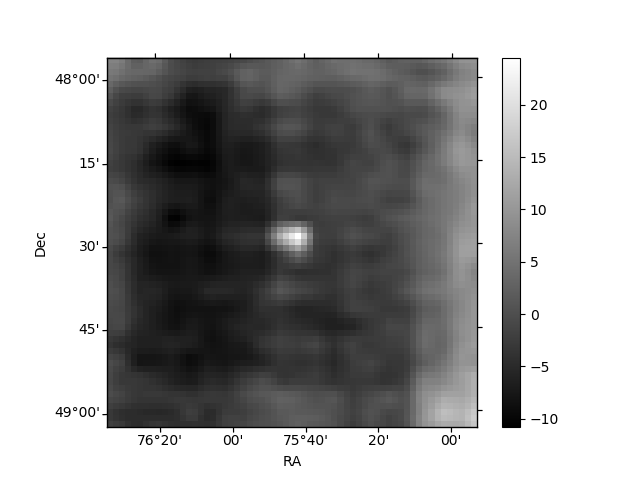
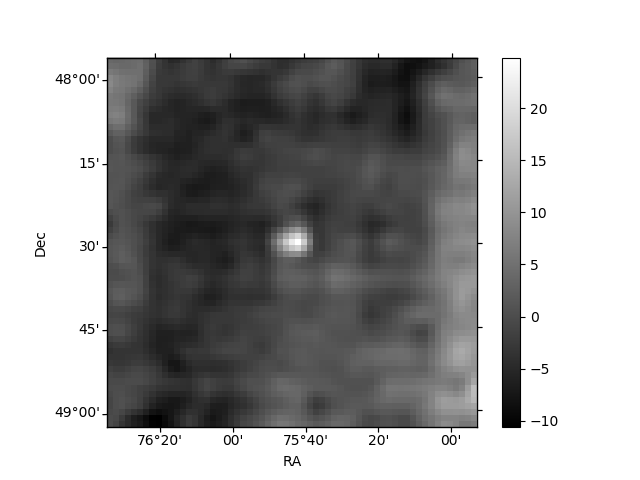
Histogram calculated using DETX and DETY for each event in the final _common_clean file
| Quadrant A | 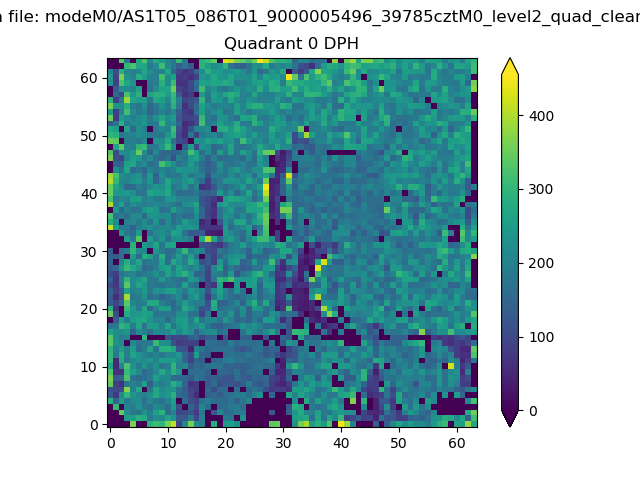 |
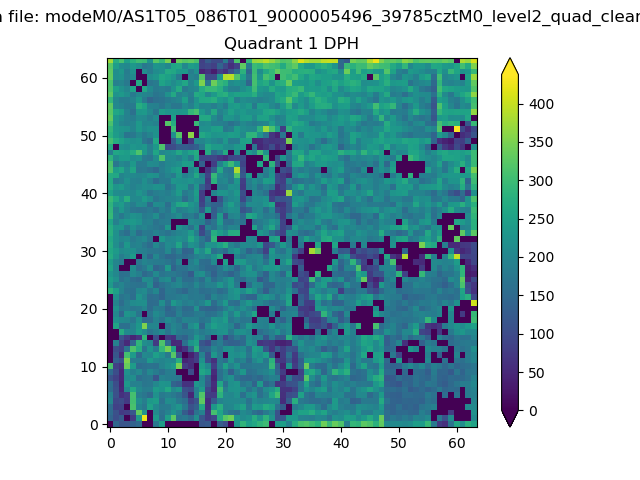 |
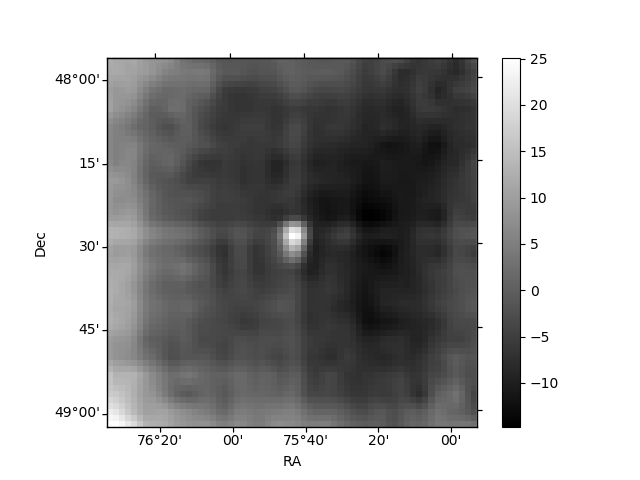
Quadrant B |
|---|---|---|---|
| Quadrant D | 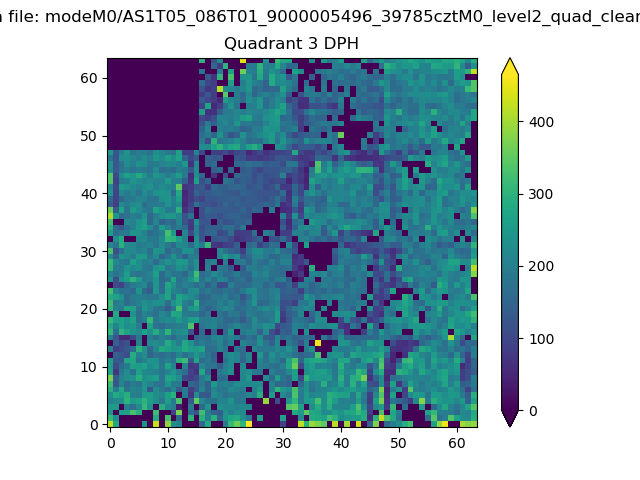 |
 |
Quadrant C |
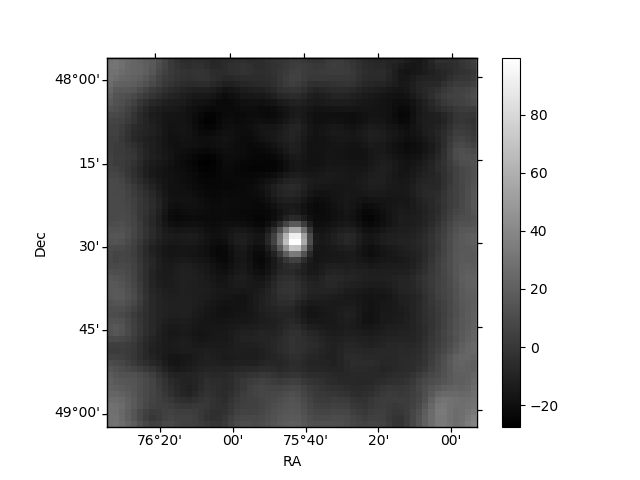
| Plot type | Count rate plots | Images |
|---|---|---|
| Comparison with Poisson distribution Blue bars denote a histogram of data divided into 1 sec bins. Red curve is a Poisson curve with rate = median count rate of data. |
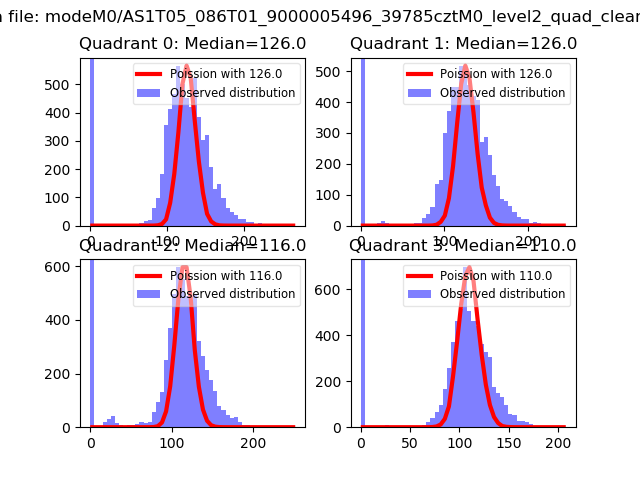 |
 |
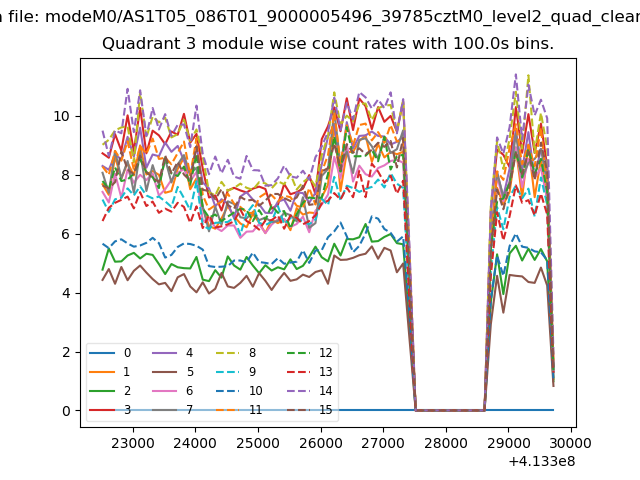
| Quadrant-wise count rates Data is divided into 100 sec bins |
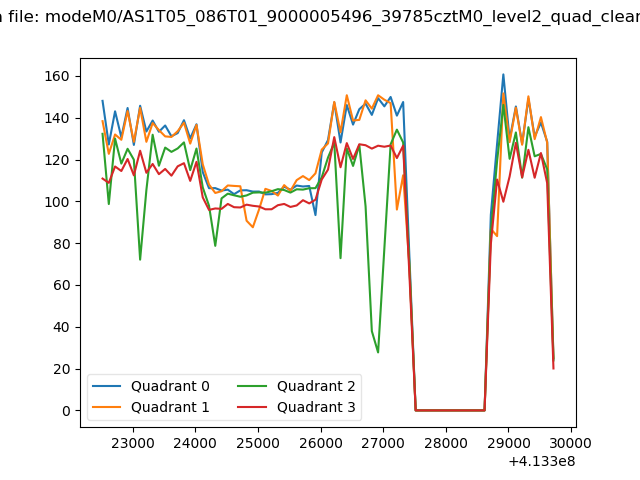 |
|
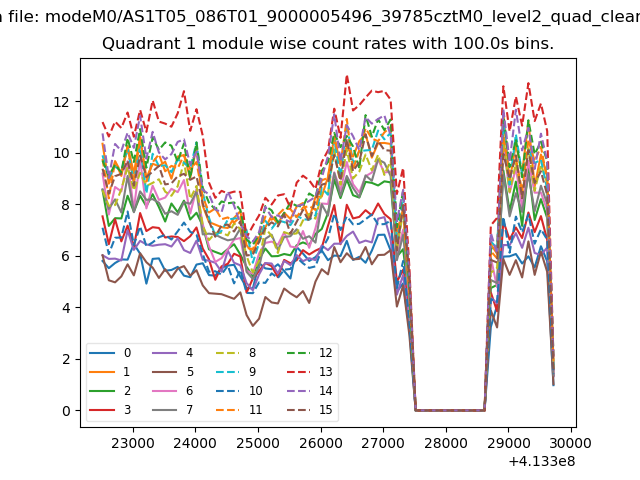
| Module-wise count rates for Quadrant A Data is divided into 100 sec bins |
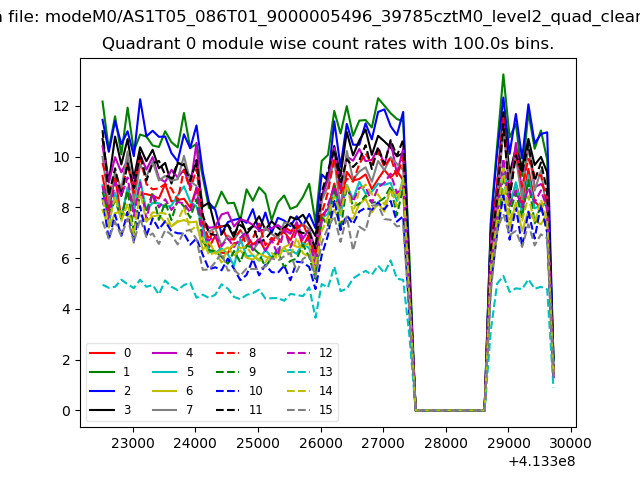 |
 |
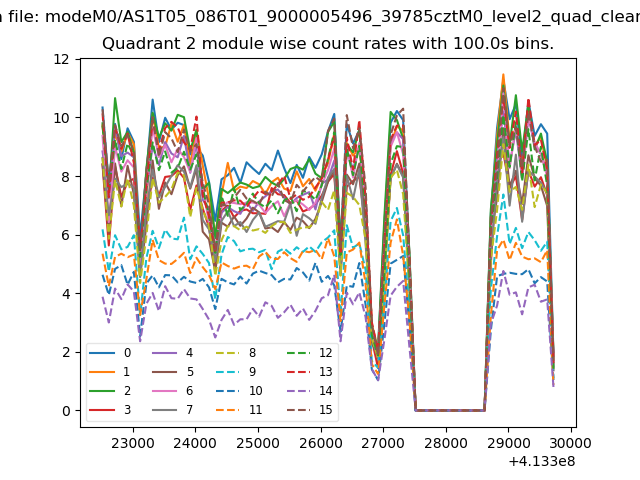
| Module-wise count rates for Quadrant B Data is divided into 100 sec bins |
 |
 |
| Module-wise count rates for Quadrant C Data is divided into 100 sec bins |
 |
 |
| Module-wise count rates for Quadrant D Data is divided into 100 sec bins |
 |
 |
| Parameter | Plot |
|---|---|
| CZT HV Monitor | 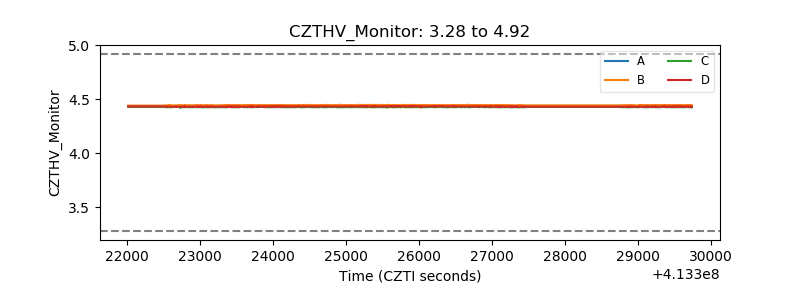 |
| D_VDD | 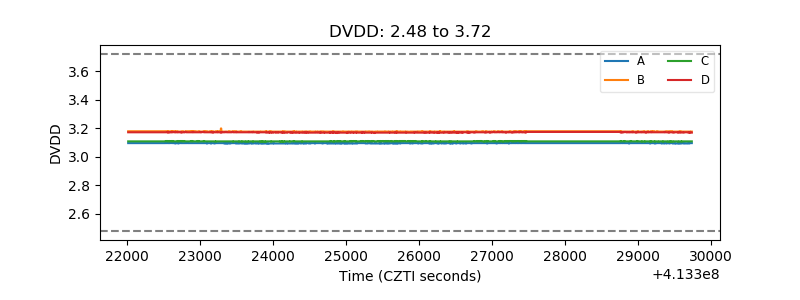 |
| Temperature 1 | 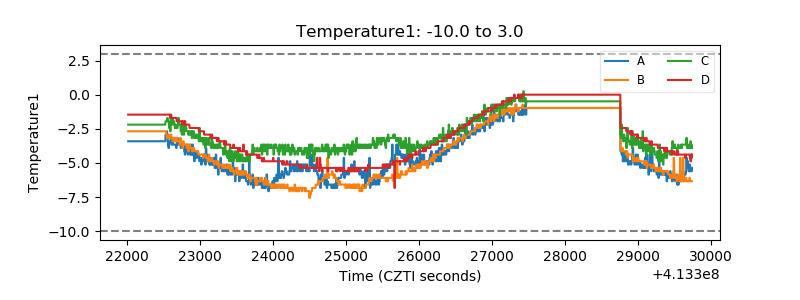 |
| Veto HV Monitor | 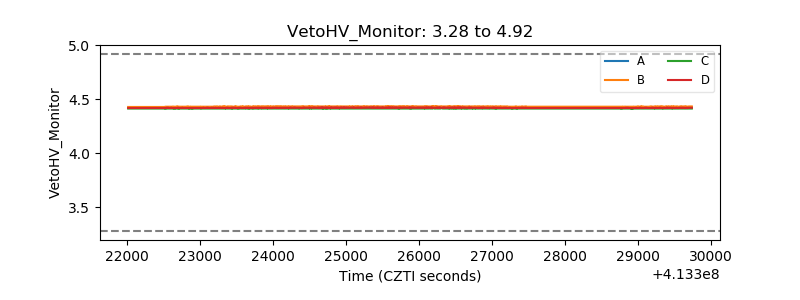 |
| Veto LLD | 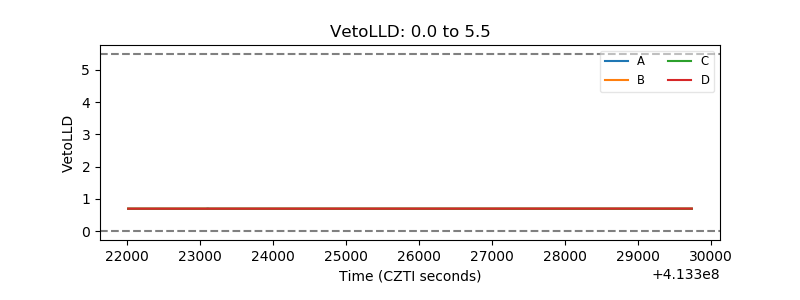 |
| Alpha Counter | 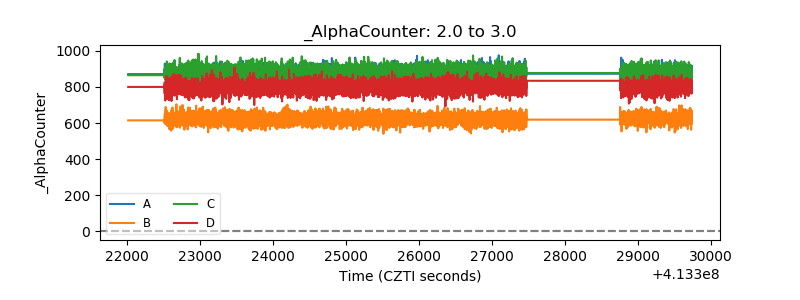 |
| _CPM_Rate | 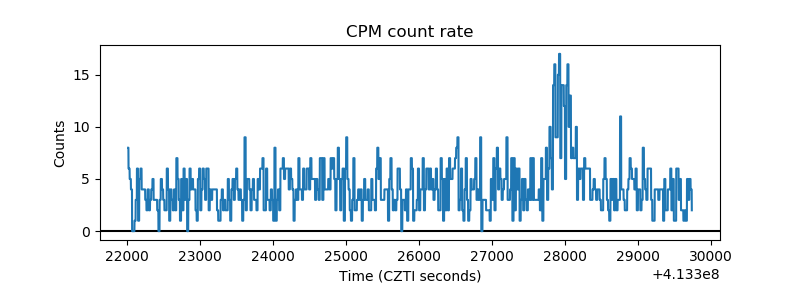 |
| CZT Counter | 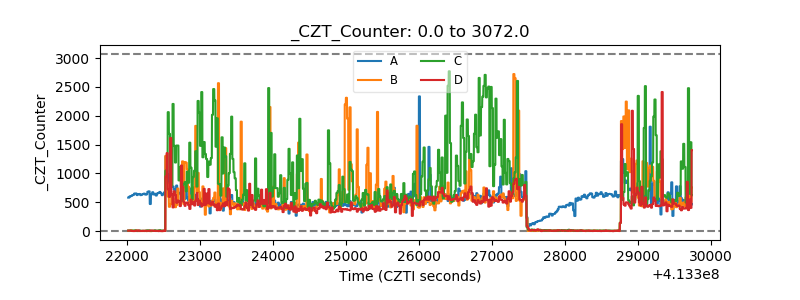 |
| +2.5 Volts monitor | 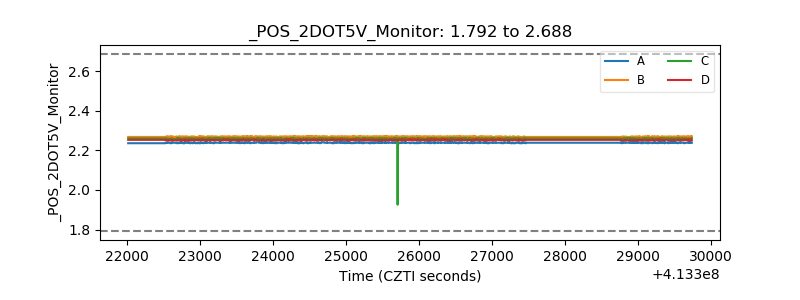 |
| +5 Volts monitor |  |
| _ROLL_ROT | 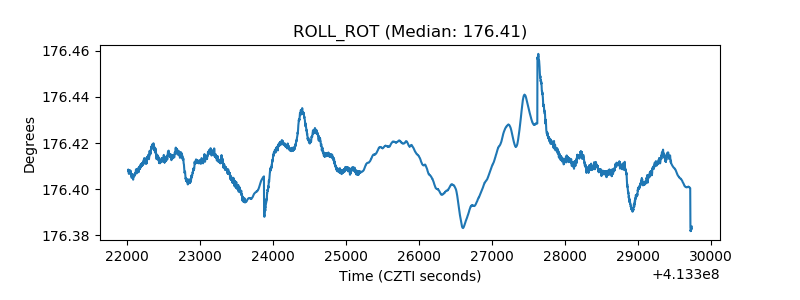 |
| _Roll_DEC | 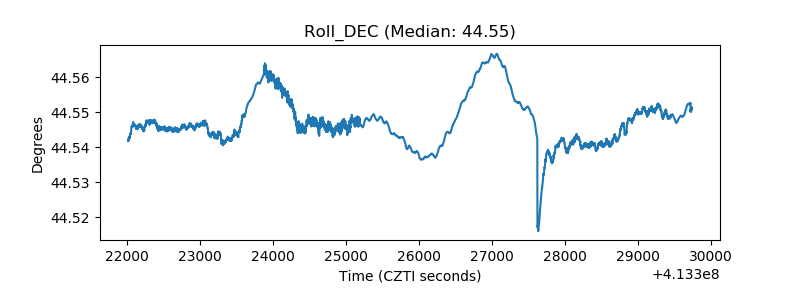 |
| _Roll_RA | 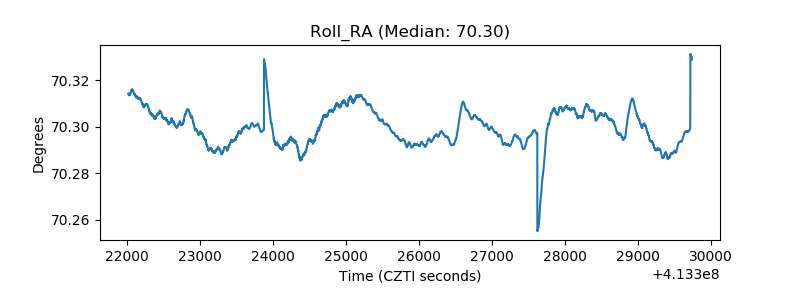 |
| Veto Counter | 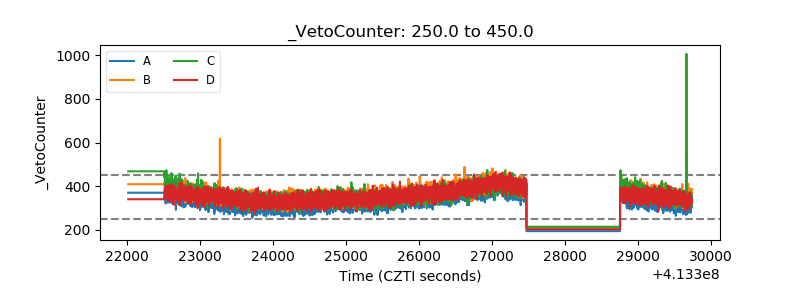 |