| Param | Original file | Final file |
|---|---|---|
| Filename | modeM0/AS1T05_086T01_9000005496_39789cztM0_level2.fits | modeM0/AS1T05_086T01_9000005496_39789cztM0_level2_quad_clean.evt |
| Size (bytes) | 1,529,167,680 | 330,891,840 |
| Size | 1.4 GB | 315.6 MB |
| Events in quadrant A | 12,462,962 | 2,290,620 |
| Events in quadrant B | 11,391,149 | 2,371,288 |
| Events in quadrant C | 19,688,765 | 1,962,008 |
| Events in quadrant D | 11,564,813 | 2,059,557 |
| Mode SS | |||
|---|---|---|---|
| Quadrant | BADHDUFLAG | Total packets | Discarded packets |
| A | 0 | 404 | 10 |
| B | 0 | 404 | 10 |
| C | 0 | 404 | 8 |
| D | 0 | 403 | 9 |
| Mode M9 | |||
|---|---|---|---|
| Quadrant | BADHDUFLAG | Total packets | Discarded packets |
| A | 0 | 58 | 2 |
| B | 0 | 58 | 4 |
| C | 0 | 58 | 2 |
| D | 0 | 58 | 4 |
| Mode M0 | |||
|---|---|---|---|
| Quadrant | BADHDUFLAG | Total packets | Discarded packets |
| A | 0 | 50934 | 1501 |
| B | 0 | 47778 | 890 |
| C | 0 | 74035 | 2556 |
| D | 0 | 48894 | 1092 |
| Quadrant | Total seconds | Saturated seconds | Saturation percentage |
|---|---|---|---|
| A | 19378 | 655 | 3.380122% |
| B | 19421 | 448 | 2.306781% |
| C | 19331 | 2603 | 13.465418% |
| D | 19391 | 458 | 2.361920% |
Noise dominated data is calculated using 1-second bins in cleaned event files. If a bin has >2000 counts, and if more than 50% of those come from <1% of pixels, then it is considered to be noise-dominated and hence unusable.
| Quadrant | # 1 sec bins | Bins with >0 counts | Bins with >2000 counts | High rate bins dominated by noise | Noise dominated (total time) | Noise dominated (detector-on time) | Marked lightcurve |
|---|---|---|---|---|---|---|---|
| A | 25632 | 19442 | 470 | 470 | 1.83% | 2.42% | 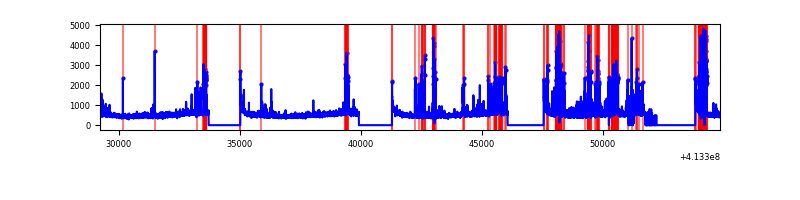 |
| B | 25632 | 19502 | 241 | 241 | 0.94% | 1.24% | 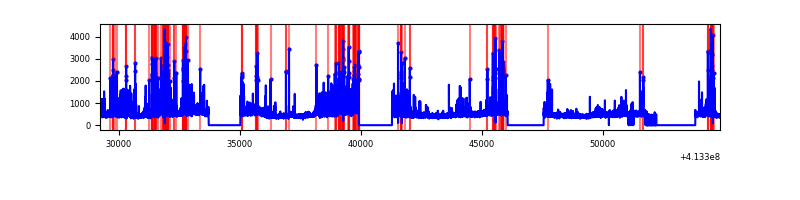 |
| C | 25632 | 19380 | 2290 | 2290 | 8.93% | 11.82% | 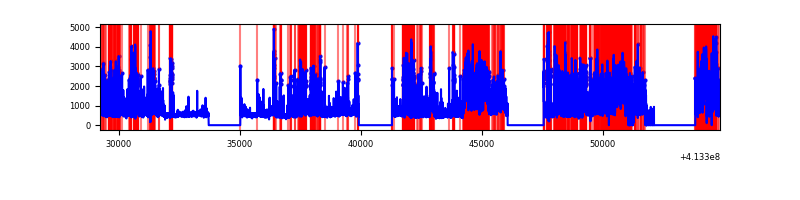 |
| D | 25632 | 19472 | 382 | 382 | 1.49% | 1.96% | 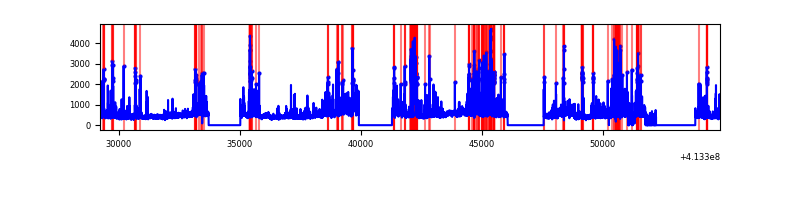 |
Top three noisy pixels from each quadrant. If the there are fewer than three noisy pixels in the level2.evt file, extra rows are filled as -1
| Pixel properties | Quadrant properties | ||||||
|---|---|---|---|---|---|---|---|
| Quadrant | DetID | PixID | Counts | Sigma | Mean | Median | Sigma |
| A | 9 | 143 | 1491058 | 3254.16 | 2206 | 2167 | 457.5 |
| A | 10 | 83 | 1355026 | 2956.84 | 2206 | 2167 | 457.5 |
| A | 2 | 79 | 543889 | 1184.0 | 2206 | 2167 | 457.5 |
| B | 5 | 172 | 780317 | 1813.99 | 2205 | 2152 | 429.0 |
| B | 5 | 255 | 769919 | 1789.75 | 2205 | 2152 | 429.0 |
| B | 4 | 170 | 268417 | 620.69 | 2205 | 2152 | 429.0 |
| C | 9 | 187 | 9807454 | 20102.92 | 2063 | 2090 | 487.8 |
| C | 15 | 208 | 943538 | 1930.15 | 2063 | 2090 | 487.8 |
| C | 15 | 214 | 755949 | 1545.56 | 2063 | 2090 | 487.8 |
| D | 6 | 240 | 979793 | 1822.21 | 2144 | 2089 | 536.5 |
| D | 12 | 227 | 966222 | 1796.91 | 2144 | 2089 | 536.5 |
| D | 13 | 249 | 704085 | 1308.35 | 2144 | 2089 | 536.5 |
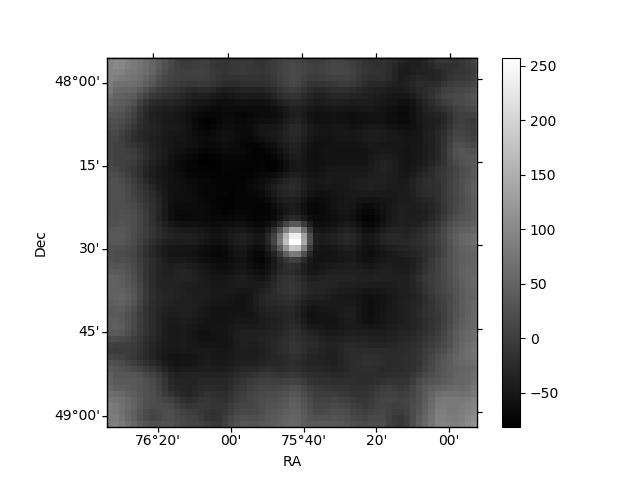
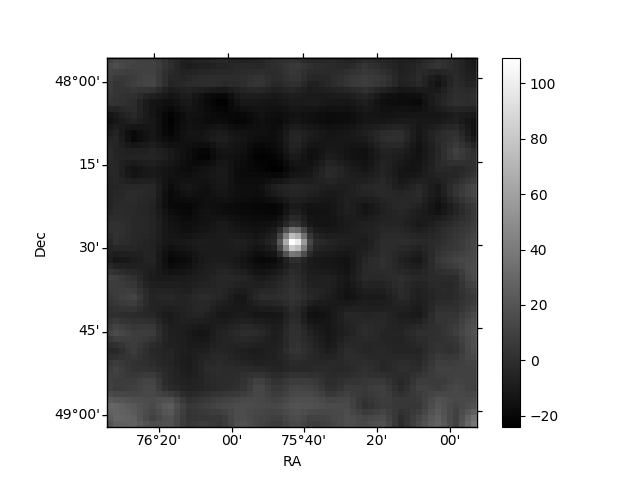
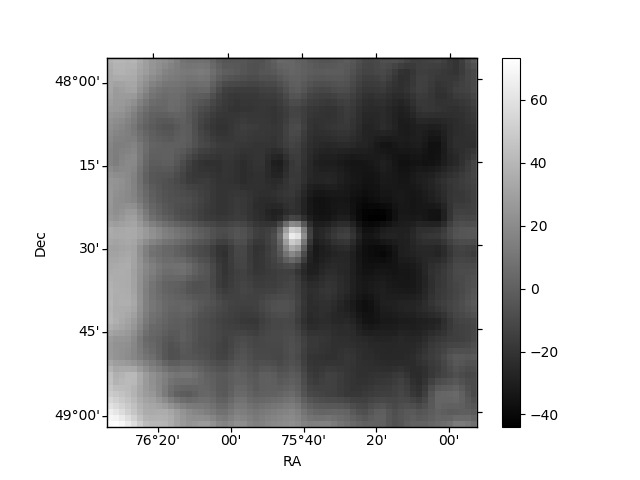
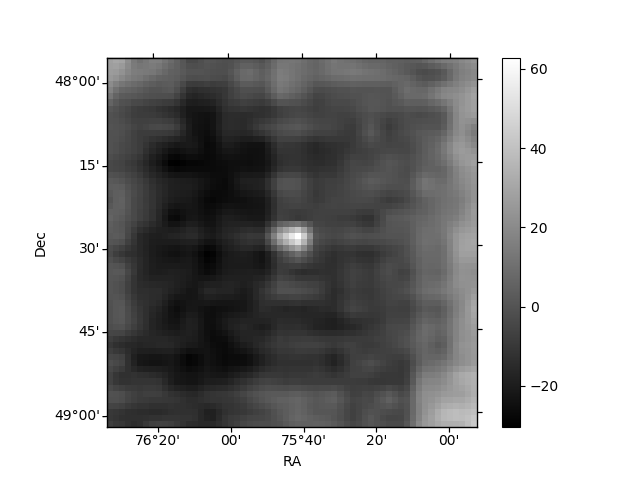
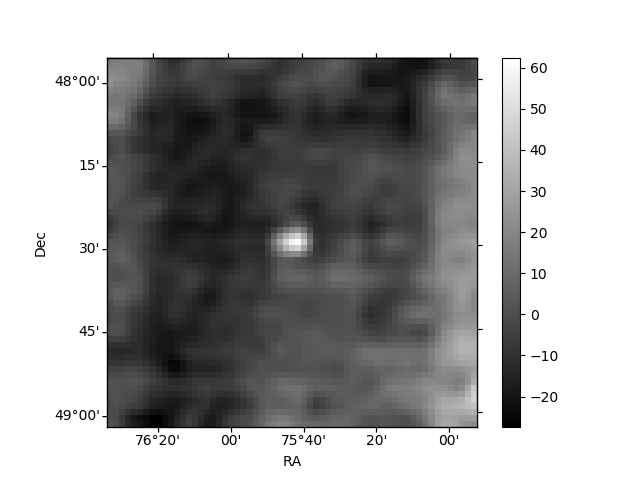
Histogram calculated using DETX and DETY for each event in the final _common_clean file
| Quadrant A | 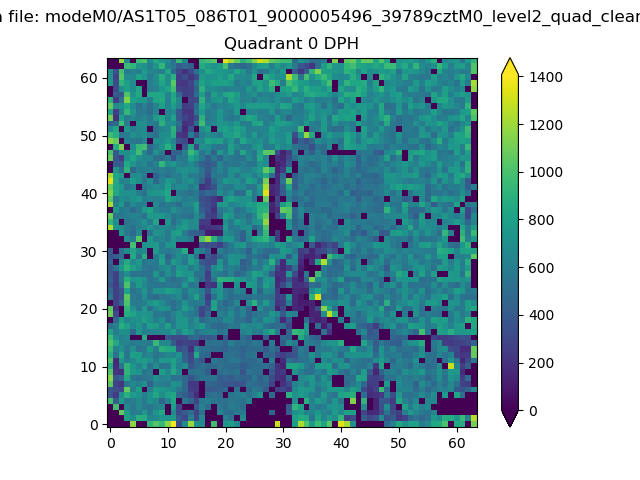 |
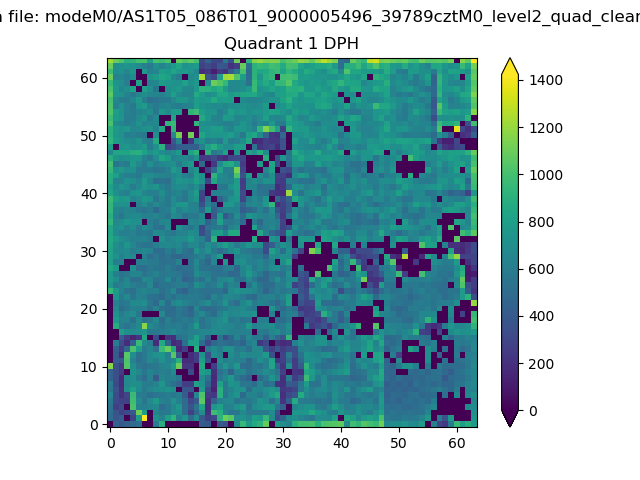 |
Quadrant B |
|---|---|---|---|
| Quadrant D | 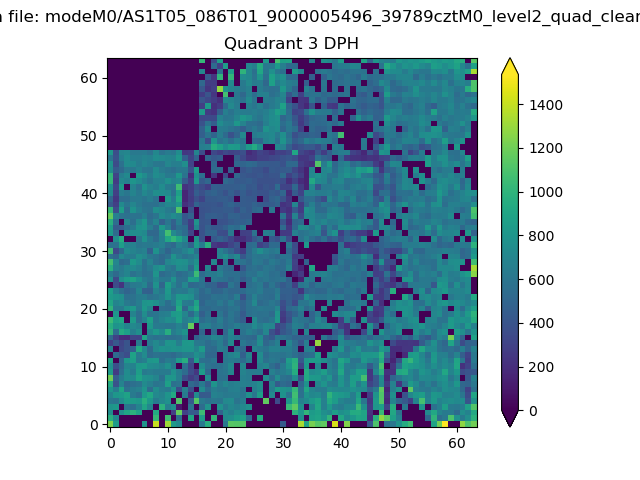 |
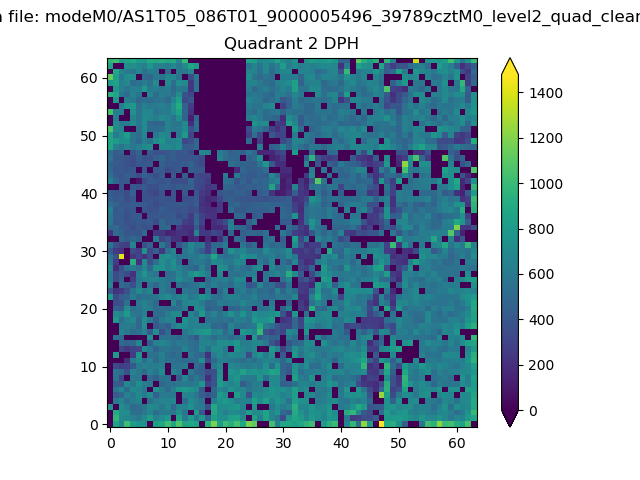 |
Quadrant C |
| Plot type | Count rate plots | Images |
|---|---|---|
| Comparison with Poisson distribution Blue bars denote a histogram of data divided into 1 sec bins. Red curve is a Poisson curve with rate = median count rate of data. |
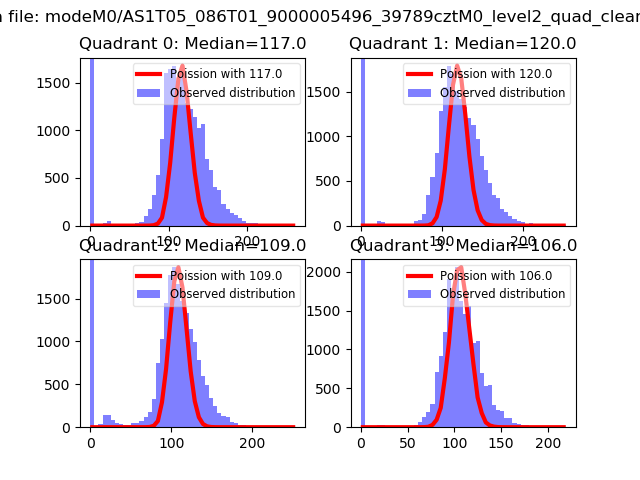 |
 |
| Quadrant-wise count rates Data is divided into 100 sec bins |
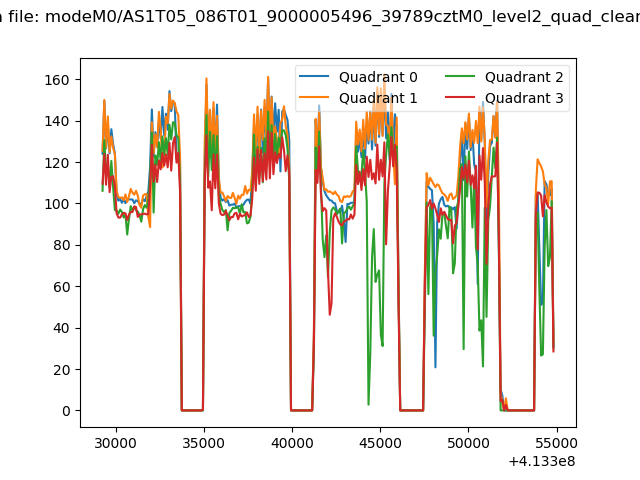 |
|
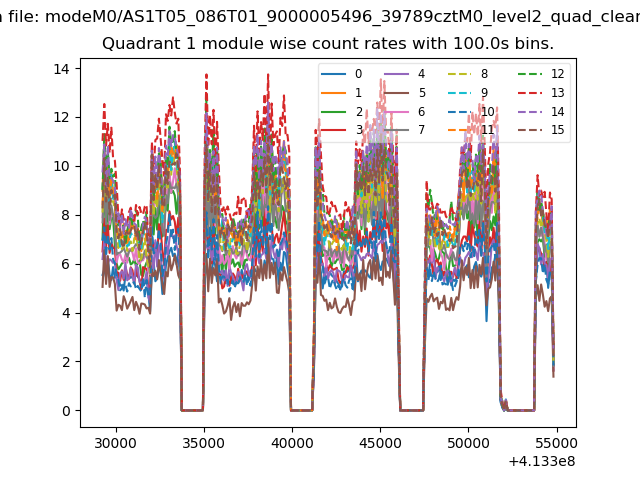
| Module-wise count rates for Quadrant A Data is divided into 100 sec bins |
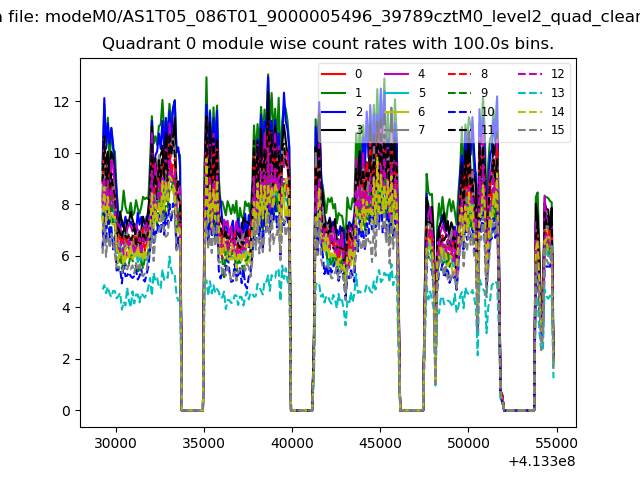 |
 |
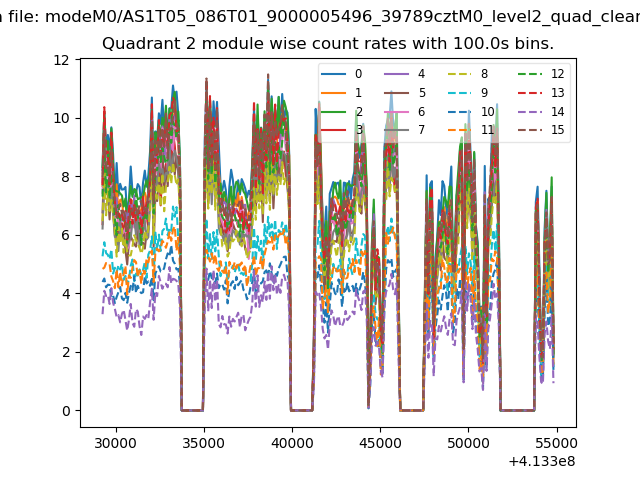
| Module-wise count rates for Quadrant B Data is divided into 100 sec bins |
 |
 |
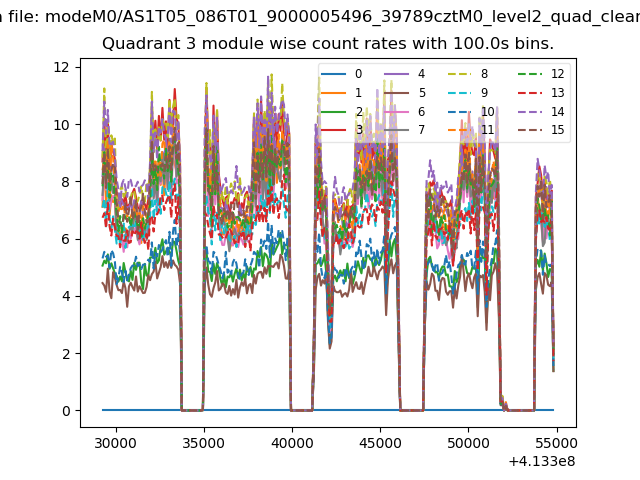
| Module-wise count rates for Quadrant C Data is divided into 100 sec bins |
 |
 |
| Module-wise count rates for Quadrant D Data is divided into 100 sec bins |
 |
 |
| Parameter | Plot |
|---|---|
| CZT HV Monitor |  |
| D_VDD | 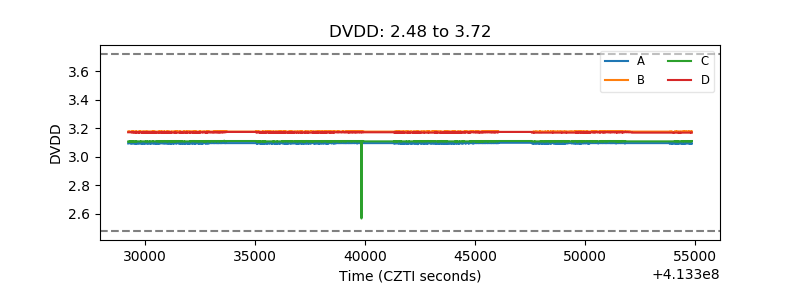 |
| Temperature 1 | 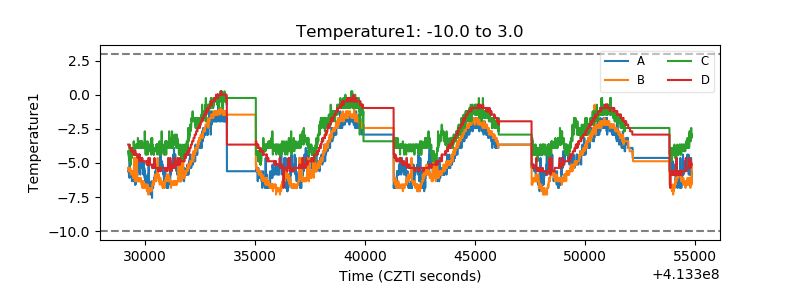 |
| Veto HV Monitor | 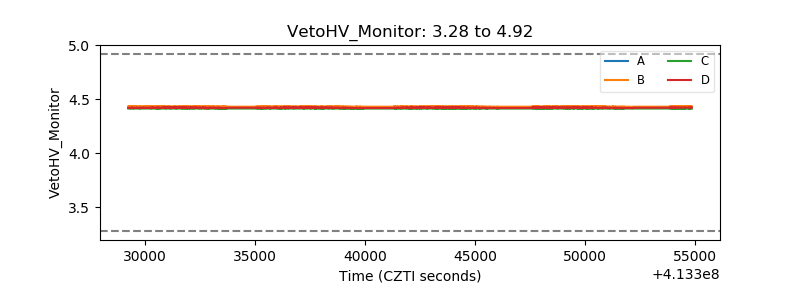 |
| Veto LLD | 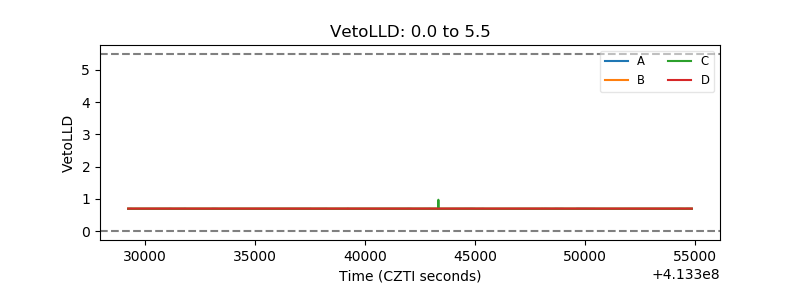 |
| Alpha Counter | 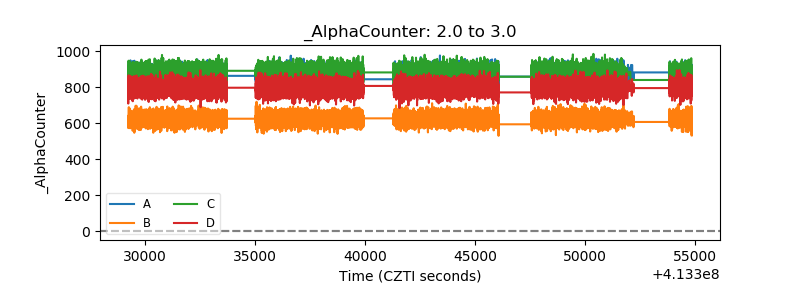 |
| _CPM_Rate | 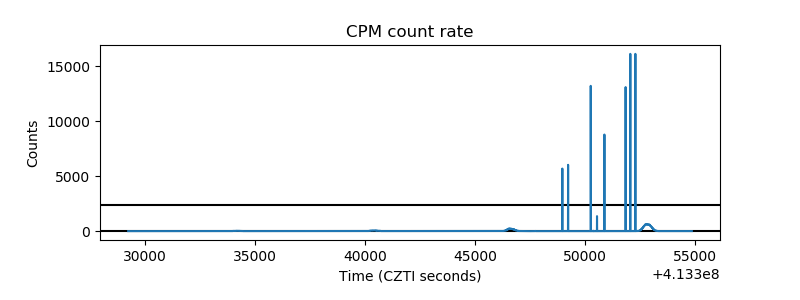 |
| CZT Counter | 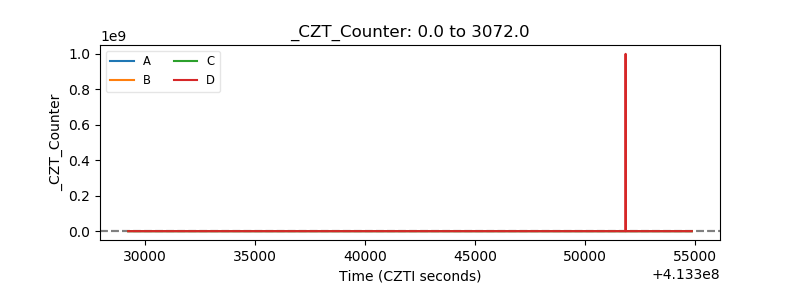 |
| +2.5 Volts monitor | 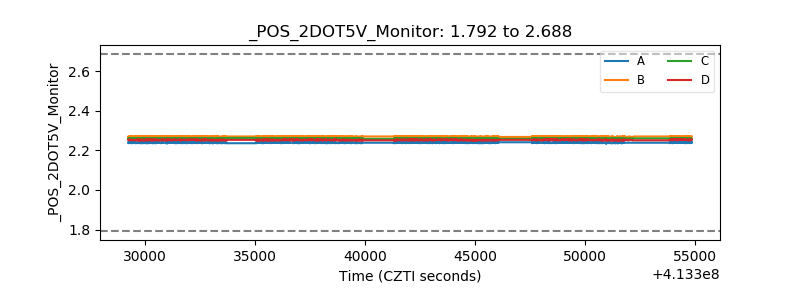 |
| +5 Volts monitor | 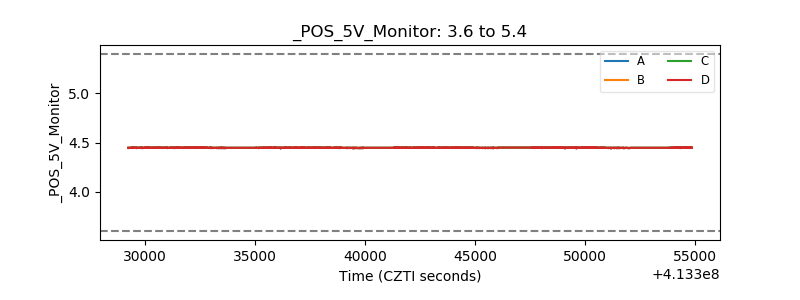 |
| _ROLL_ROT | 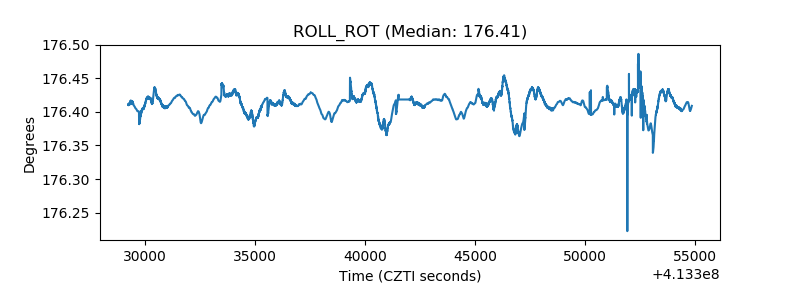 |
| _Roll_DEC | 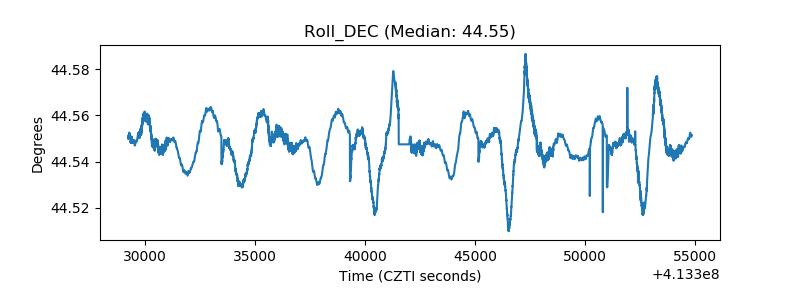 |
| _Roll_RA | 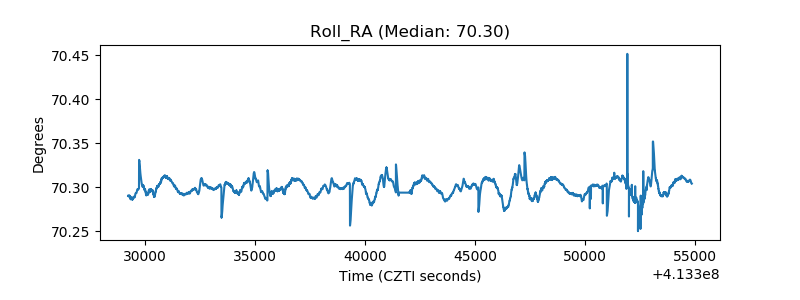 |
| Veto Counter | 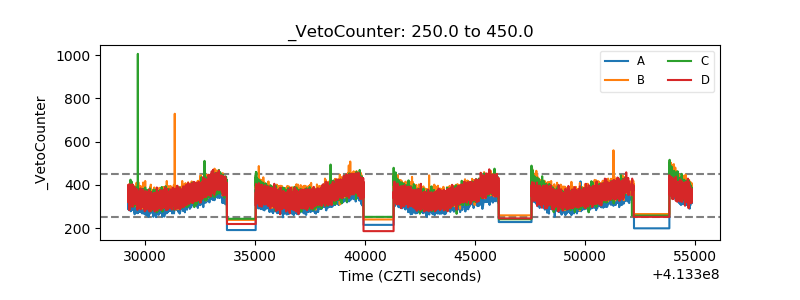 |