| Param | Original file | Final file |
|---|---|---|
| Filename | modeM0/AS1T05_086T01_9000005496_39791cztM0_level2.fits | modeM0/AS1T05_086T01_9000005496_39791cztM0_level2_quad_clean.evt |
| Size (bytes) | 482,932,800 | 97,295,040 |
| Size | 460.6 MB | 92.8 MB |
| Events in quadrant A | 3,997,390 | 664,270 |
| Events in quadrant B | 3,001,399 | 700,721 |
| Events in quadrant C | 7,505,200 | 582,950 |
| Events in quadrant D | 2,949,053 | 616,191 |
| Mode SS | |||
|---|---|---|---|
| Quadrant | BADHDUFLAG | Total packets | Discarded packets |
| A | 0 | 112 | 0 |
| B | 0 | 112 | 0 |
| C | 0 | 112 | 0 |
| D | 0 | 112 | 0 |
| Mode M9 | |||
|---|---|---|---|
| Quadrant | BADHDUFLAG | Total packets | Discarded packets |
| A | 0 | 28 | 0 |
| B | 0 | 28 | 0 |
| C | 0 | 28 | 0 |
| D | 0 | 29 | 0 |
| Mode M0 | |||
|---|---|---|---|
| Quadrant | BADHDUFLAG | Total packets | Discarded packets |
| A | 0 | 15214 | 3 |
| B | 0 | 12397 | 2 |
| C | 0 | 26148 | 2 |
| D | 0 | 12430 | 2 |
| Quadrant | Total seconds | Saturated seconds | Saturation percentage |
|---|---|---|---|
| A | 5455 | 374 | 6.856095% |
| B | 5455 | 159 | 2.914757% |
| C | 5455 | 1061 | 19.450046% |
| D | 5455 | 73 | 1.338222% |
Noise dominated data is calculated using 1-second bins in cleaned event files. If a bin has >2000 counts, and if more than 50% of those come from <1% of pixels, then it is considered to be noise-dominated and hence unusable.
| Quadrant | # 1 sec bins | Bins with >0 counts | Bins with >2000 counts | High rate bins dominated by noise | Noise dominated (total time) | Noise dominated (detector-on time) | Marked lightcurve |
|---|---|---|---|---|---|---|---|
| A | 7187 | 5456 | 262 | 262 | 3.65% | 4.80% | 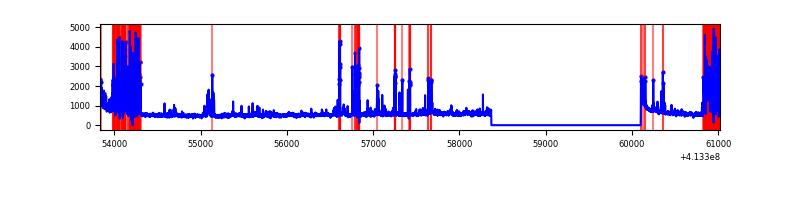 |
| B | 7187 | 5456 | 46 | 46 | 0.64% | 0.84% | 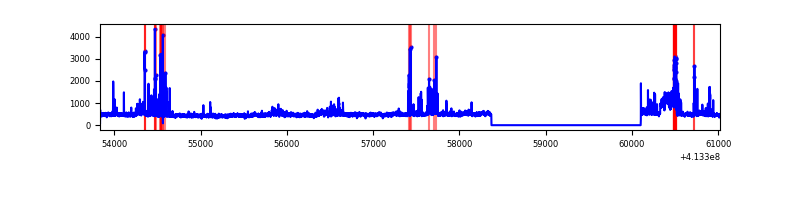 |
| C | 7187 | 5455 | 960 | 960 | 13.36% | 17.60% | 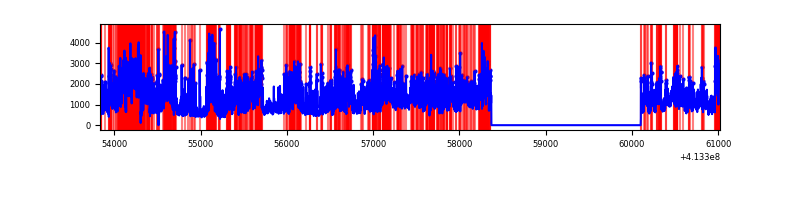 |
| D | 7187 | 5456 | 56 | 56 | 0.78% | 1.03% | 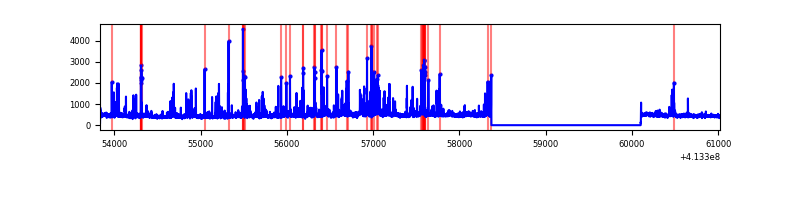 |
Top three noisy pixels from each quadrant. If the there are fewer than three noisy pixels in the level2.evt file, extra rows are filled as -1
| Pixel properties | Quadrant properties | ||||||
|---|---|---|---|---|---|---|---|
| Quadrant | DetID | PixID | Counts | Sigma | Mean | Median | Sigma |
| A | 9 | 143 | 964670 | 7349.03 | 625 | 614 | 131.2 |
| A | 10 | 83 | 443503 | 3376.16 | 625 | 614 | 131.2 |
| A | 2 | 79 | 110043 | 834.18 | 625 | 614 | 131.2 |
| B | 5 | 172 | 405589 | 3239.46 | 633 | 617 | 125.0 |
| B | 0 | 190 | 58546 | 463.39 | 633 | 617 | 125.0 |
| B | 4 | 171 | 45538 | 359.33 | 633 | 617 | 125.0 |
| C | 9 | 187 | 3706398 | 26807.49 | 583 | 590 | 138.2 |
| C | 15 | 208 | 1302199 | 9415.73 | 583 | 590 | 138.2 |
| C | 15 | 214 | 212841 | 1535.41 | 583 | 590 | 138.2 |
| D | 2 | 249 | 266873 | 1725.78 | 620 | 604 | 154.3 |
| D | 13 | 249 | 127276 | 821.0 | 620 | 604 | 154.3 |
| D | 12 | 227 | 90497 | 582.63 | 620 | 604 | 154.3 |
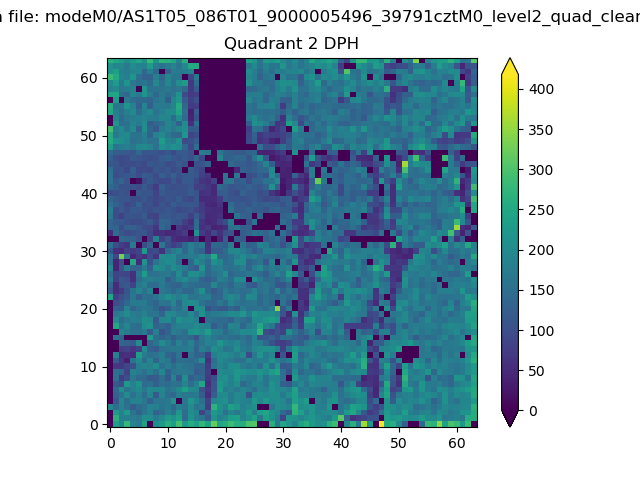
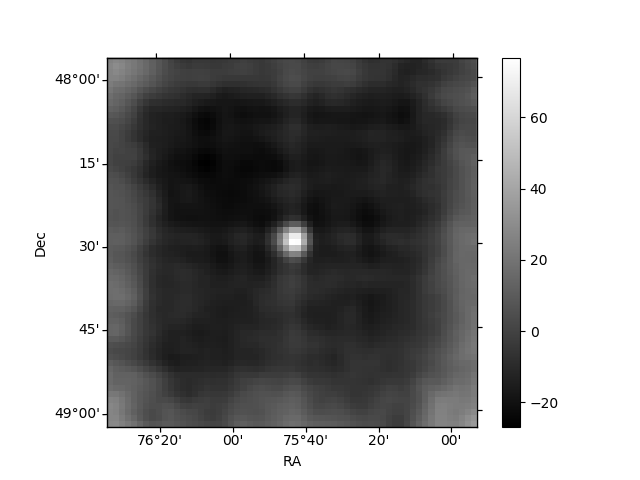
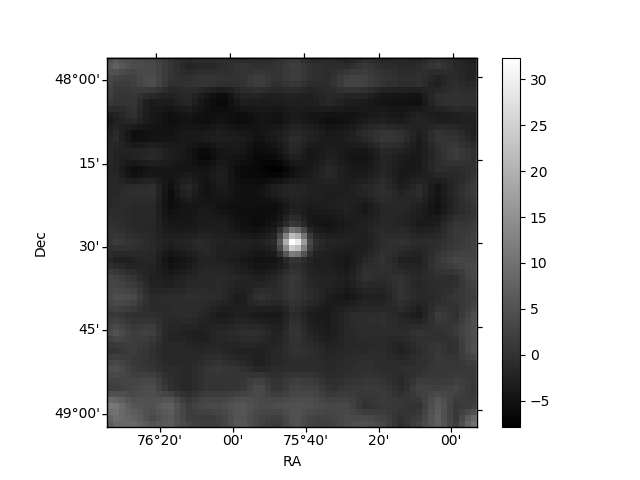
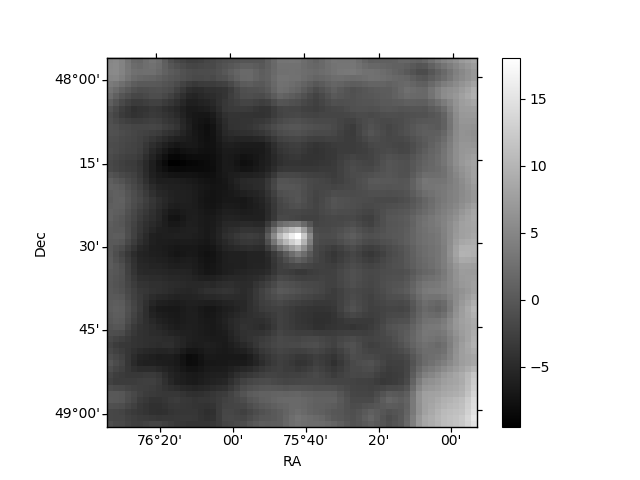
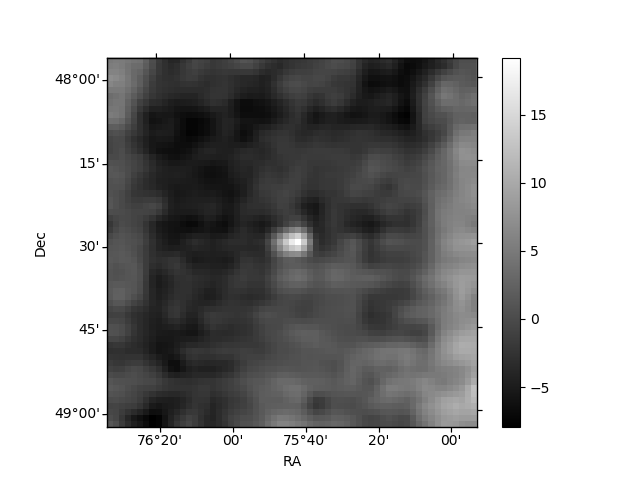
Histogram calculated using DETX and DETY for each event in the final _common_clean file
| Quadrant A | 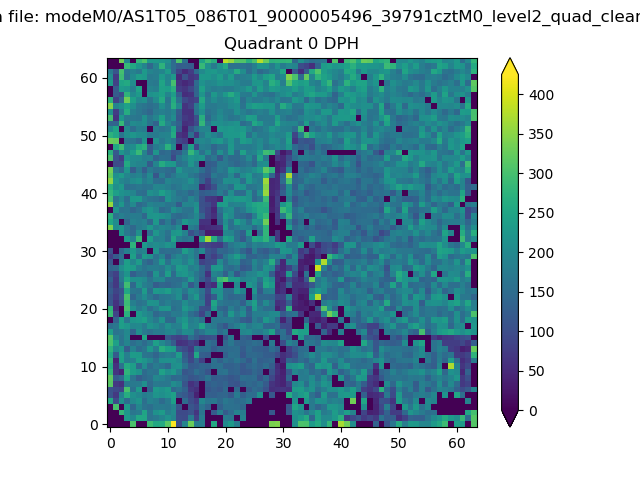 |
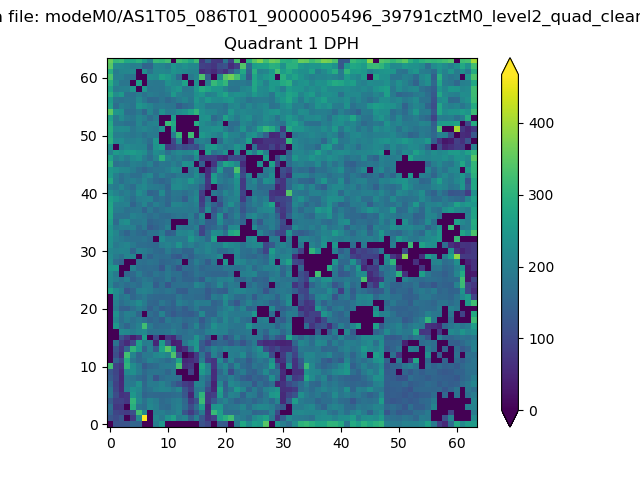 |
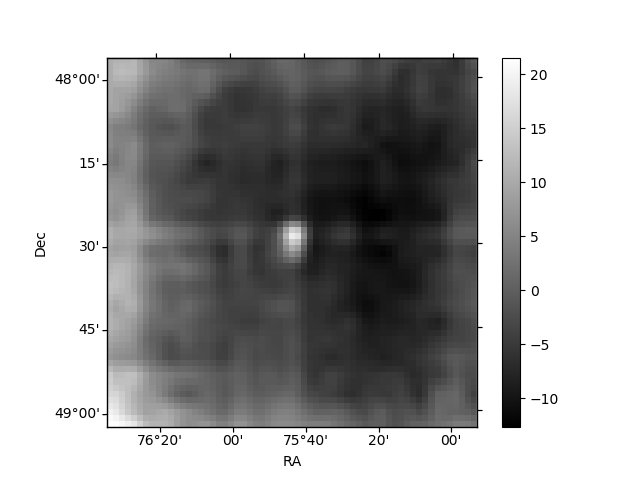
Quadrant B |
|---|---|---|---|
| Quadrant D | 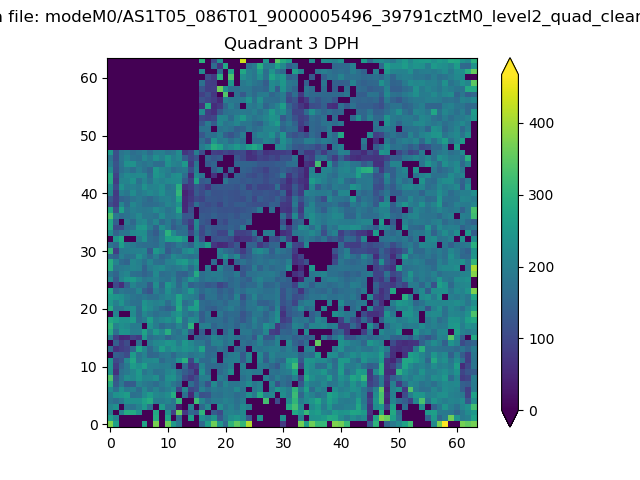 |
 |
Quadrant C |
| Plot type | Count rate plots | Images |
|---|---|---|
| Comparison with Poisson distribution Blue bars denote a histogram of data divided into 1 sec bins. Red curve is a Poisson curve with rate = median count rate of data. |
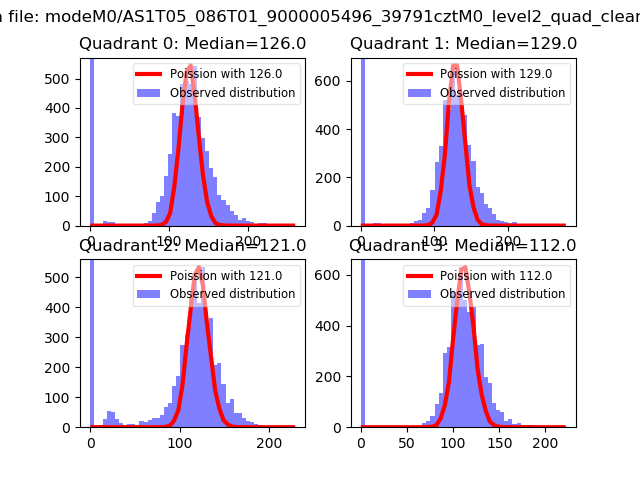 |
 |
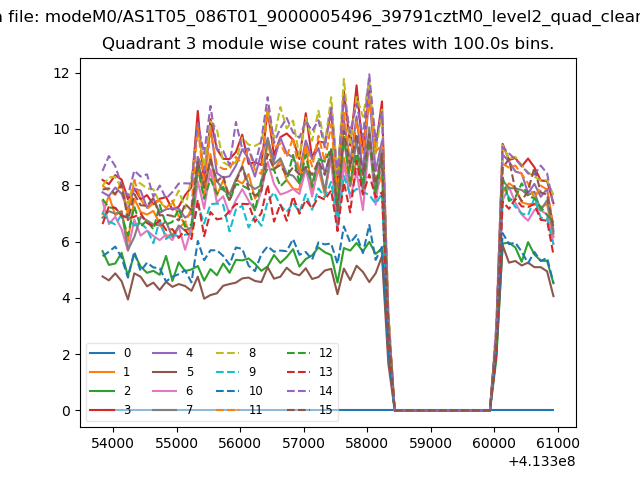
| Quadrant-wise count rates Data is divided into 100 sec bins |
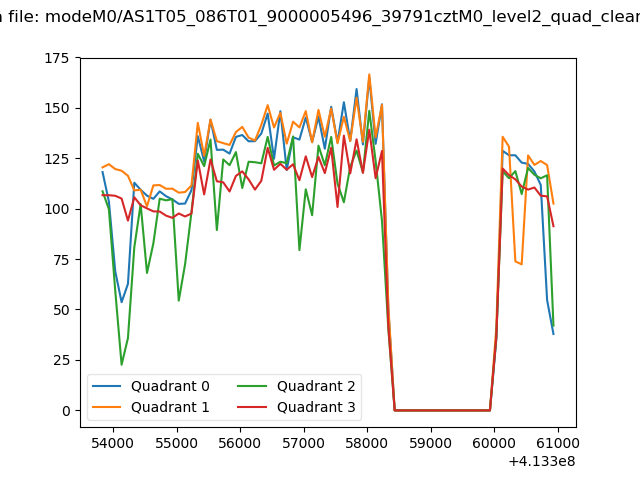 |
|
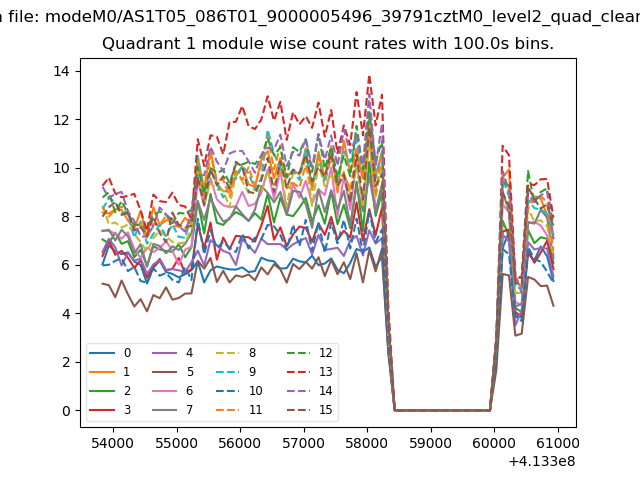
| Module-wise count rates for Quadrant A Data is divided into 100 sec bins |
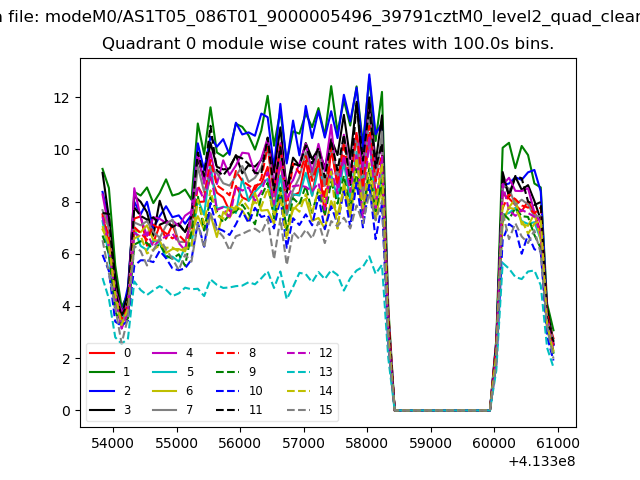 |
 |
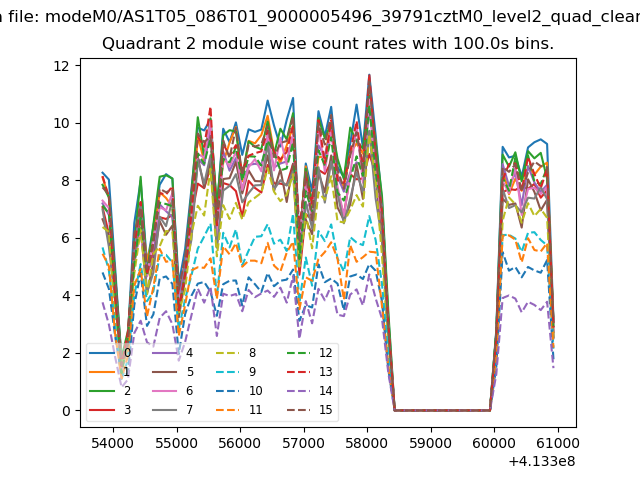
| Module-wise count rates for Quadrant B Data is divided into 100 sec bins |
 |
 |
| Module-wise count rates for Quadrant C Data is divided into 100 sec bins |
 |
 |
| Module-wise count rates for Quadrant D Data is divided into 100 sec bins |
 |
 |
| Parameter | Plot |
|---|---|
| CZT HV Monitor | 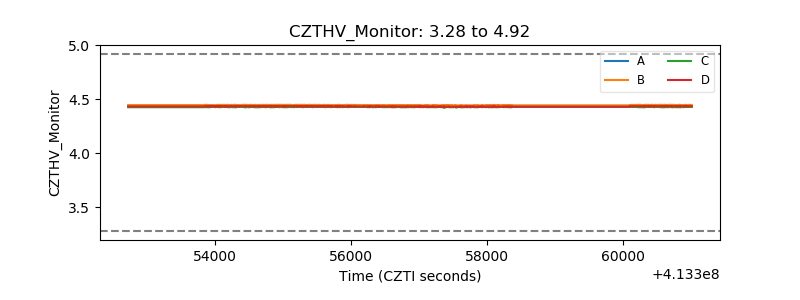 |
| D_VDD | 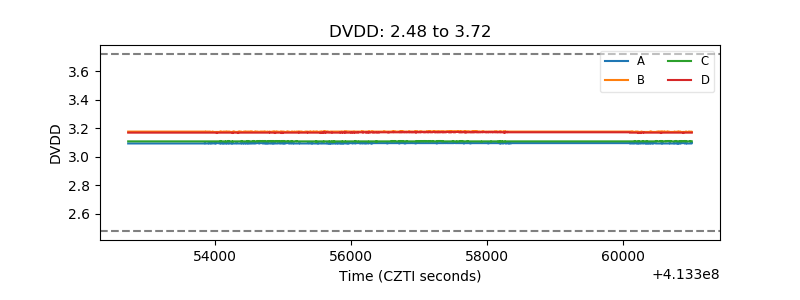 |
| Temperature 1 | 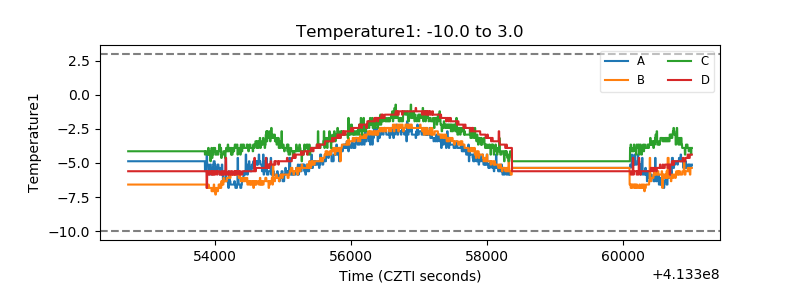 |
| Veto HV Monitor | 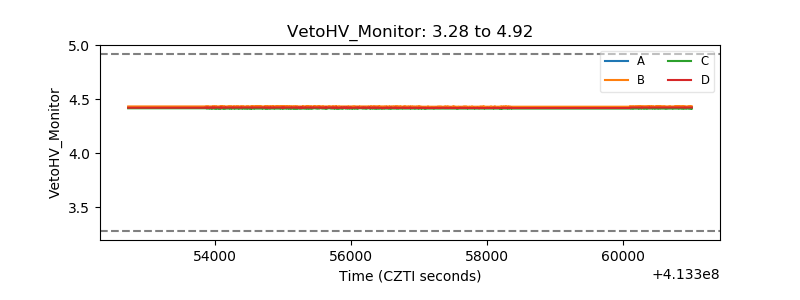 |
| Veto LLD | 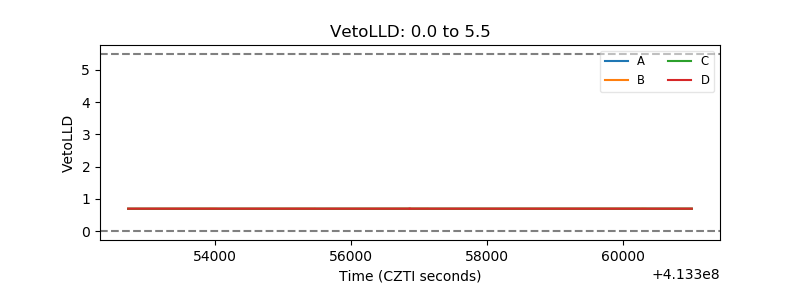 |
| Alpha Counter | 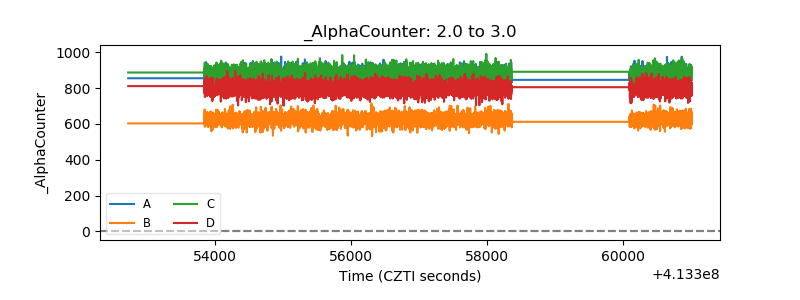 |
| _CPM_Rate | 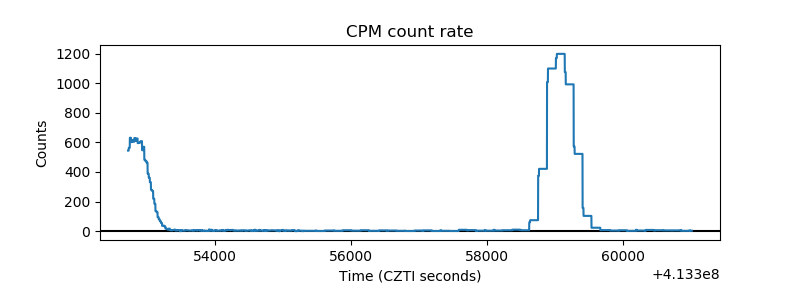 |
| CZT Counter | 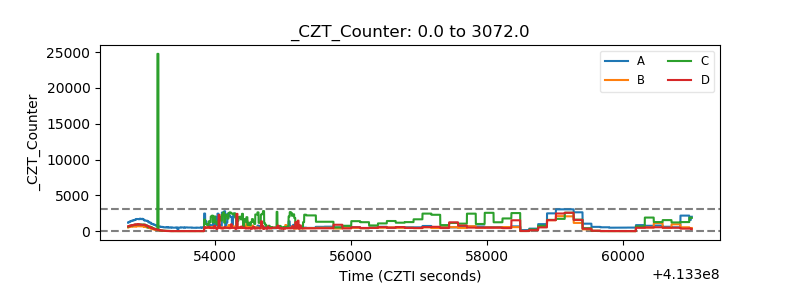 |
| +2.5 Volts monitor | 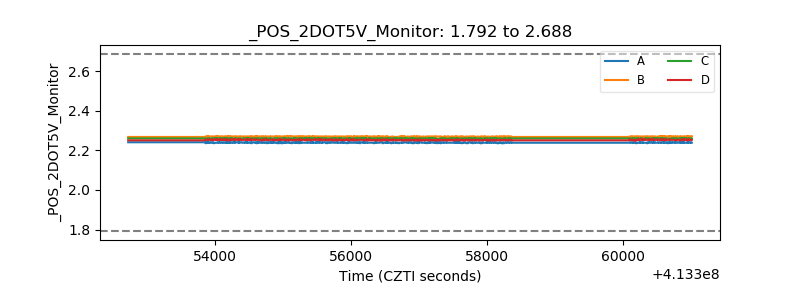 |
| +5 Volts monitor | 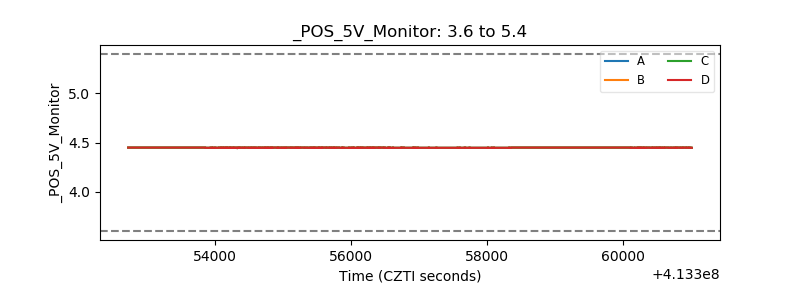 |
| _ROLL_ROT | 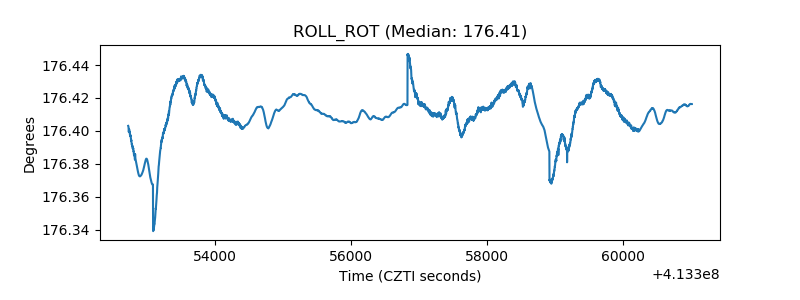 |
| _Roll_DEC | 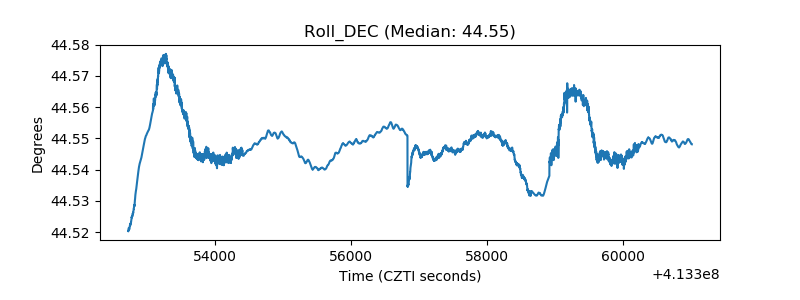 |
| _Roll_RA | 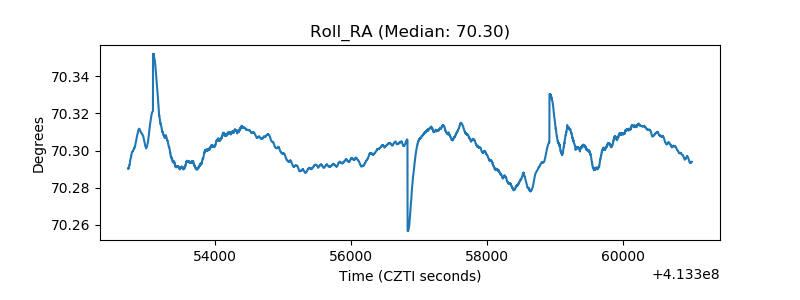 |
| Veto Counter | 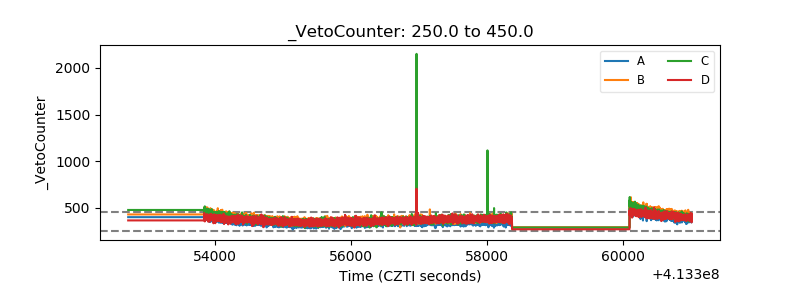 |