| Param | Original file | Final file |
|---|---|---|
| Filename | modeM0/AS1T05_086T01_9000005496_39794cztM0_level2.fits | modeM0/AS1T05_086T01_9000005496_39794cztM0_level2_quad_clean.evt |
| Size (bytes) | 27,417,600 | 2,237,760 |
| Size | 26.1 MB | 2.1 MB |
| Events in quadrant A | 317,373 | 4,126 |
| Events in quadrant B | 165,272 | 15,968 |
| Events in quadrant C | 369,631 | 7,995 |
| Events in quadrant D | 137,190 | 12,271 |
| Mode SS | |||
|---|---|---|---|
| Quadrant | BADHDUFLAG | Total packets | Discarded packets |
| A | 0 | 13 | 5 |
| B | 0 | 13 | 7 |
| C | 0 | 12 | 6 |
| D | 0 | 10 | 8 |
| Mode M0 | |||
|---|---|---|---|
| Quadrant | BADHDUFLAG | Total packets | Discarded packets |
| A | 0 | 2445 | 1335 |
| B | 0 | 1376 | 693 |
| C | 0 | 3800 | 2540 |
| D | 0 | 1283 | 660 |
| Quadrant | Total seconds | Saturated seconds | Saturation percentage |
|---|---|---|---|
| A | 270 | 76 | 28.148148% |
| B | 312 | 1 | 0.320513% |
| C | 231 | 95 | 41.125541% |
| D | 304 | 0 | 0.000000% |
Noise dominated data is calculated using 1-second bins in cleaned event files. If a bin has >2000 counts, and if more than 50% of those come from <1% of pixels, then it is considered to be noise-dominated and hence unusable.
| Quadrant | # 1 sec bins | Bins with >0 counts | Bins with >2000 counts | High rate bins dominated by noise | Noise dominated (total time) | Noise dominated (detector-on time) | Marked lightcurve |
|---|---|---|---|---|---|---|---|
| A | 569 | 314 | 45 | 45 | 7.91% | 14.33% | 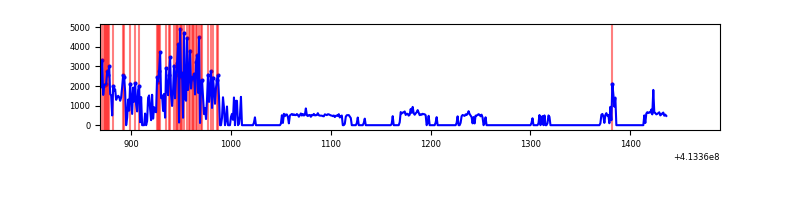 |
| B | 618 | 353 | 0 | 0 | 0.00% | 0.00% | 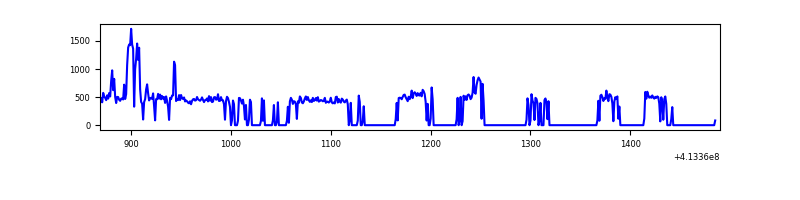 |
| C | 621 | 274 | 64 | 64 | 10.31% | 23.36% | 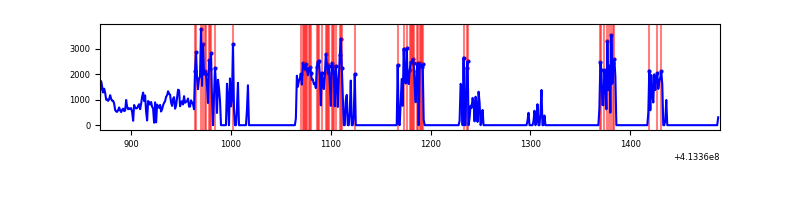 |
| D | 620 | 367 | 0 | 0 | 0.00% | 0.00% | 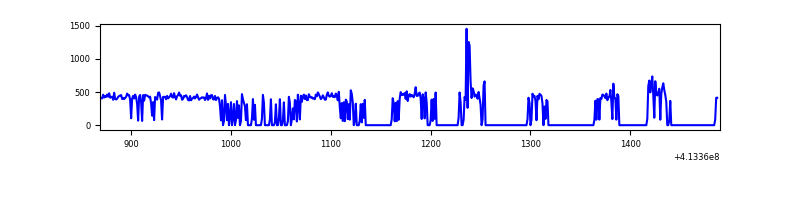 |
Top three noisy pixels from each quadrant. If the there are fewer than three noisy pixels in the level2.evt file, extra rows are filled as -1
| Pixel properties | Quadrant properties | ||||||
|---|---|---|---|---|---|---|---|
| Quadrant | DetID | PixID | Counts | Sigma | Mean | Median | Sigma |
| A | 9 | 143 | 182553 | 23592.02 | 27 | 27 | 7.7 |
| A | 10 | 83 | 13024 | 1679.9 | 27 | 27 | 7.7 |
| A | 2 | 79 | 12021 | 1550.26 | 27 | 27 | 7.7 |
| B | 5 | 172 | 15469 | 1640.27 | 36 | 35 | 9.4 |
| B | 0 | 190 | 5597 | 591.11 | 36 | 35 | 9.4 |
| B | 12 | 111 | 867 | 88.42 | 36 | 35 | 9.4 |
| C | 9 | 187 | 213123 | 32255.84 | 20 | 20 | 6.6 |
| C | 15 | 208 | 66539 | 10068.49 | 20 | 20 | 6.6 |
| C | 15 | 214 | 7348 | 1109.19 | 20 | 20 | 6.6 |
| D | 2 | 249 | 5206 | 512.24 | 33 | 32 | 10.1 |
| D | 2 | 120 | 2545 | 248.79 | 33 | 32 | 10.1 |
| D | 2 | 234 | 1441 | 139.49 | 33 | 32 | 10.1 |
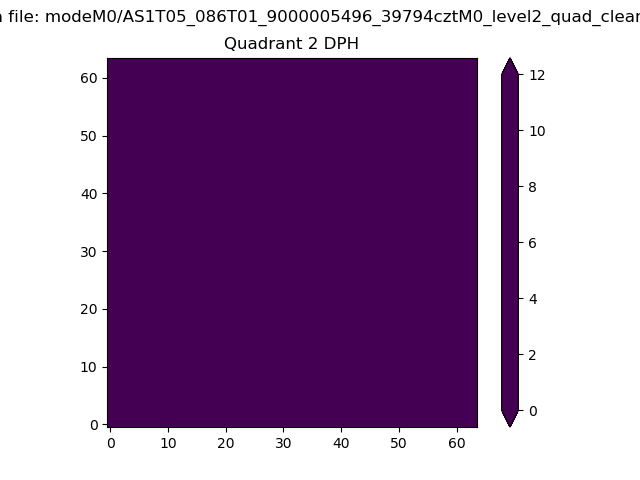
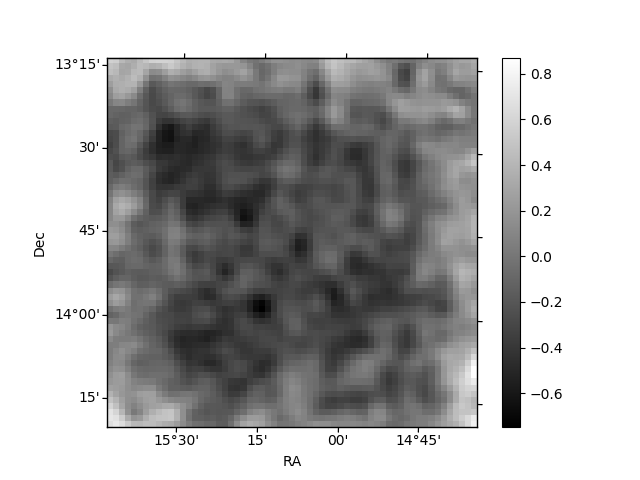
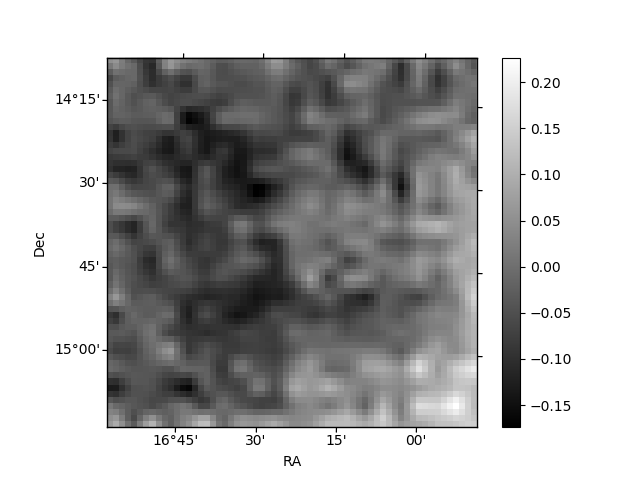
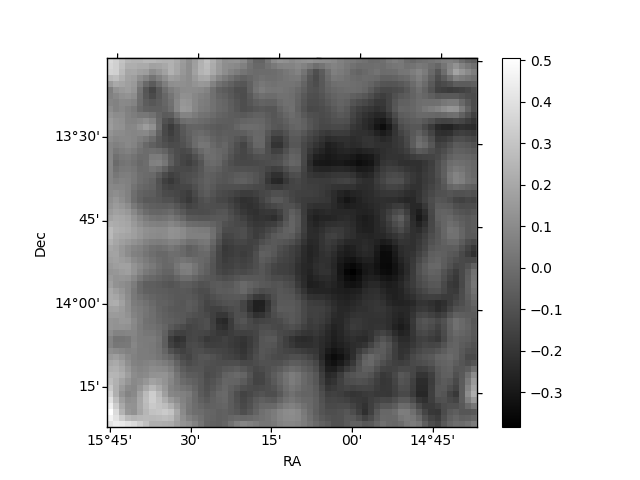
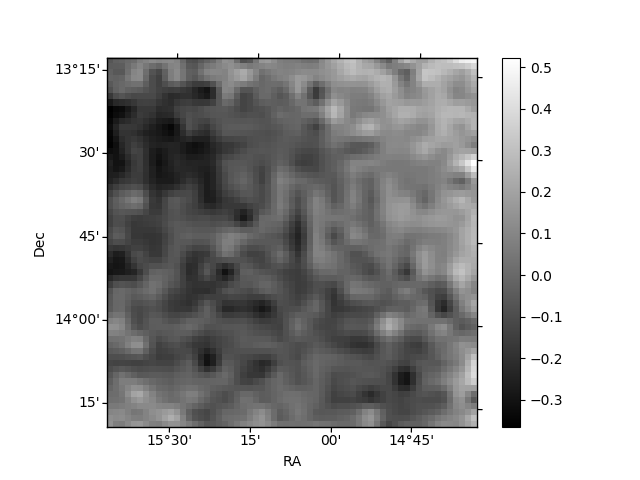
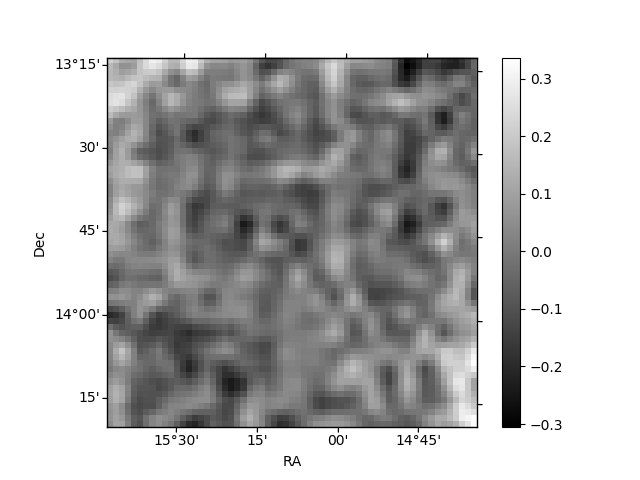
Histogram calculated using DETX and DETY for each event in the final _common_clean file
| Quadrant A | 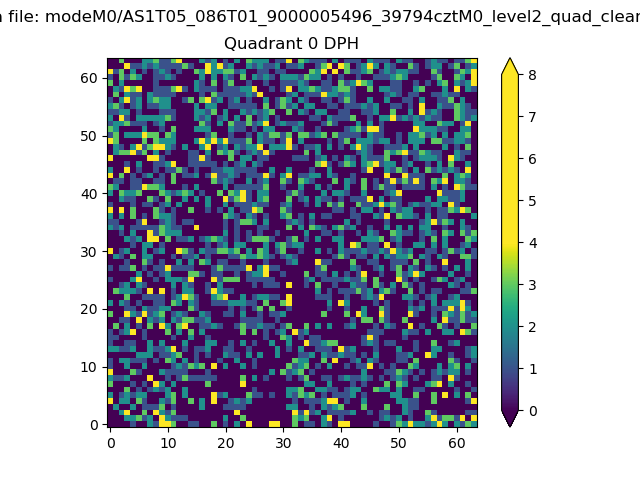 |
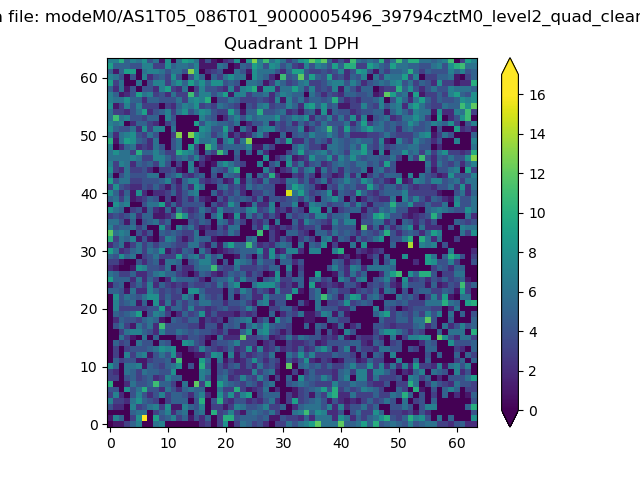 |
Quadrant B |
|---|---|---|---|
| Quadrant D | 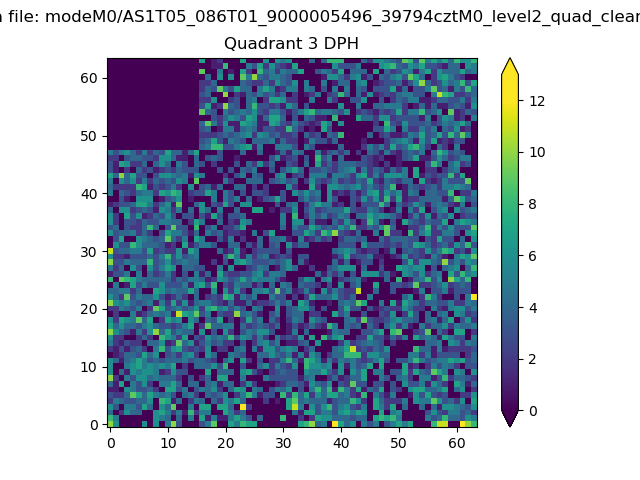 |
 |
Quadrant C |
| Plot type | Count rate plots | Images |
|---|---|---|
| Comparison with Poisson distribution Blue bars denote a histogram of data divided into 1 sec bins. Red curve is a Poisson curve with rate = median count rate of data. |
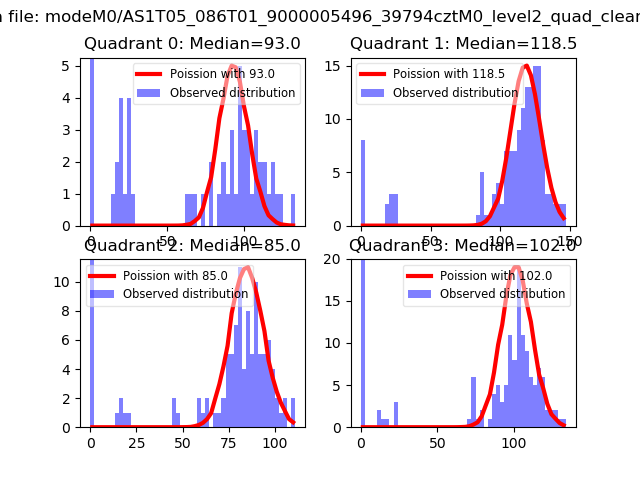 |
 |
| Quadrant-wise count rates Data is divided into 100 sec bins |
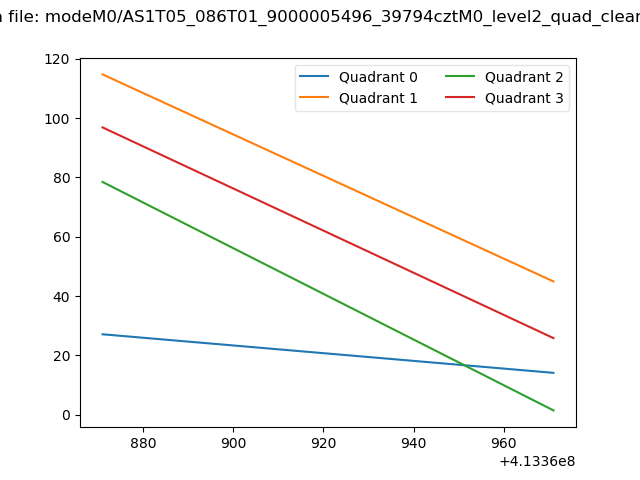 |
|
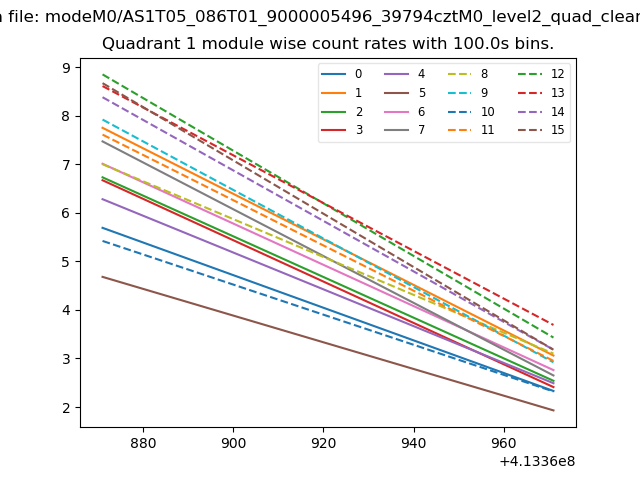
| Module-wise count rates for Quadrant A Data is divided into 100 sec bins |
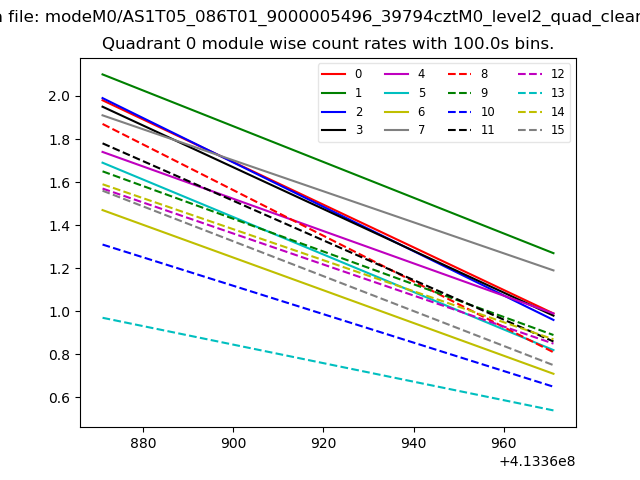 |
 |
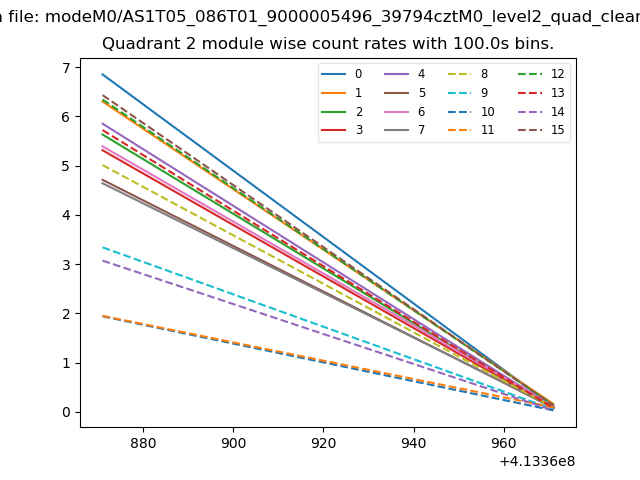
| Module-wise count rates for Quadrant B Data is divided into 100 sec bins |
 |
 |
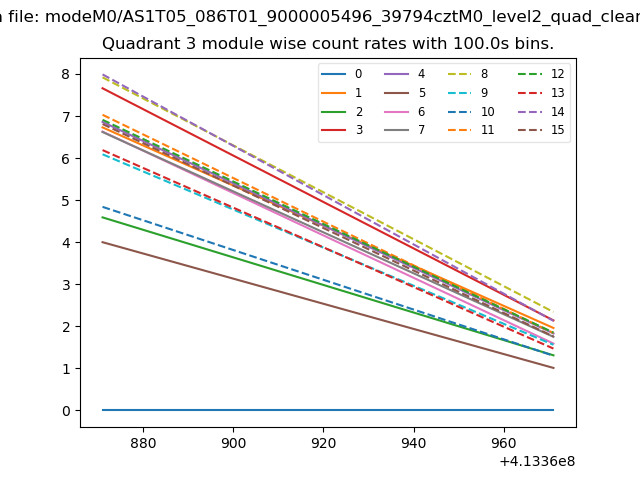
| Module-wise count rates for Quadrant C Data is divided into 100 sec bins |
 |
 |
| Module-wise count rates for Quadrant D Data is divided into 100 sec bins |
 |
 |
| Parameter | Plot |
|---|---|
| CZT HV Monitor | 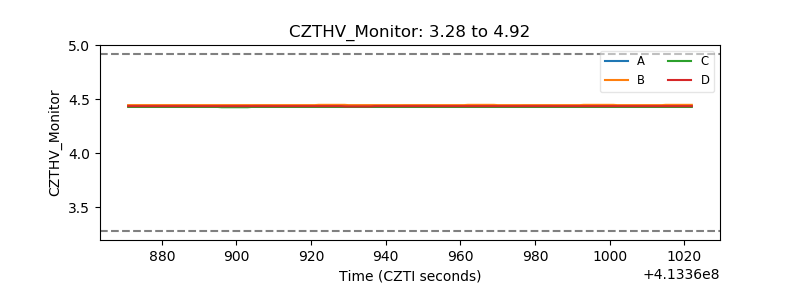 |
| D_VDD | 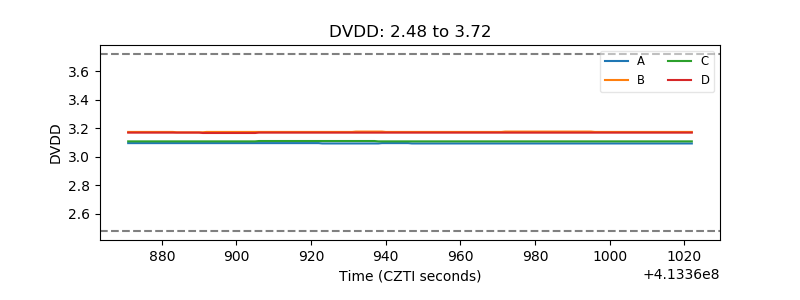 |
| Temperature 1 | 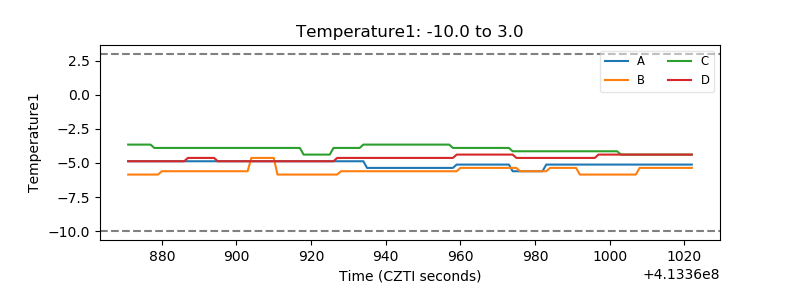 |
| Veto HV Monitor | 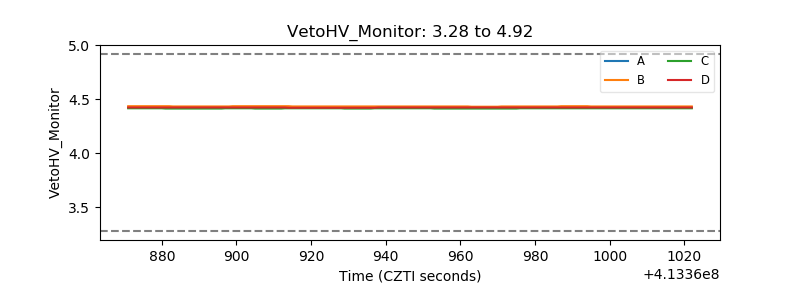 |
| Veto LLD | 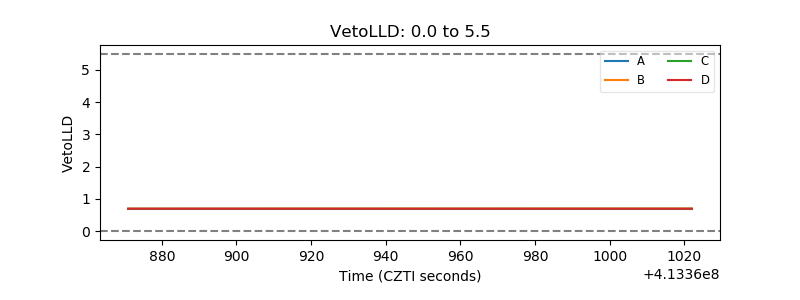 |
| Alpha Counter | 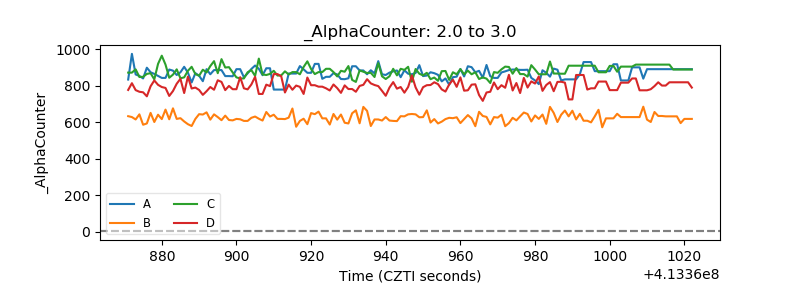 |
| _CPM_Rate | 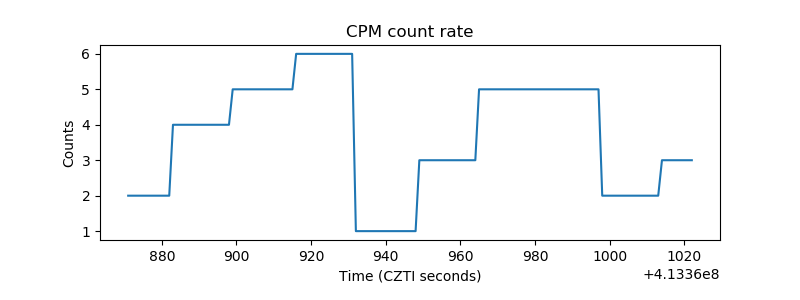 |
| CZT Counter | 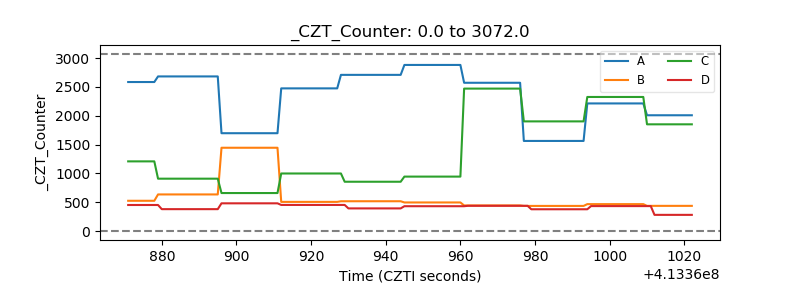 |
| +2.5 Volts monitor | 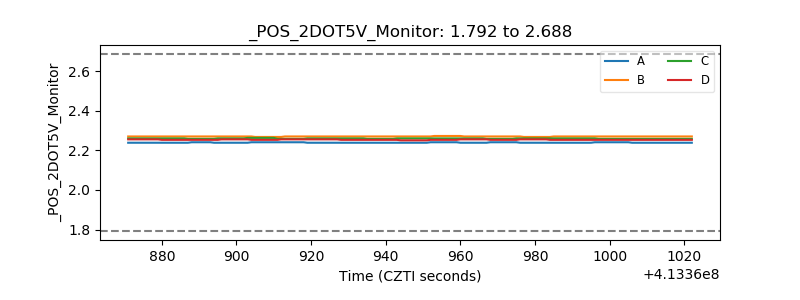 |
| +5 Volts monitor | 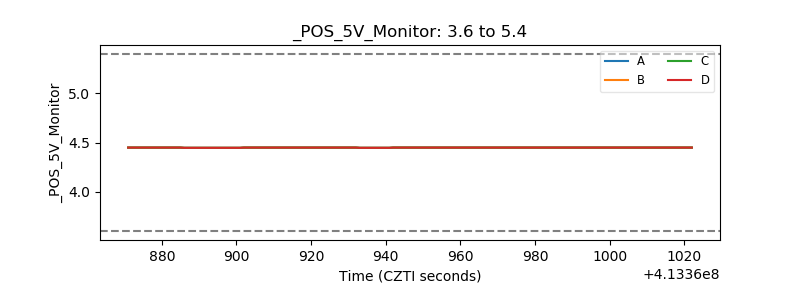 |
| _ROLL_ROT | 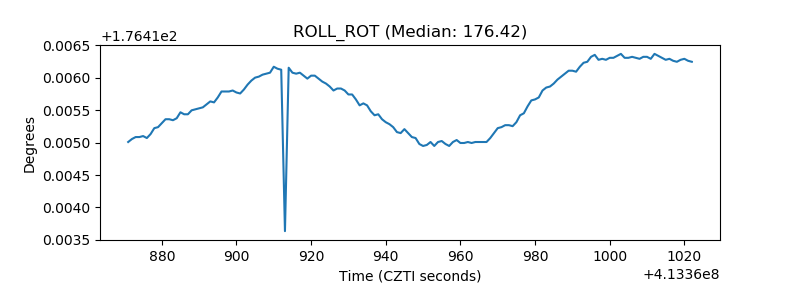 |
| _Roll_DEC | 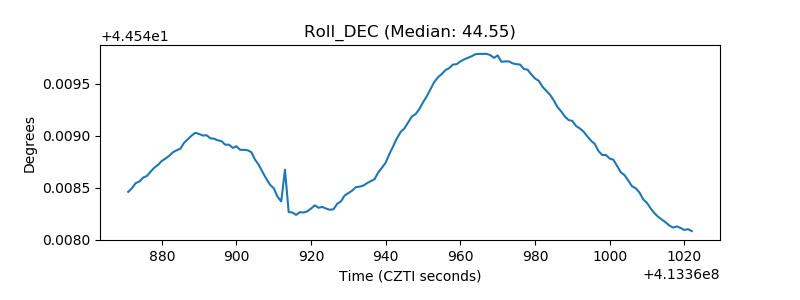 |
| _Roll_RA | 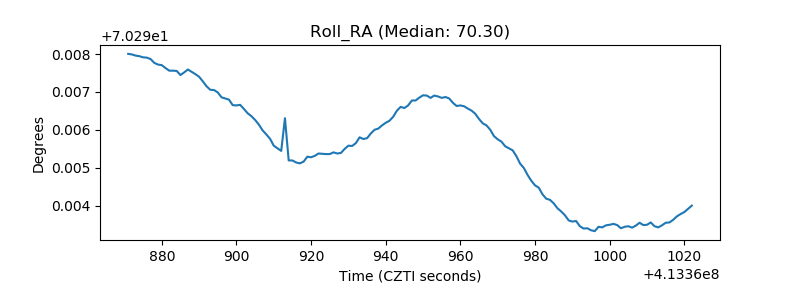 |
| Veto Counter | 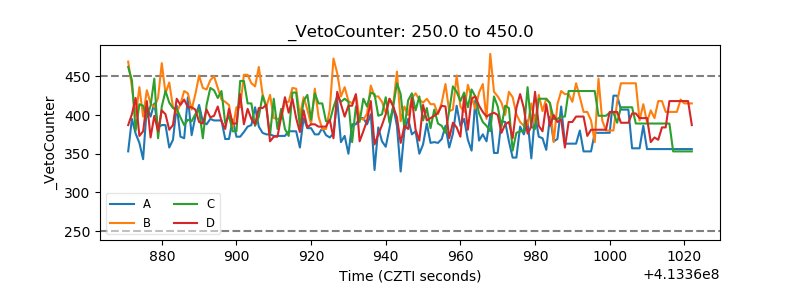 |