| Param | Original file | Final file |
|---|---|---|
| Filename | modeM0/AS1T05_086T01_9000005496_39795cztM0_level2.fits | modeM0/AS1T05_086T01_9000005496_39795cztM0_level2_quad_clean.evt |
| Size (bytes) | 71,239,680 | 11,430,720 |
| Size | 67.9 MB | 10.9 MB |
| Events in quadrant A | 726,797 | 74,684 |
| Events in quadrant B | 348,430 | 91,366 |
| Events in quadrant C | 1,202,644 | 47,000 |
| Events in quadrant D | 303,320 | 78,487 |
| Mode SS | |||
|---|---|---|---|
| Quadrant | BADHDUFLAG | Total packets | Discarded packets |
| A | 0 | 14 | 0 |
| B | 0 | 14 | 0 |
| C | 0 | 14 | 0 |
| D | 0 | 14 | 0 |
| Mode M0 | |||
|---|---|---|---|
| Quadrant | BADHDUFLAG | Total packets | Discarded packets |
| A | 0 | 2587 | 0 |
| B | 0 | 1459 | 0 |
| C | 0 | 4044 | 0 |
| D | 0 | 1377 | 0 |
| Quadrant | Total seconds | Saturated seconds | Saturation percentage |
|---|---|---|---|
| A | 677 | 142 | 20.974889% |
| B | 677 | 1 | 0.147710% |
| C | 677 | 335 | 49.483013% |
| D | 677 | 0 | 0.000000% |
Noise dominated data is calculated using 1-second bins in cleaned event files. If a bin has >2000 counts, and if more than 50% of those come from <1% of pixels, then it is considered to be noise-dominated and hence unusable.
| Quadrant | # 1 sec bins | Bins with >0 counts | Bins with >2000 counts | High rate bins dominated by noise | Noise dominated (total time) | Noise dominated (detector-on time) | Marked lightcurve |
|---|---|---|---|---|---|---|---|
| A | 677 | 677 | 101 | 101 | 14.92% | 14.92% | 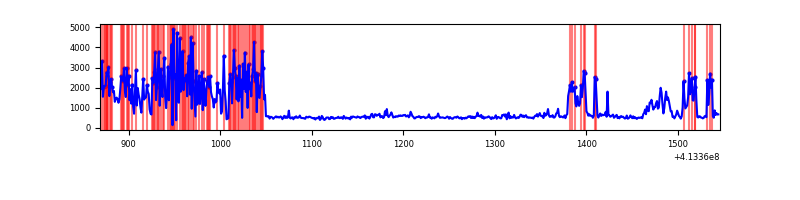 |
| B | 677 | 677 | 0 | 0 | 0.00% | 0.00% | 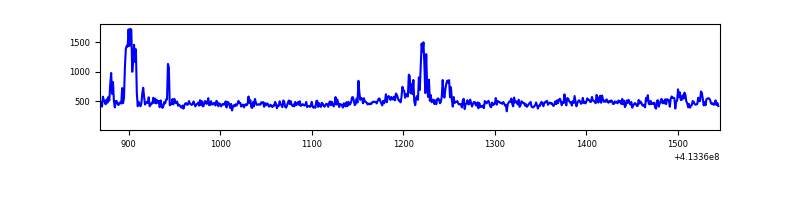 |
| C | 677 | 677 | 286 | 286 | 42.25% | 42.25% | 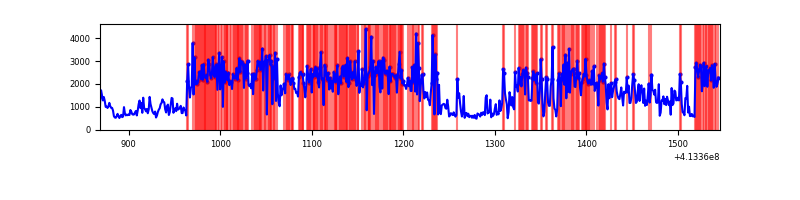 |
| D | 677 | 677 | 0 | 0 | 0.00% | 0.00% | 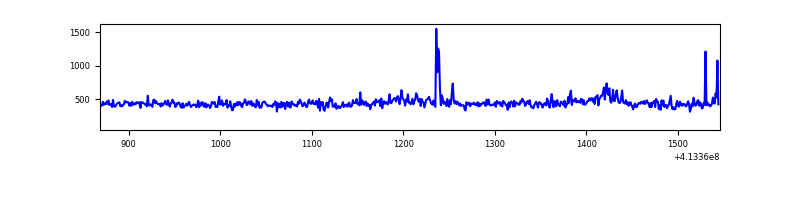 |
Top three noisy pixels from each quadrant. If the there are fewer than three noisy pixels in the level2.evt file, extra rows are filled as -1
| Pixel properties | Quadrant properties | ||||||
|---|---|---|---|---|---|---|---|
| Quadrant | DetID | PixID | Counts | Sigma | Mean | Median | Sigma |
| A | 9 | 143 | 362342 | 21123.09 | 72 | 71 | 17.2 |
| A | 2 | 79 | 44767 | 2606.11 | 72 | 71 | 17.2 |
| A | 10 | 83 | 32209 | 1873.88 | 72 | 71 | 17.2 |
| B | 0 | 190 | 20413 | 1152.83 | 78 | 77 | 17.6 |
| B | 5 | 172 | 17365 | 980.04 | 78 | 77 | 17.6 |
| B | 12 | 111 | 1856 | 100.85 | 78 | 77 | 17.6 |
| C | 9 | 187 | 796673 | 51044.31 | 58 | 58 | 15.6 |
| C | 15 | 208 | 154942 | 9924.43 | 58 | 58 | 15.6 |
| C | 15 | 214 | 20957 | 1339.14 | 58 | 58 | 15.6 |
| D | 2 | 249 | 8055 | 392.52 | 75 | 73 | 20.3 |
| D | 2 | 120 | 4521 | 218.73 | 75 | 73 | 20.3 |
| D | 2 | 234 | 3189 | 153.23 | 75 | 73 | 20.3 |
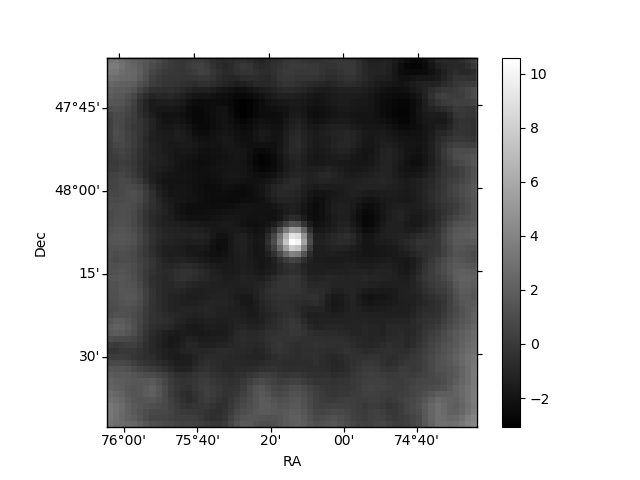
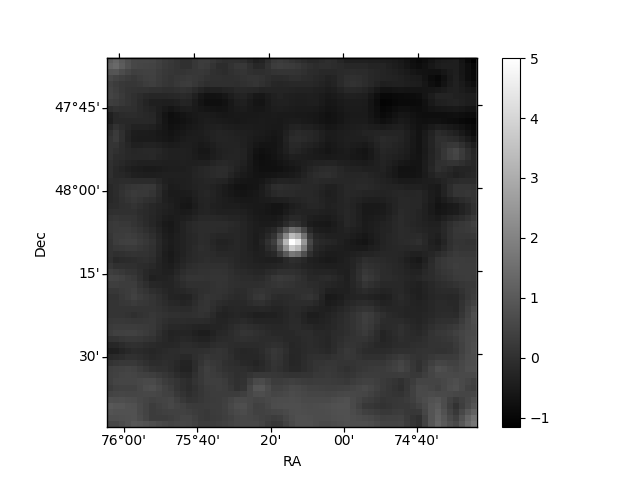
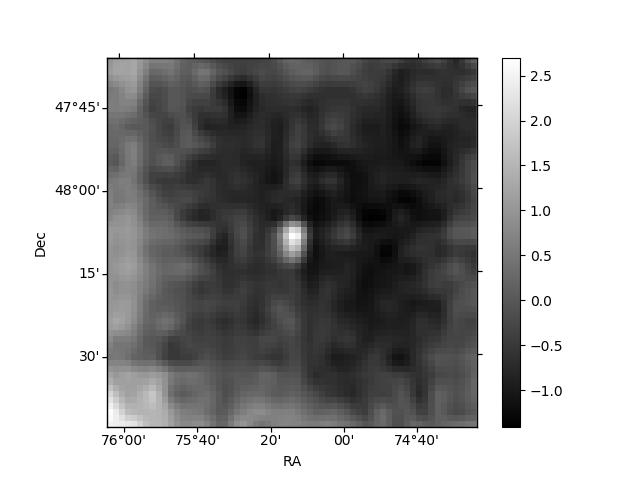
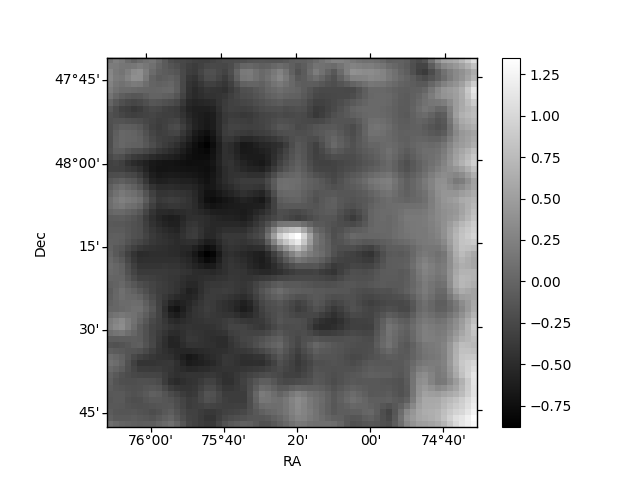
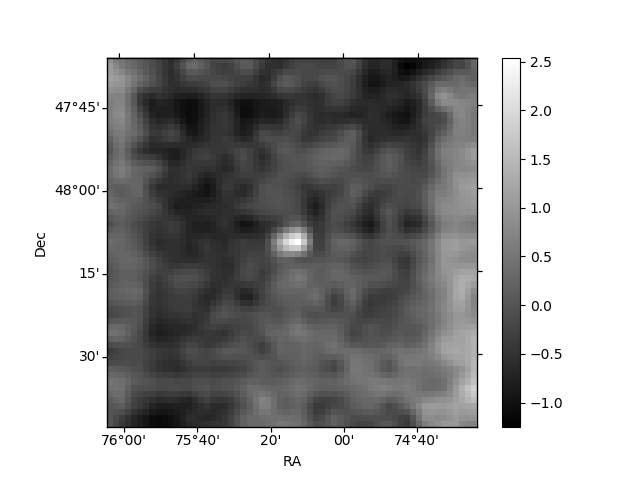
Histogram calculated using DETX and DETY for each event in the final _common_clean file
| Quadrant A | 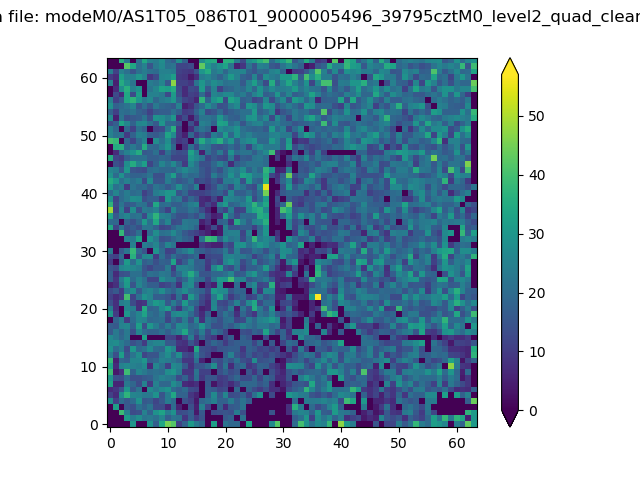 |
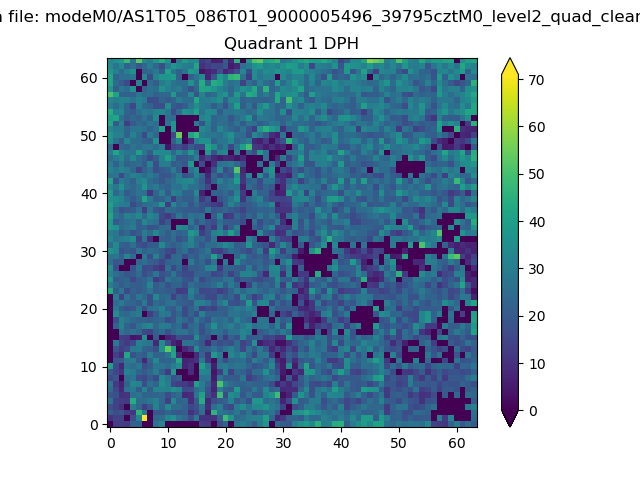 |
Quadrant B |
|---|---|---|---|
| Quadrant D | 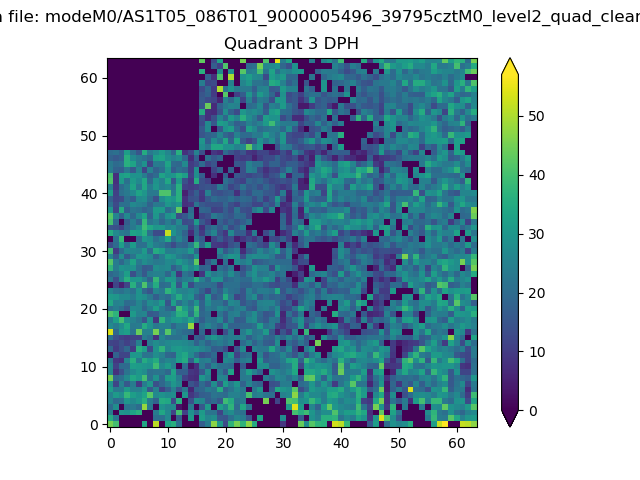 |
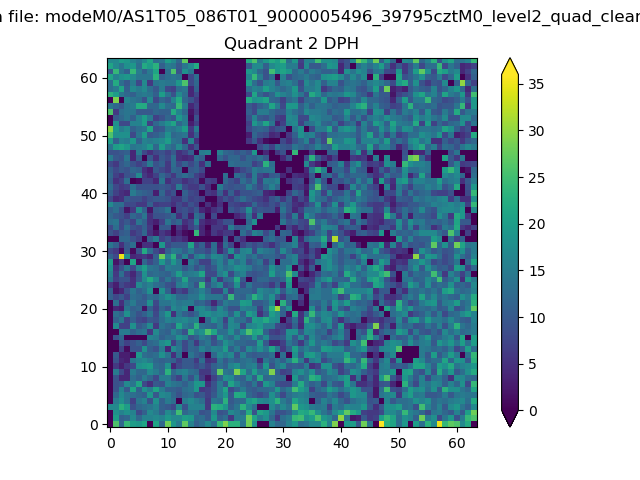 |
Quadrant C |
| Plot type | Count rate plots | Images |
|---|---|---|
| Comparison with Poisson distribution Blue bars denote a histogram of data divided into 1 sec bins. Red curve is a Poisson curve with rate = median count rate of data. |
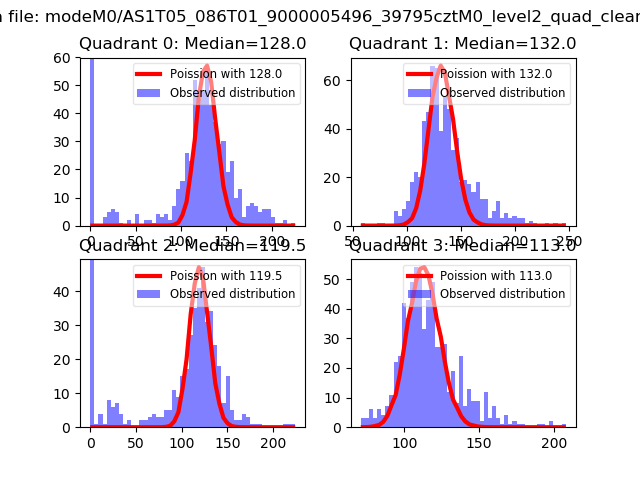 |
 |
| Quadrant-wise count rates Data is divided into 100 sec bins |
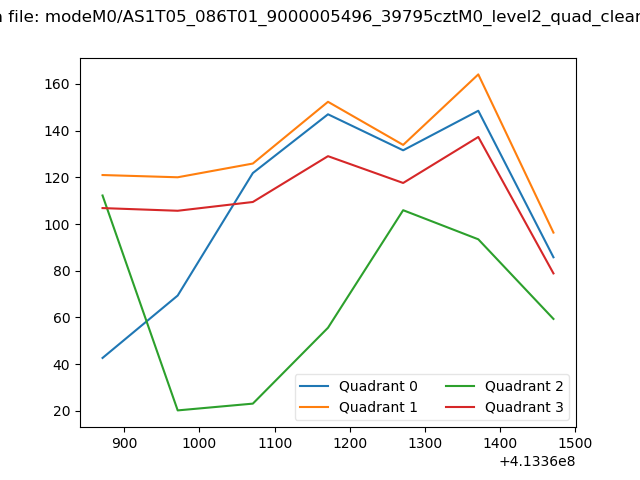 |
|
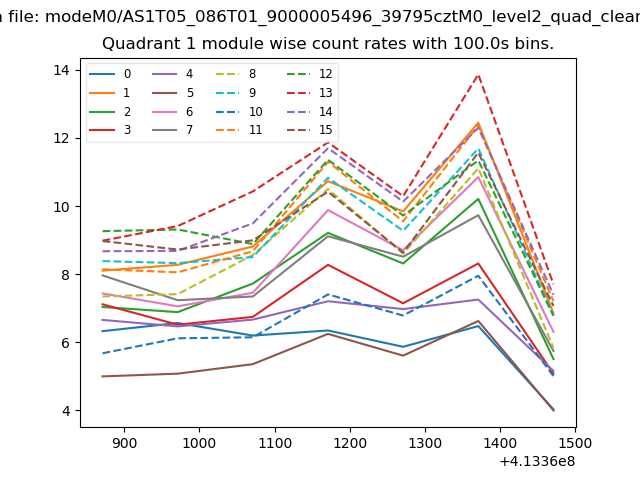
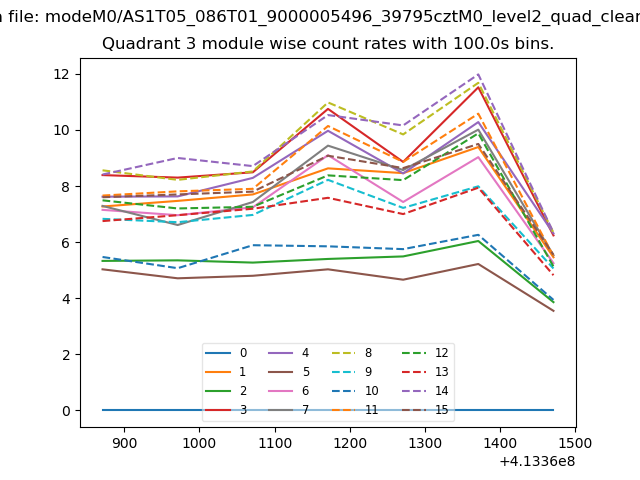
| Module-wise count rates for Quadrant A Data is divided into 100 sec bins |
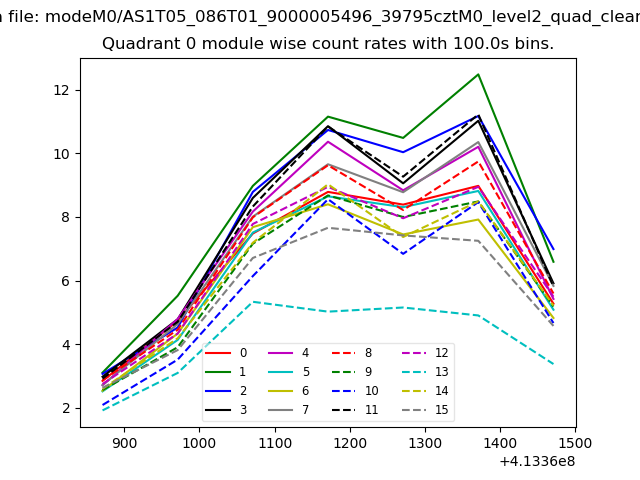 |
 |
| Module-wise count rates for Quadrant B Data is divided into 100 sec bins |
 |
 |
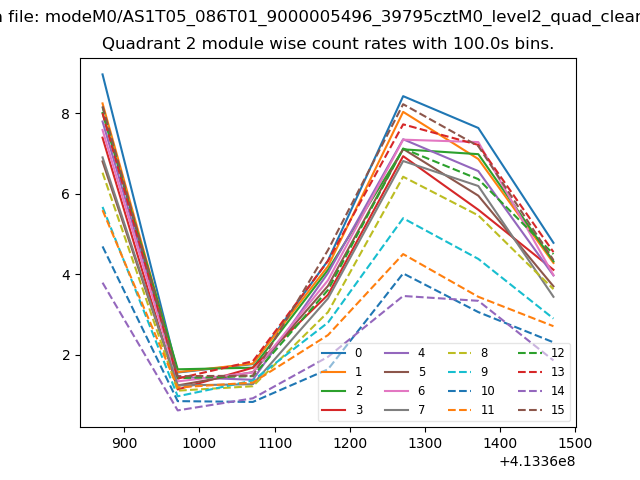
| Module-wise count rates for Quadrant C Data is divided into 100 sec bins |
 |
 |
| Module-wise count rates for Quadrant D Data is divided into 100 sec bins |
 |
 |
| Parameter | Plot |
|---|---|
| CZT HV Monitor | 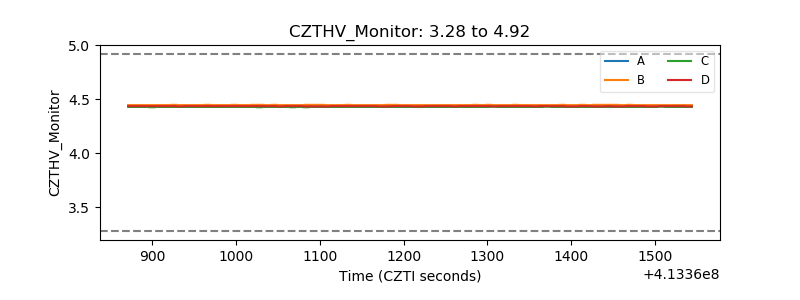 |
| D_VDD | 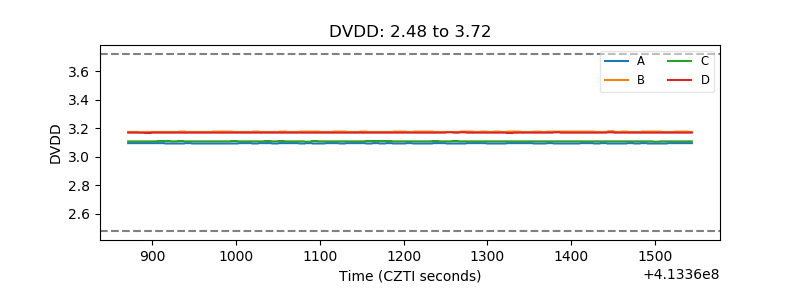 |
| Temperature 1 | 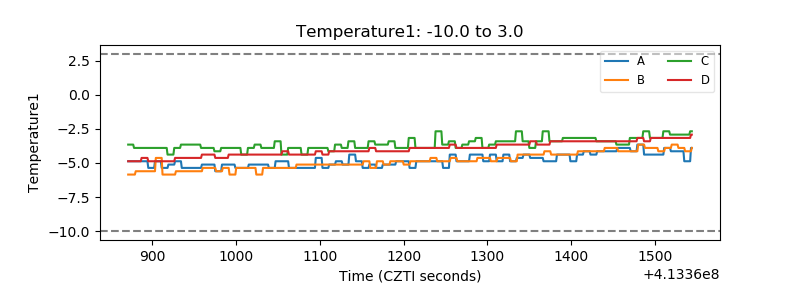 |
| Veto HV Monitor | 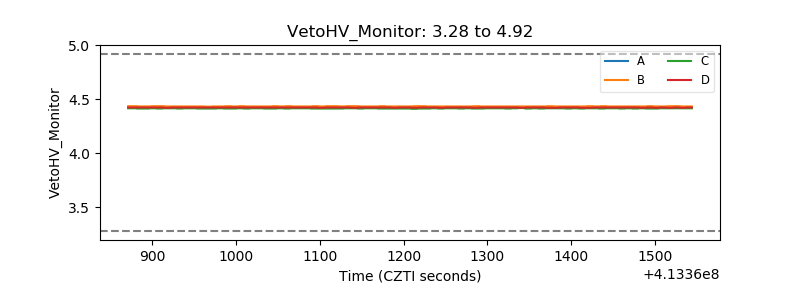 |
| Veto LLD | 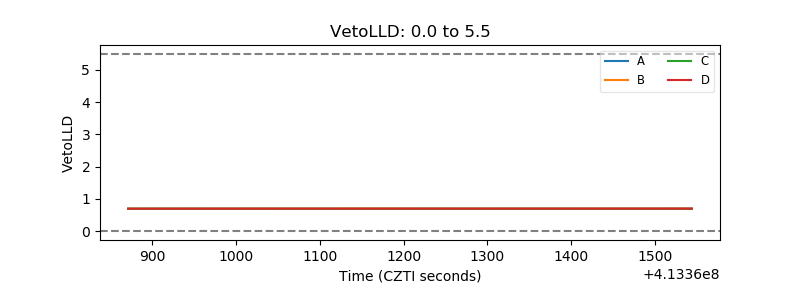 |
| Alpha Counter | 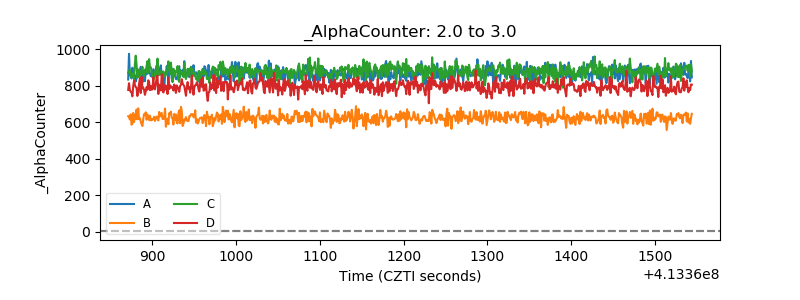 |
| _CPM_Rate | 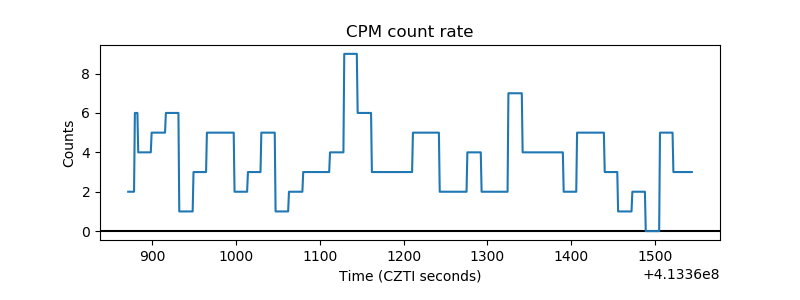 |
| CZT Counter | 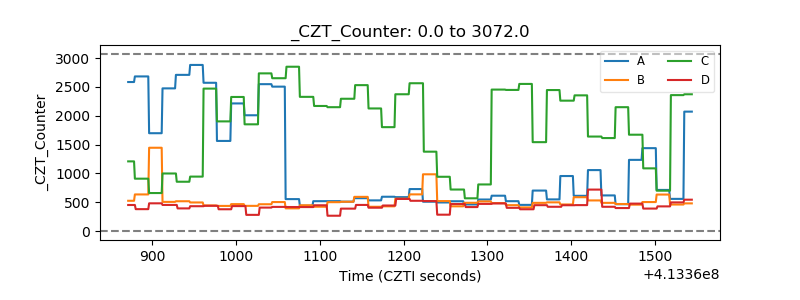 |
| +2.5 Volts monitor | 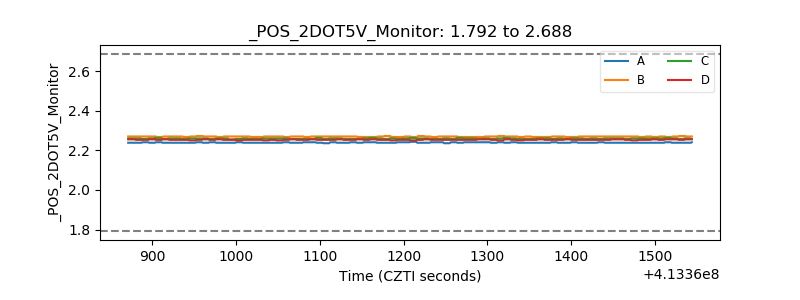 |
| +5 Volts monitor | 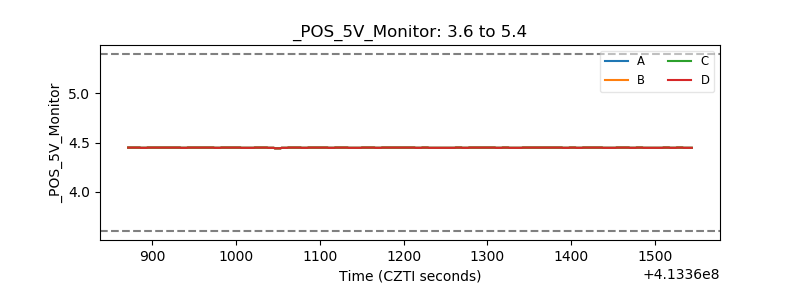 |
| _ROLL_ROT | 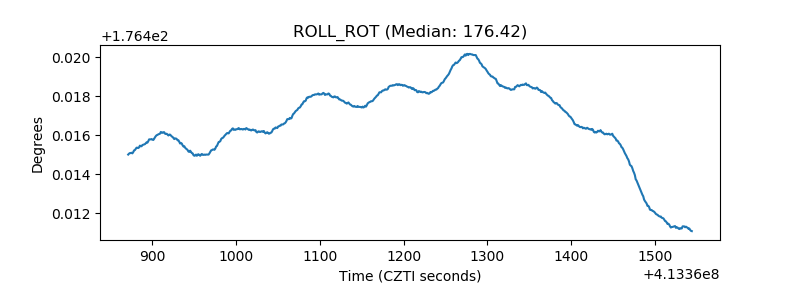 |
| _Roll_DEC | 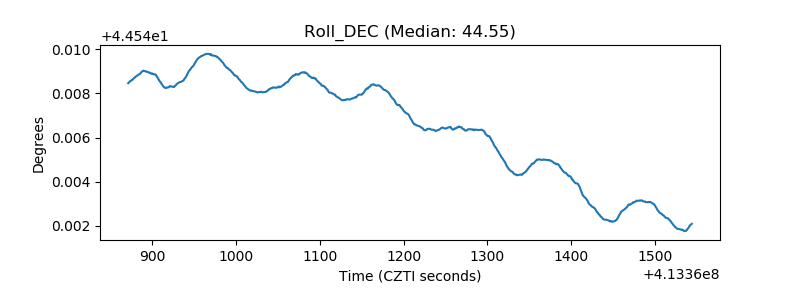 |
| _Roll_RA | 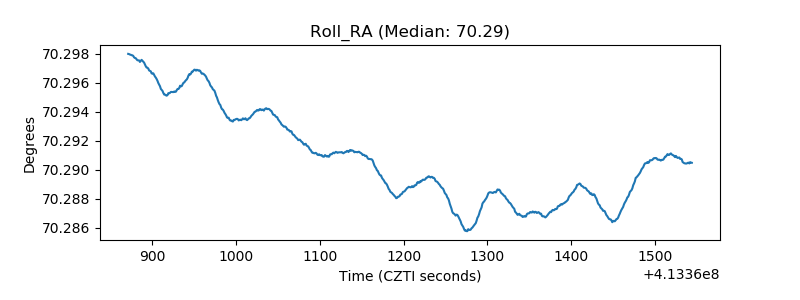 |
| Veto Counter | 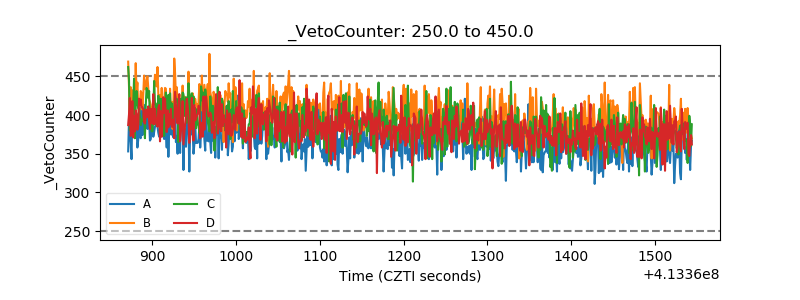 |