| Param | Original file | Final file |
|---|---|---|
| Filename | modeM0/AS1A12_022T01_9000005498_39793cztM0_level2.fits | modeM0/AS1A12_022T01_9000005498_39793cztM0_level2_quad_clean.evt |
| Size (bytes) | 557,078,400 | 83,278,080 |
| Size | 531.3 MB | 79.4 MB |
| Events in quadrant A | 3,828,327 | 630,322 |
| Events in quadrant B | 2,723,814 | 652,432 |
| Events in quadrant C | 9,183,547 | 345,911 |
| Events in quadrant D | 4,489,777 | 535,399 |
| Mode M0 | |||
|---|---|---|---|
| Quadrant | BADHDUFLAG | Total packets | Discarded packets |
| A | 0 | 14677 | 4 |
| B | 0 | 11229 | 1 |
| C | 0 | 30793 | 1 |
| D | 0 | 16646 | 5 |
| Mode M9 | |||
|---|---|---|---|
| Quadrant | BADHDUFLAG | Total packets | Discarded packets |
| A | 0 | 26 | 0 |
| B | 0 | 26 | 0 |
| C | 0 | 26 | 0 |
| D | 0 | 27 | 0 |
| Mode SS | |||
|---|---|---|---|
| Quadrant | BADHDUFLAG | Total packets | Discarded packets |
| A | 0 | 104 | 0 |
| B | 0 | 104 | 0 |
| C | 0 | 104 | 0 |
| D | 0 | 104 | 0 |
| Quadrant | Total seconds | Saturated seconds | Saturation percentage |
|---|---|---|---|
| A | 5100 | 230 | 4.509804% |
| B | 5101 | 44 | 0.862576% |
| C | 5101 | 2530 | 49.598118% |
| D | 5098 | 438 | 8.591605% |
Noise dominated data is calculated using 1-second bins in cleaned event files. If a bin has >2000 counts, and if more than 50% of those come from <1% of pixels, then it is considered to be noise-dominated and hence unusable.
| Quadrant | # 1 sec bins | Bins with >0 counts | Bins with >2000 counts | High rate bins dominated by noise | Noise dominated (total time) | Noise dominated (detector-on time) | Marked lightcurve |
|---|---|---|---|---|---|---|---|
| A | 7074 | 5102 | 160 | 160 | 2.26% | 3.14% | 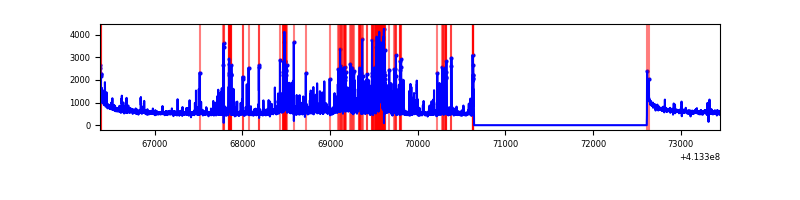 |
| B | 7074 | 5102 | 27 | 27 | 0.38% | 0.53% | 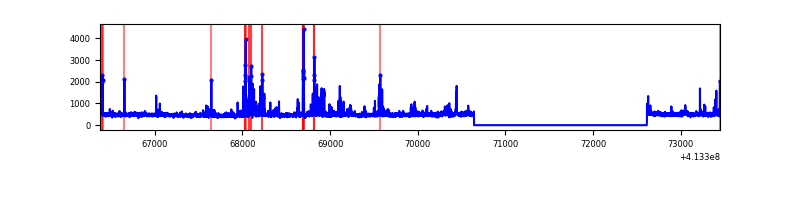 |
| C | 7074 | 5102 | 2248 | 2248 | 31.78% | 44.06% | 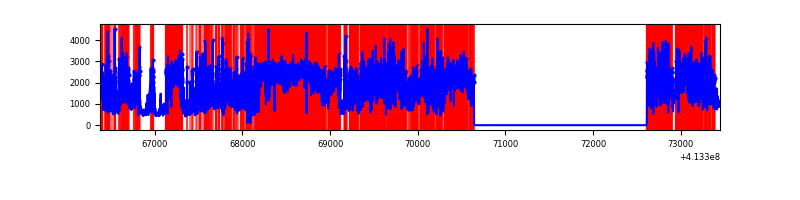 |
| D | 7074 | 5101 | 308 | 308 | 4.35% | 6.04% | 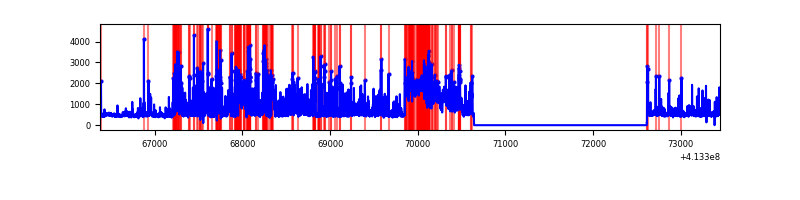 |
Top three noisy pixels from each quadrant. If the there are fewer than three noisy pixels in the level2.evt file, extra rows are filled as -1
| Pixel properties | Quadrant properties | ||||||
|---|---|---|---|---|---|---|---|
| Quadrant | DetID | PixID | Counts | Sigma | Mean | Median | Sigma |
| A | 9 | 143 | 543828 | 4491.45 | 596 | 584 | 121.0 |
| A | 10 | 83 | 439929 | 3632.43 | 596 | 584 | 121.0 |
| A | 13 | 248 | 374402 | 3090.67 | 596 | 584 | 121.0 |
| B | 5 | 255 | 199124 | 1754.81 | 593 | 579 | 113.1 |
| B | 5 | 172 | 50967 | 445.35 | 593 | 579 | 113.1 |
| B | 15 | 85 | 43160 | 376.35 | 593 | 579 | 113.1 |
| C | 9 | 187 | 6255031 | 57133.87 | 471 | 474 | 109.5 |
| C | 15 | 208 | 850836 | 7767.85 | 471 | 474 | 109.5 |
| C | 15 | 214 | 181336 | 1652.13 | 471 | 474 | 109.5 |
| D | 12 | 227 | 1025263 | 7398.37 | 569 | 553 | 138.5 |
| D | 7 | 38 | 541863 | 3908.24 | 569 | 553 | 138.5 |
| D | 2 | 249 | 271284 | 1954.67 | 569 | 553 | 138.5 |
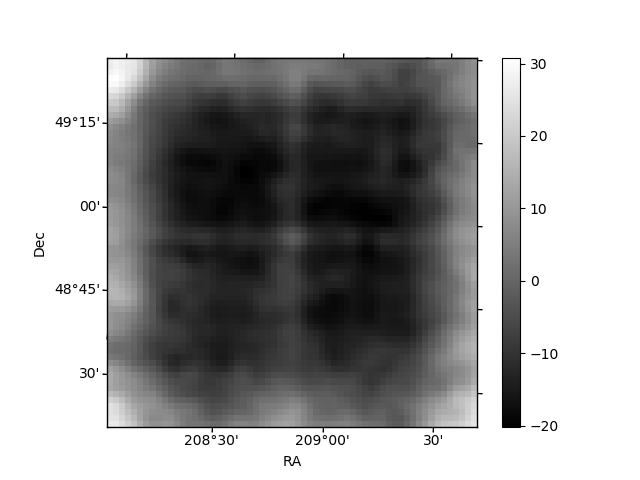
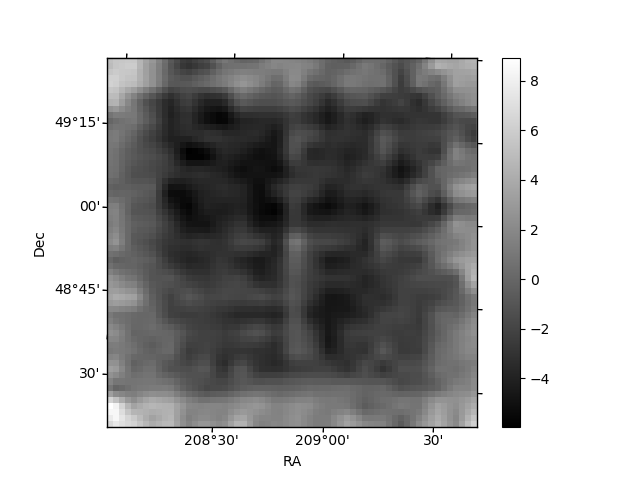
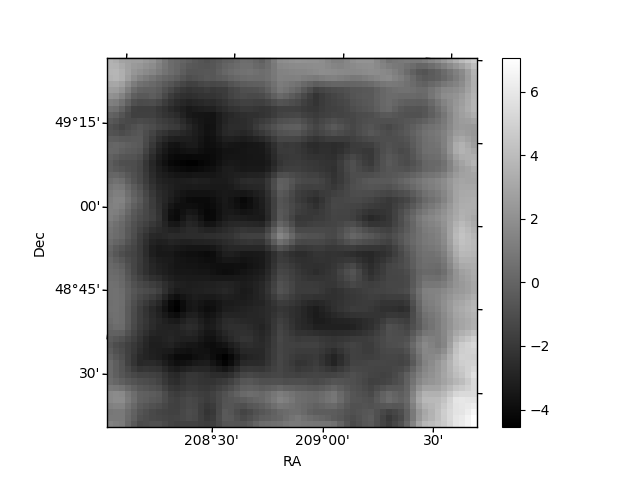
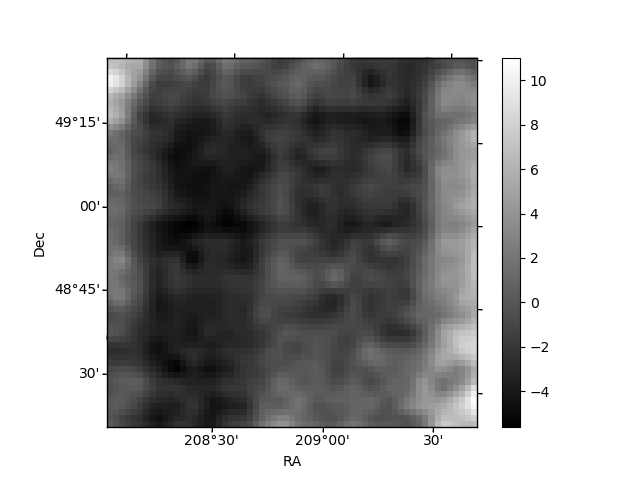
Histogram calculated using DETX and DETY for each event in the final _common_clean file
| Quadrant A | 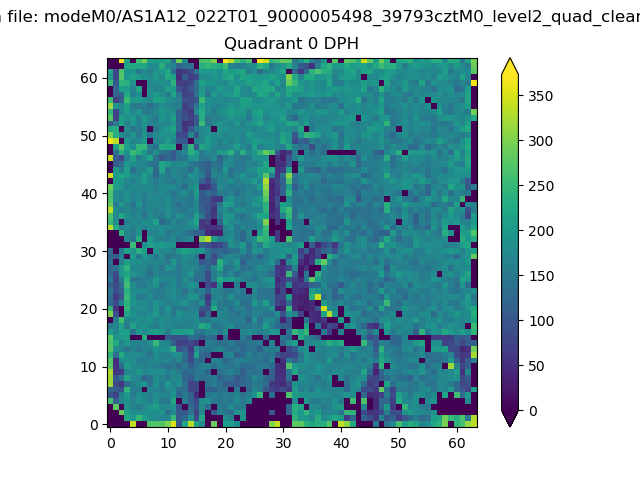 |
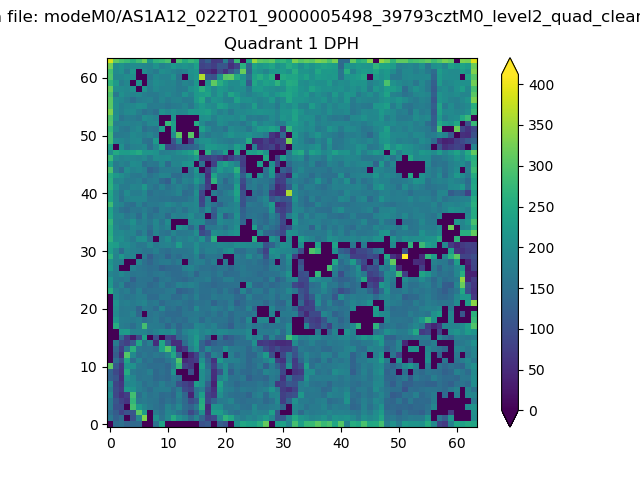 |
Quadrant B |
|---|---|---|---|
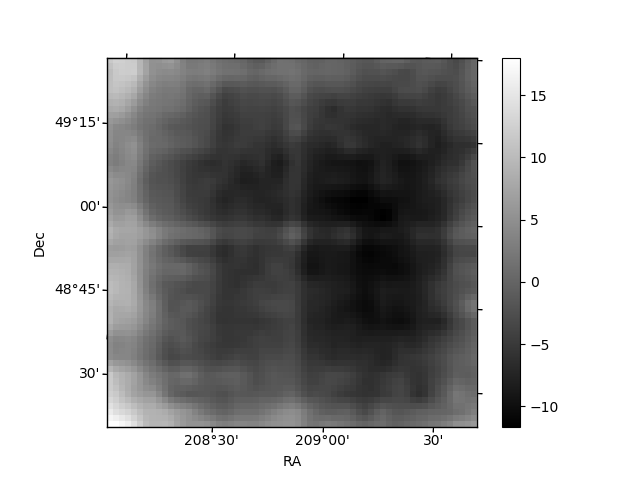
| Quadrant D | 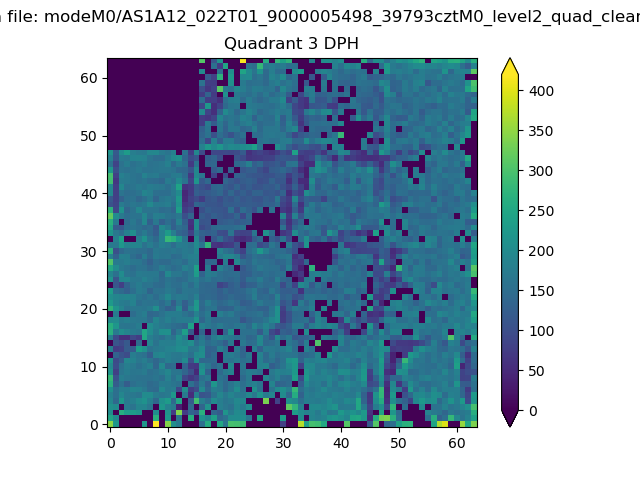 |
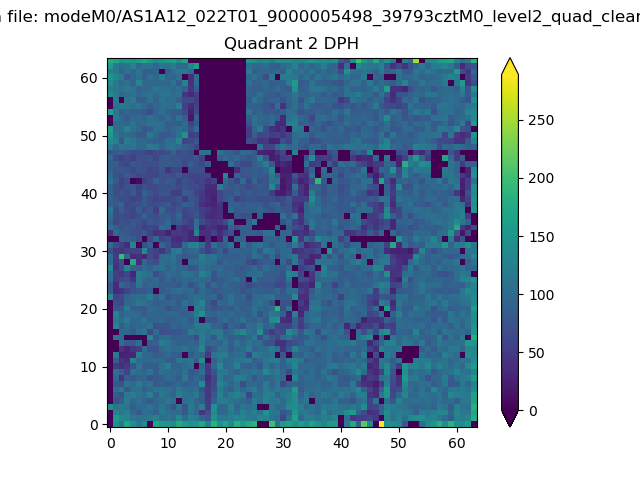 |
Quadrant C |
| Plot type | Count rate plots | Images |
|---|---|---|
| Comparison with Poisson distribution Blue bars denote a histogram of data divided into 1 sec bins. Red curve is a Poisson curve with rate = median count rate of data. |
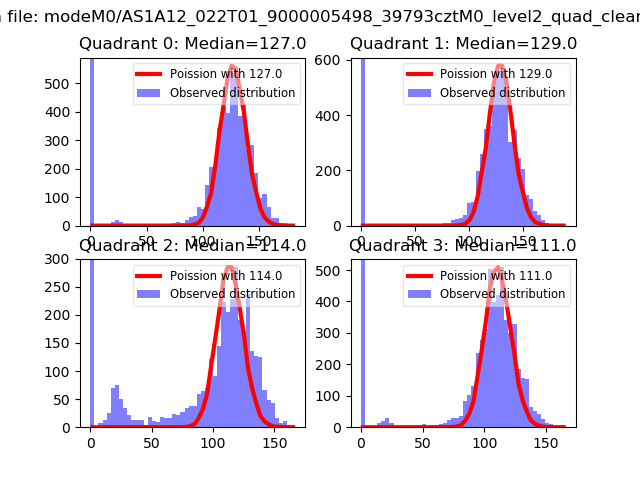 |
 |
| Quadrant-wise count rates Data is divided into 100 sec bins |
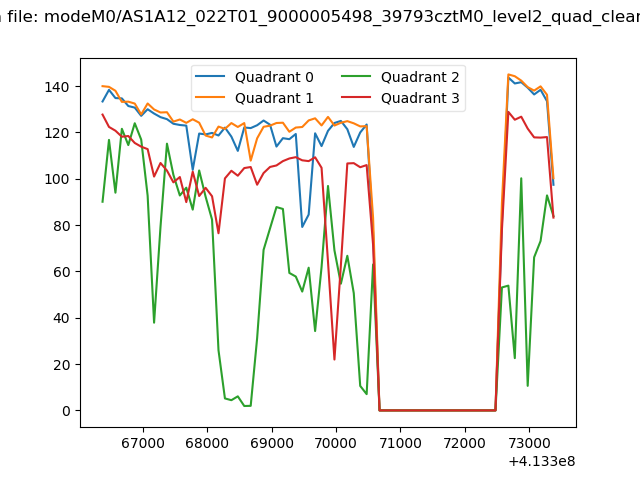 |
|
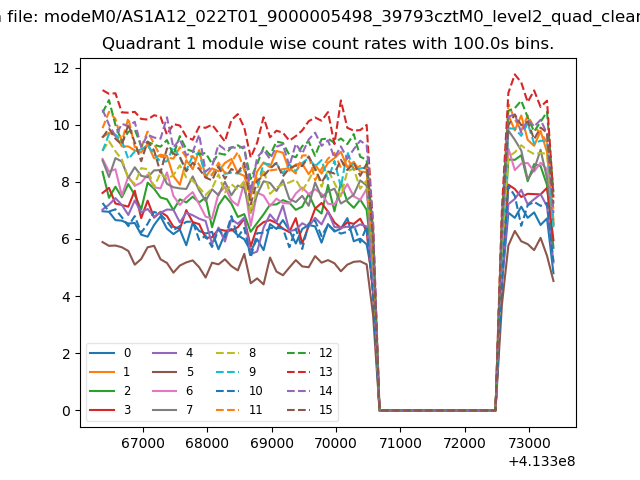
| Module-wise count rates for Quadrant A Data is divided into 100 sec bins |
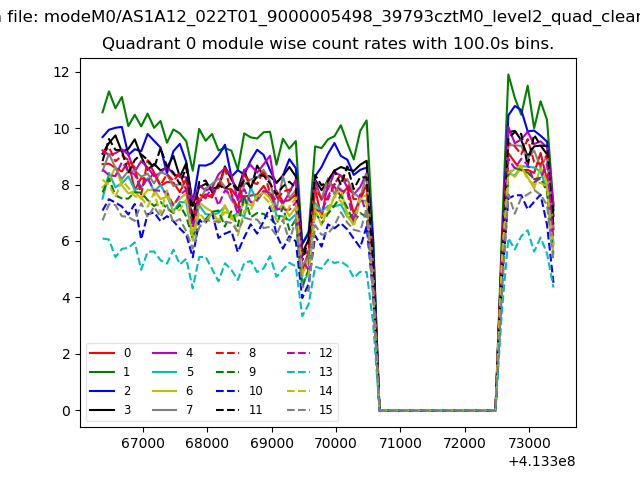 |
 |
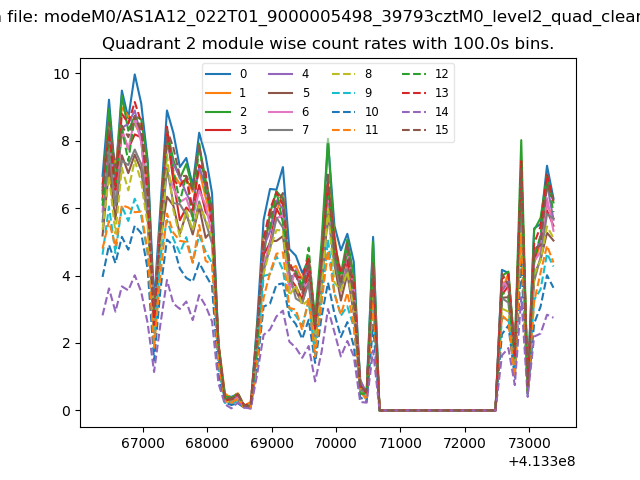
| Module-wise count rates for Quadrant B Data is divided into 100 sec bins |
 |
 |
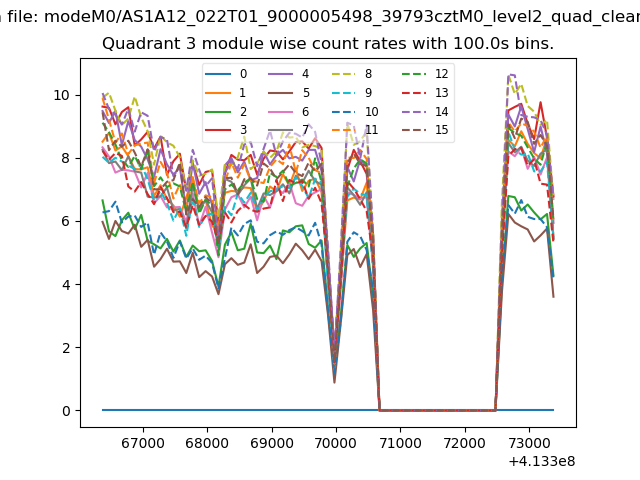
| Module-wise count rates for Quadrant C Data is divided into 100 sec bins |
 |
 |
| Module-wise count rates for Quadrant D Data is divided into 100 sec bins |
 |
 |
| Parameter | Plot |
|---|---|
| CZT HV Monitor | 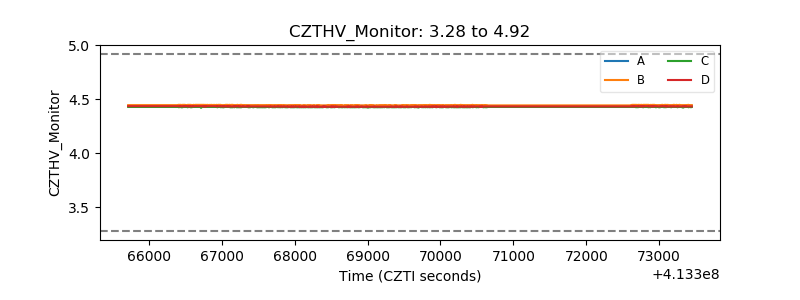 |
| D_VDD | 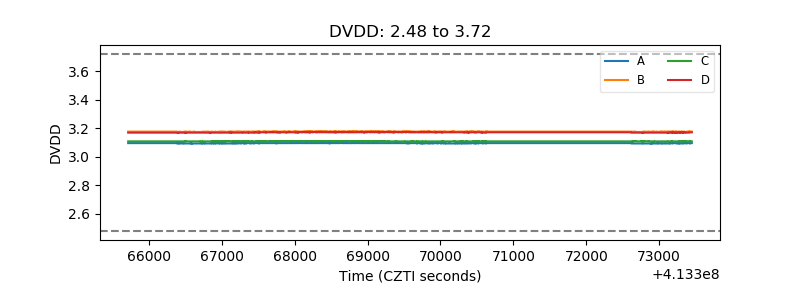 |
| Temperature 1 | 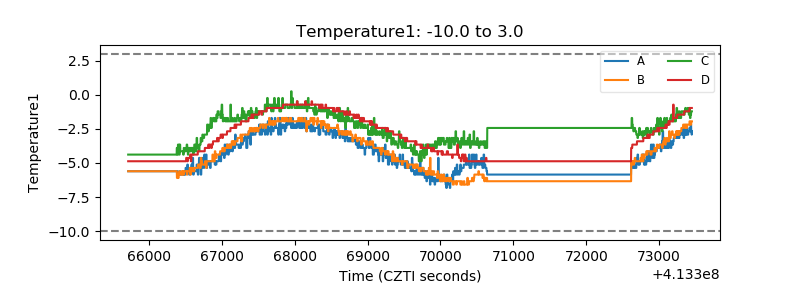 |
| Veto HV Monitor | 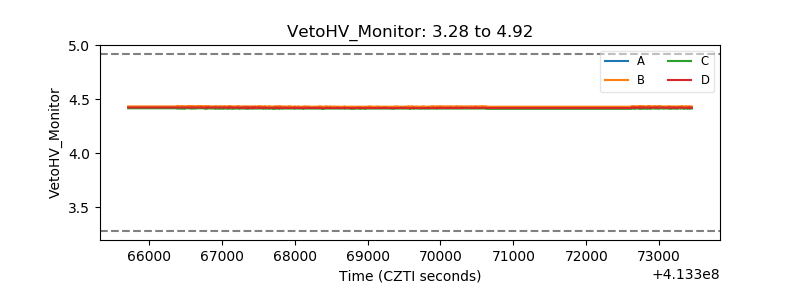 |
| Veto LLD | 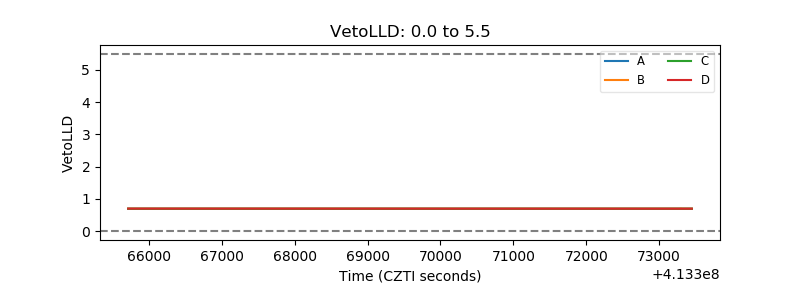 |
| Alpha Counter | 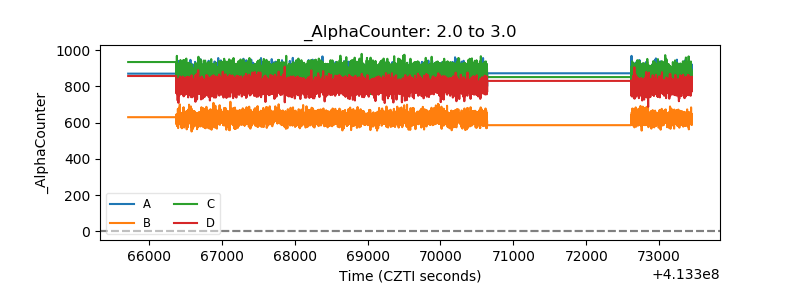 |
| _CPM_Rate | 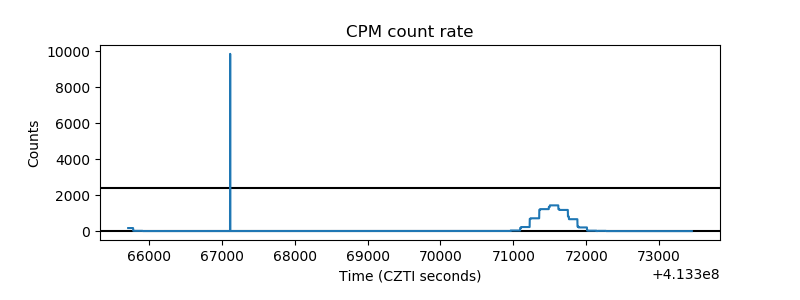 |
| CZT Counter | 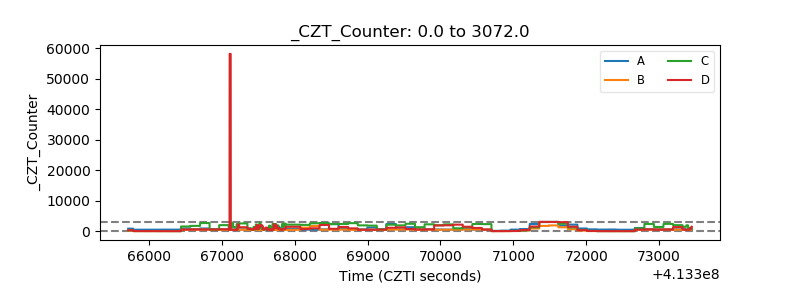 |
| +2.5 Volts monitor | 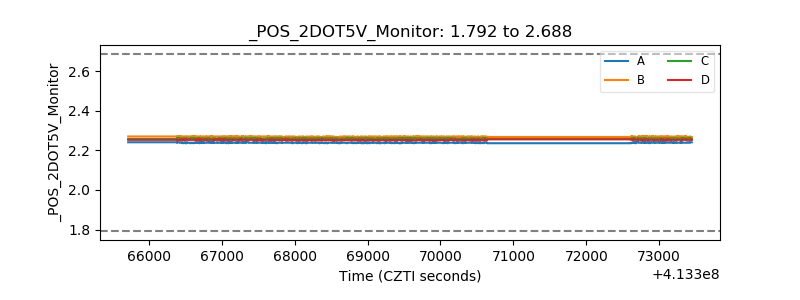 |
| +5 Volts monitor | 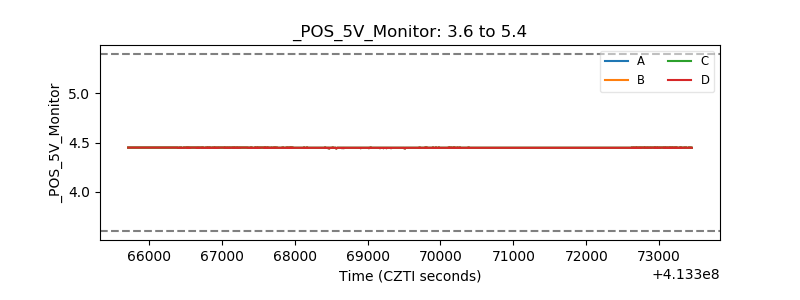 |
| _ROLL_ROT | 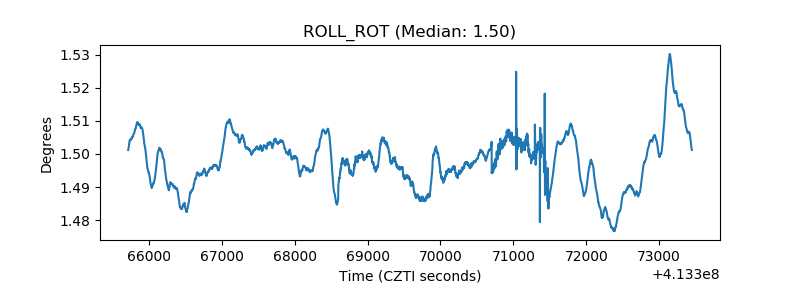 |
| _Roll_DEC | 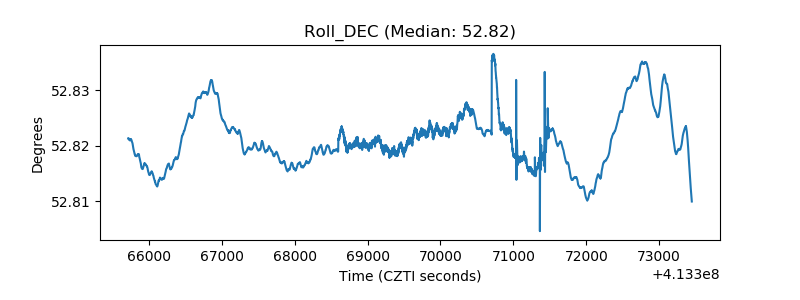 |
| _Roll_RA | 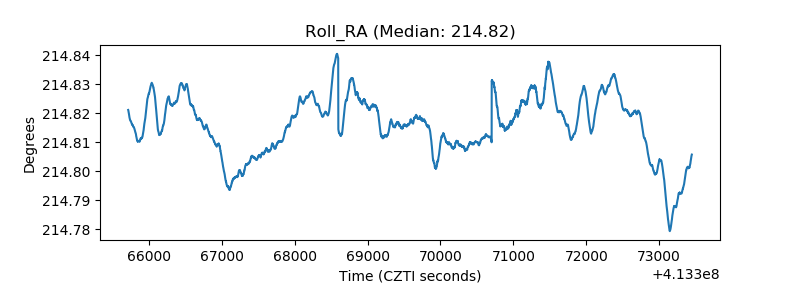 |
| Veto Counter | 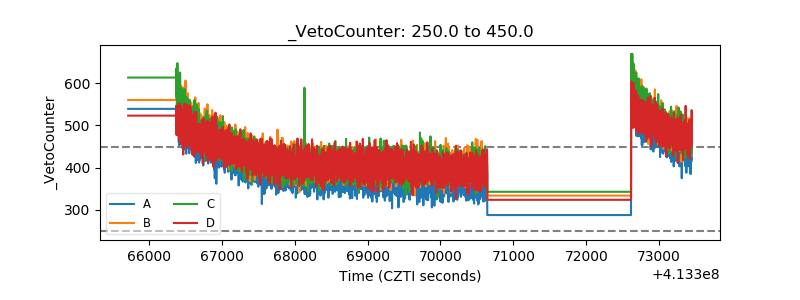 |