| Param | Original file | Final file |
|---|---|---|
| Filename | modeM0/AS1A12_022T01_9000005498_39794cztM0_level2.fits | modeM0/AS1A12_022T01_9000005498_39794cztM0_level2_quad_clean.evt |
| Size (bytes) | 584,830,080 | 86,613,120 |
| Size | 557.7 MB | 82.6 MB |
| Events in quadrant A | 4,141,609 | 664,257 |
| Events in quadrant B | 3,249,689 | 684,120 |
| Events in quadrant C | 10,044,535 | 307,002 |
| Events in quadrant D | 3,796,357 | 591,618 |
| Mode M0 | |||
|---|---|---|---|
| Quadrant | BADHDUFLAG | Total packets | Discarded packets |
| A | 0 | 19894 | 4115 |
| B | 0 | 16230 | 3256 |
| C | 0 | 43038 | 9556 |
| D | 0 | 19055 | 4331 |
| Mode M9 | |||
|---|---|---|---|
| Quadrant | BADHDUFLAG | Total packets | Discarded packets |
| A | 0 | 41 | 11 |
| B | 0 | 44 | 16 |
| C | 0 | 42 | 13 |
| D | 0 | 43 | 16 |
| Mode SS | |||
|---|---|---|---|
| Quadrant | BADHDUFLAG | Total packets | Discarded packets |
| A | 0 | 145 | 33 |
| B | 0 | 144 | 32 |
| C | 0 | 145 | 39 |
| D | 0 | 143 | 31 |
| Quadrant | Total seconds | Saturated seconds | Saturation percentage |
|---|---|---|---|
| A | 5395 | 340 | 6.302132% |
| B | 5397 | 165 | 3.057254% |
| C | 5288 | 3034 | 57.375189% |
| D | 5369 | 178 | 3.315329% |
Noise dominated data is calculated using 1-second bins in cleaned event files. If a bin has >2000 counts, and if more than 50% of those come from <1% of pixels, then it is considered to be noise-dominated and hence unusable.
| Quadrant | # 1 sec bins | Bins with >0 counts | Bins with >2000 counts | High rate bins dominated by noise | Noise dominated (total time) | Noise dominated (detector-on time) | Marked lightcurve |
|---|---|---|---|---|---|---|---|
| A | 16486 | 5487 | 262 | 262 | 1.59% | 4.77% | 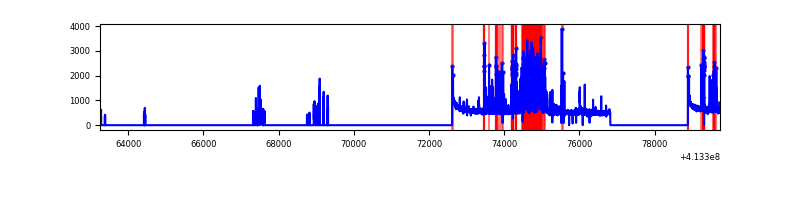 |
| B | 16481 | 5507 | 107 | 107 | 0.65% | 1.94% | 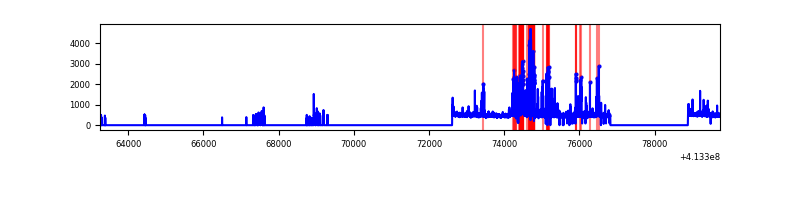 |
| C | 16479 | 5392 | 2488 | 2488 | 15.10% | 46.14% | 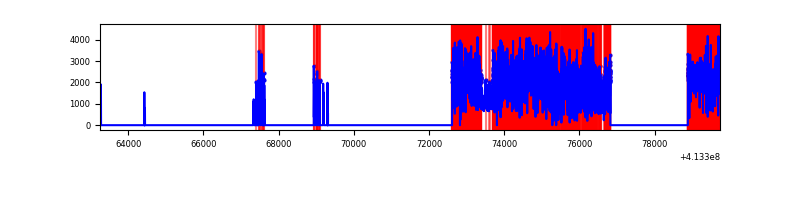 |
| D | 16488 | 5470 | 150 | 150 | 0.91% | 2.74% | 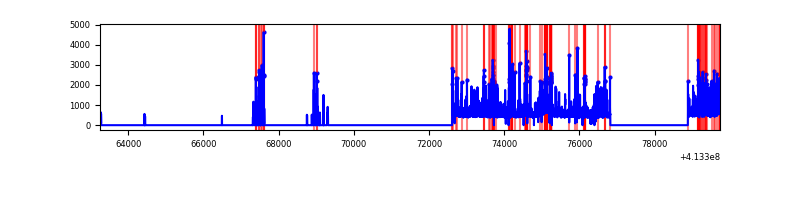 |
Top three noisy pixels from each quadrant. If the there are fewer than three noisy pixels in the level2.evt file, extra rows are filled as -1
| Pixel properties | Quadrant properties | ||||||
|---|---|---|---|---|---|---|---|
| Quadrant | DetID | PixID | Counts | Sigma | Mean | Median | Sigma |
| A | 13 | 248 | 776256 | 6060.28 | 639 | 627 | 128.0 |
| A | 10 | 83 | 463636 | 3617.66 | 639 | 627 | 128.0 |
| A | 9 | 143 | 338915 | 2643.17 | 639 | 627 | 128.0 |
| B | 5 | 255 | 560873 | 4694.73 | 630 | 613 | 119.3 |
| B | 4 | 171 | 94709 | 788.48 | 630 | 613 | 119.3 |
| B | 0 | 186 | 42256 | 348.95 | 630 | 613 | 119.3 |
| C | 9 | 187 | 7350925 | 67980.7 | 467 | 469 | 108.1 |
| C | 15 | 208 | 658368 | 6084.58 | 467 | 469 | 108.1 |
| C | 15 | 214 | 175804 | 1621.59 | 467 | 469 | 108.1 |
| D | 13 | 249 | 452433 | 3023.77 | 618 | 603 | 149.4 |
| D | 12 | 227 | 429720 | 2871.77 | 618 | 603 | 149.4 |
| D | 2 | 249 | 209237 | 1396.23 | 618 | 603 | 149.4 |
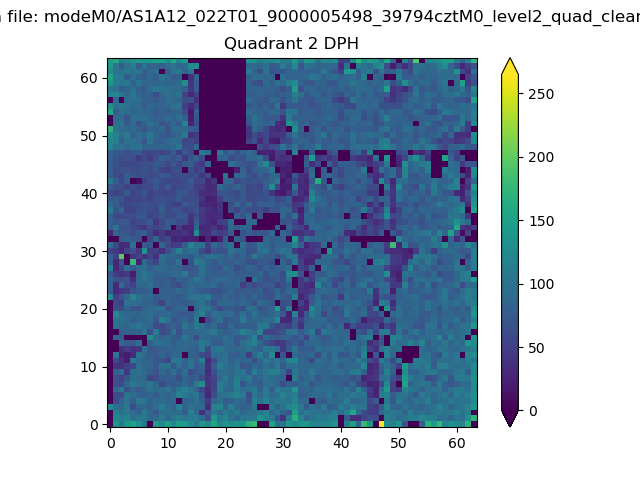
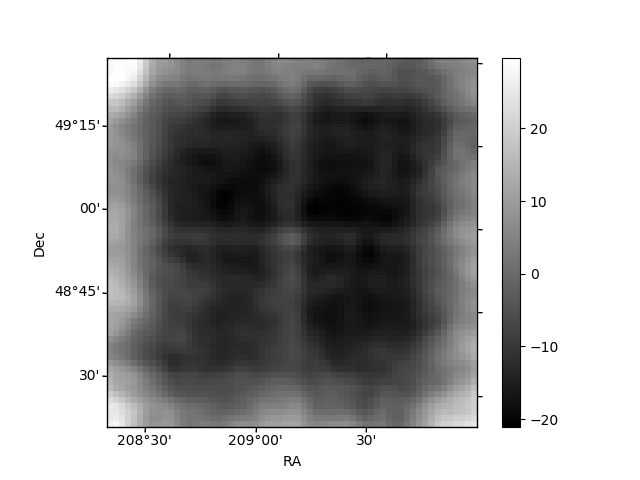
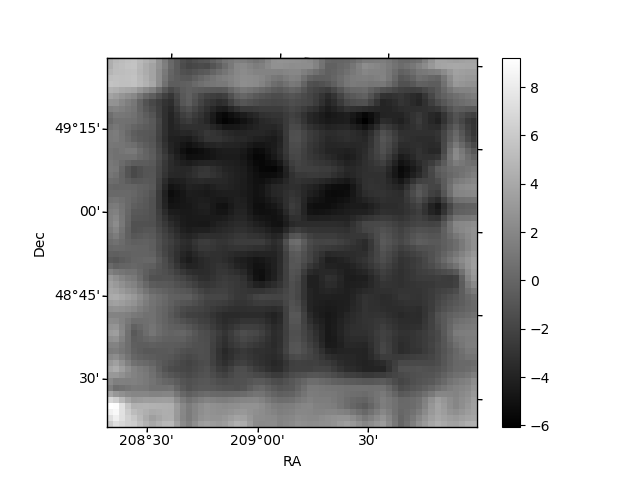
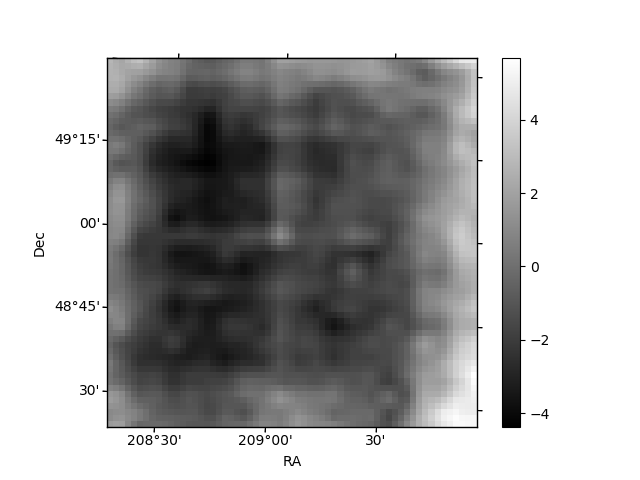
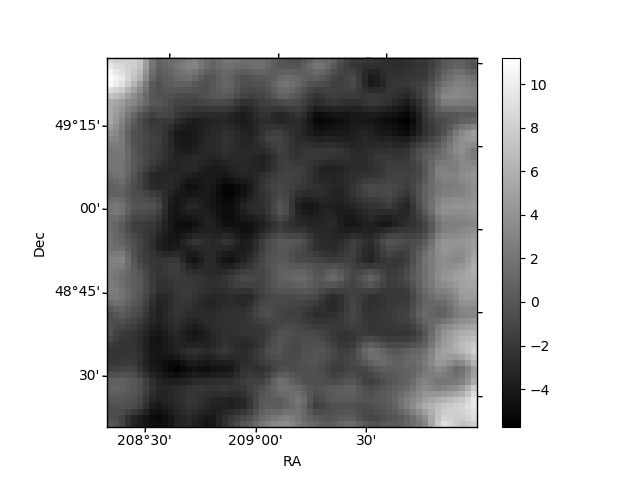
Histogram calculated using DETX and DETY for each event in the final _common_clean file
| Quadrant A | 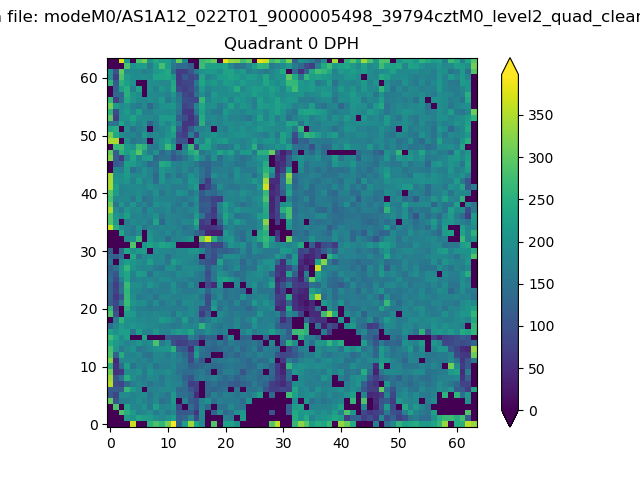 |
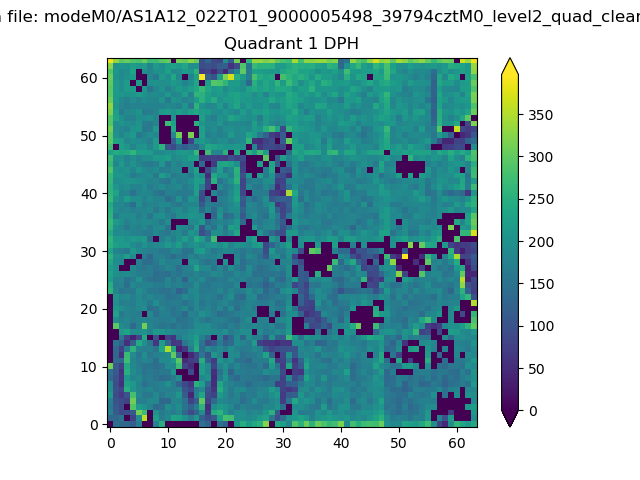 |
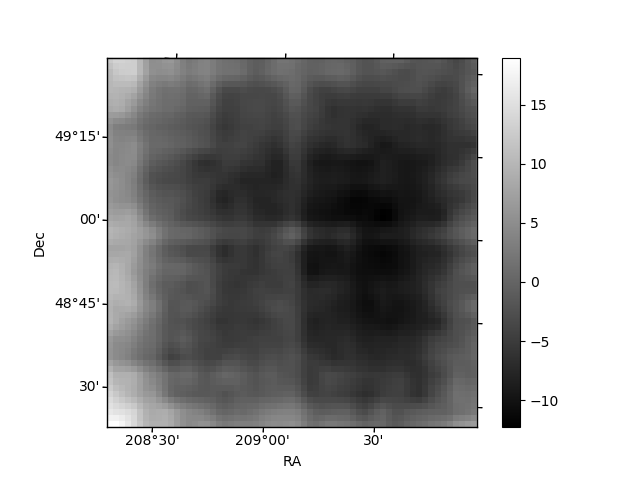
Quadrant B |
|---|---|---|---|
| Quadrant D | 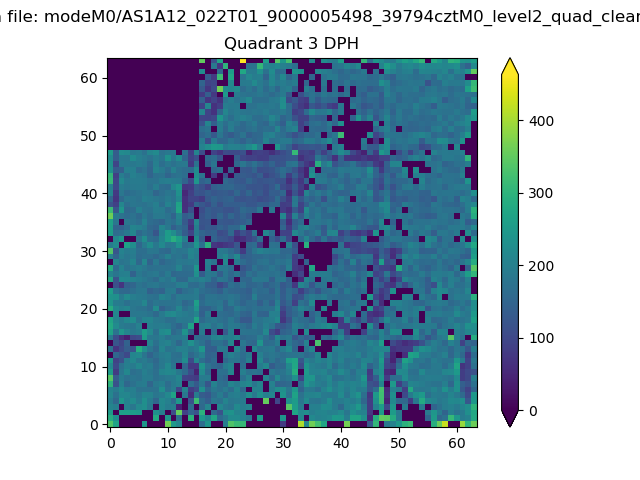 |
 |
Quadrant C |
| Plot type | Count rate plots | Images |
|---|---|---|
| Comparison with Poisson distribution Blue bars denote a histogram of data divided into 1 sec bins. Red curve is a Poisson curve with rate = median count rate of data. |
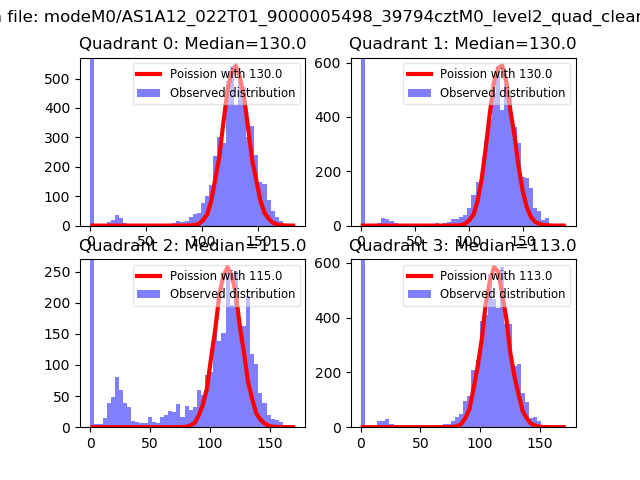 |
 |
| Quadrant-wise count rates Data is divided into 100 sec bins |
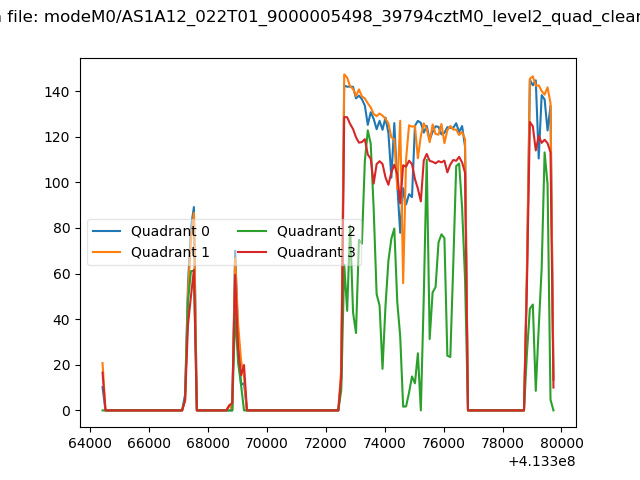 |
|
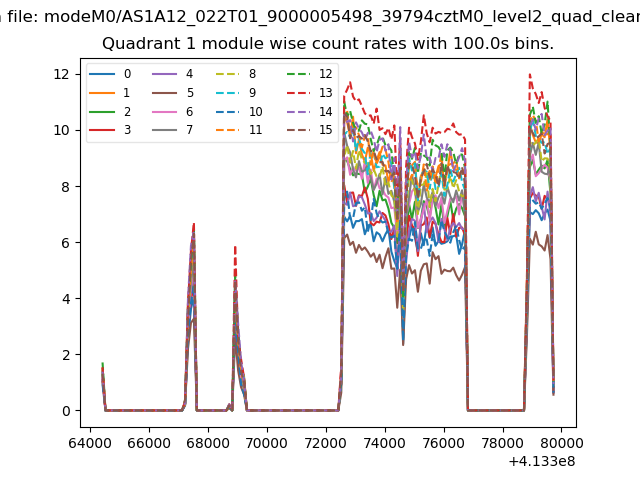
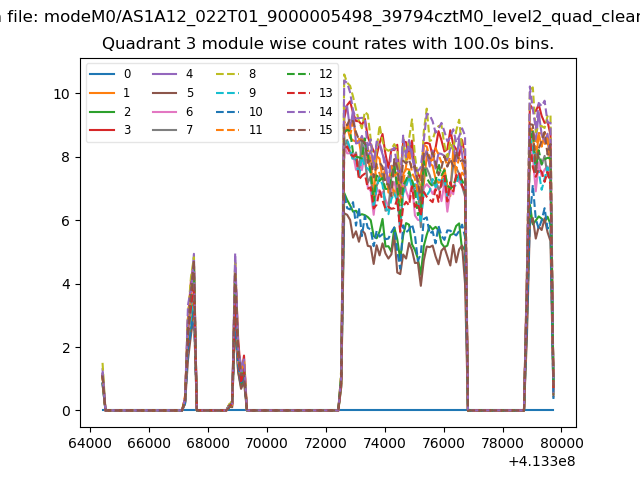
| Module-wise count rates for Quadrant A Data is divided into 100 sec bins |
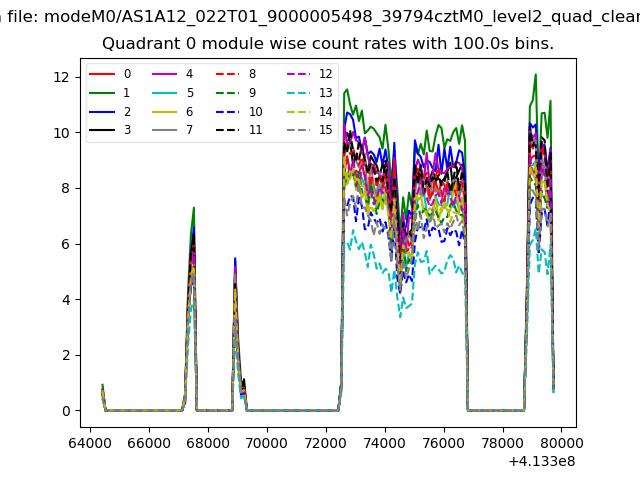 |
 |
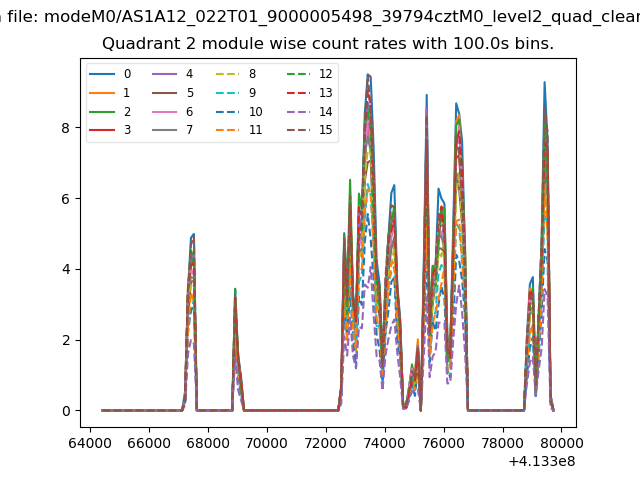
| Module-wise count rates for Quadrant B Data is divided into 100 sec bins |
 |
 |
| Module-wise count rates for Quadrant C Data is divided into 100 sec bins |
 |
 |
| Module-wise count rates for Quadrant D Data is divided into 100 sec bins |
 |
 |
| Parameter | Plot |
|---|---|
| CZT HV Monitor | 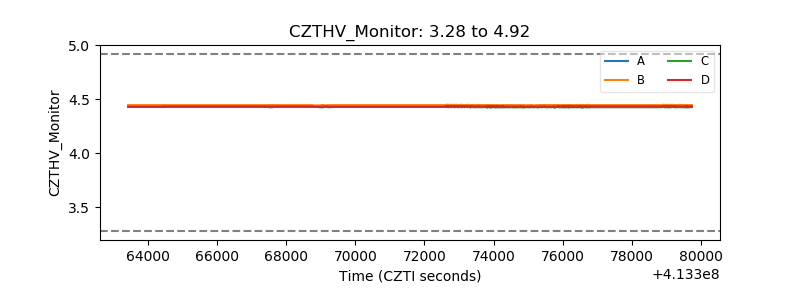 |
| D_VDD | 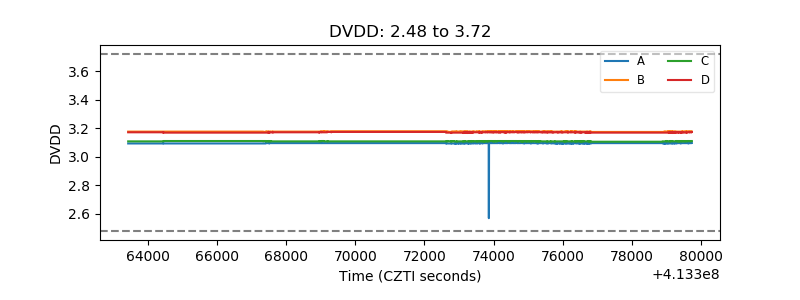 |
| Temperature 1 | 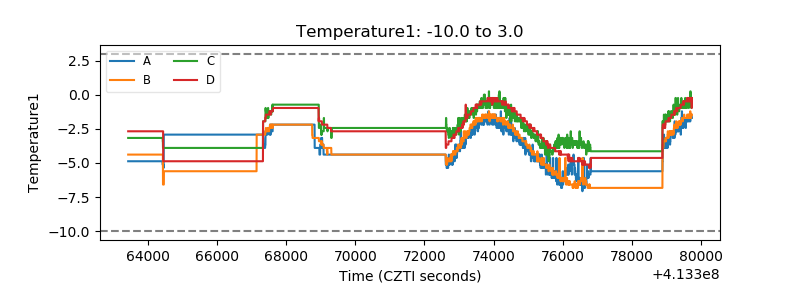 |
| Veto HV Monitor | 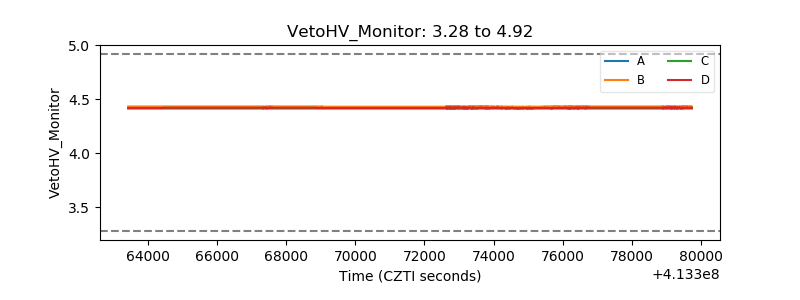 |
| Veto LLD | 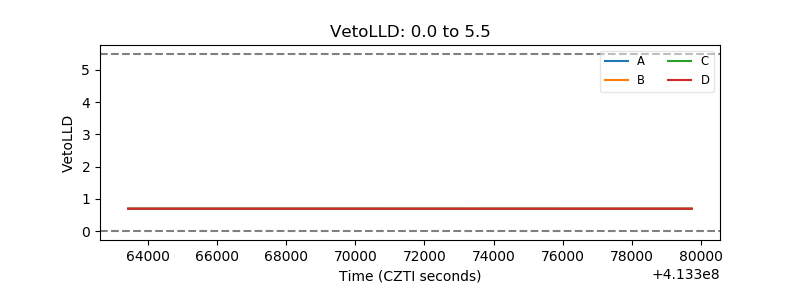 |
| Alpha Counter | 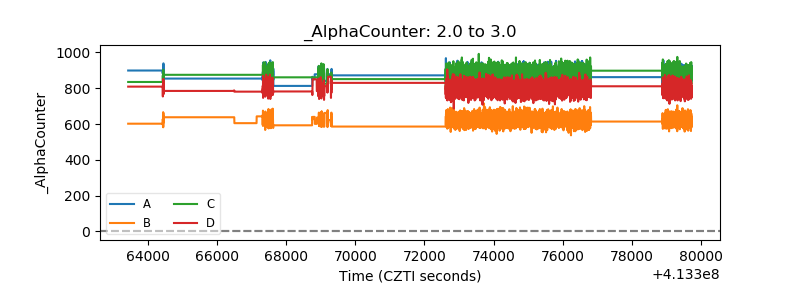 |
| _CPM_Rate | 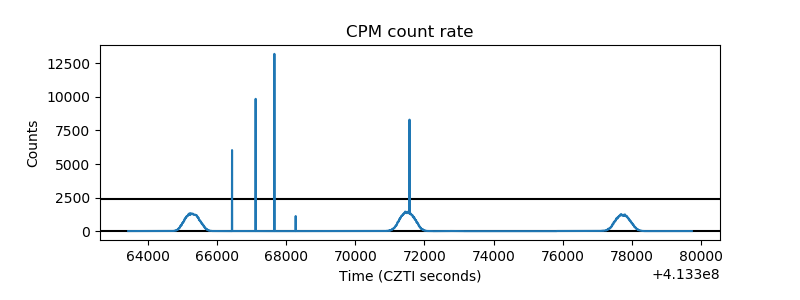 |
| CZT Counter | 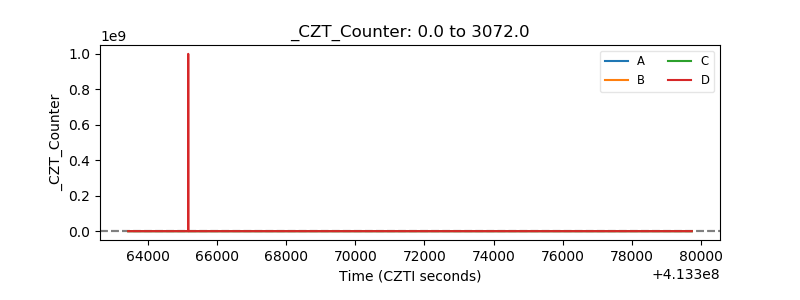 |
| +2.5 Volts monitor |  |
| +5 Volts monitor |  |
| _ROLL_ROT | 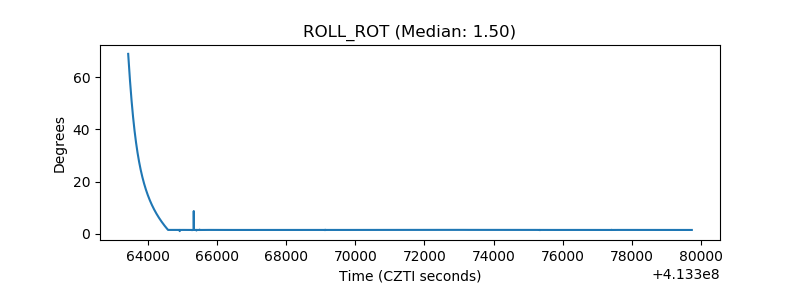 |
| _Roll_DEC | 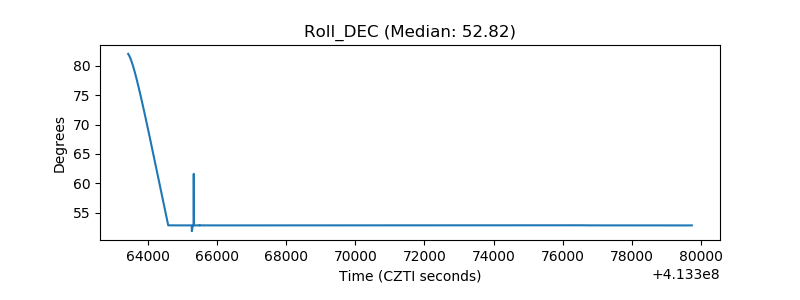 |
| _Roll_RA | 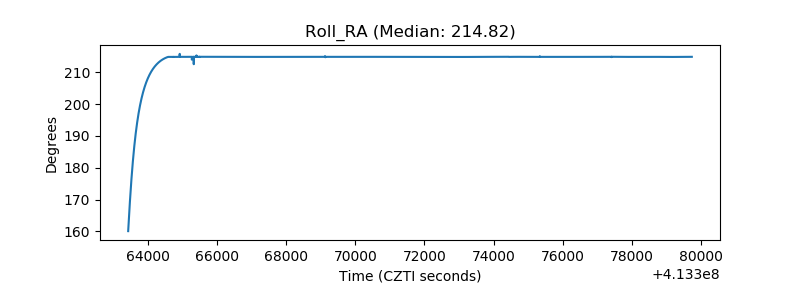 |
| Veto Counter | 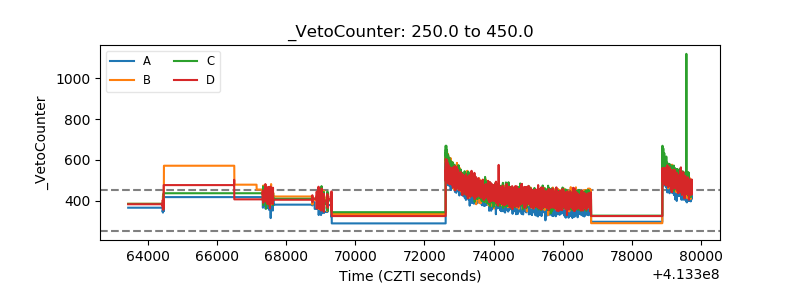 |