| Param | Original file | Final file |
|---|---|---|
| Filename | modeM0/AS1A12_022T01_9000005498_39798cztM0_level2.fits | modeM0/AS1A12_022T01_9000005498_39798cztM0_level2_quad_clean.evt |
| Size (bytes) | 889,220,160 | 138,018,240 |
| Size | 848.0 MB | 131.6 MB |
| Events in quadrant A | 5,286,279 | 1,026,541 |
| Events in quadrant B | 4,930,667 | 1,036,960 |
| Events in quadrant C | 16,295,242 | 595,864 |
| Events in quadrant D | 5,716,370 | 902,890 |
| Mode M0 | |||
|---|---|---|---|
| Quadrant | BADHDUFLAG | Total packets | Discarded packets |
| A | 0 | 21766 | 503 |
| B | 0 | 20966 | 390 |
| C | 0 | 55483 | 924 |
| D | 0 | 23392 | 402 |
| Mode M9 | |||
|---|---|---|---|
| Quadrant | BADHDUFLAG | Total packets | Discarded packets |
| A | 0 | 53 | 3 |
| B | 0 | 53 | 2 |
| C | 0 | 56 | 5 |
| D | 0 | 53 | 2 |
| Mode SS | |||
|---|---|---|---|
| Quadrant | BADHDUFLAG | Total packets | Discarded packets |
| A | 0 | 184 | 2 |
| B | 0 | 185 | 3 |
| C | 0 | 184 | 2 |
| D | 0 | 184 | 2 |
| Quadrant | Total seconds | Saturated seconds | Saturation percentage |
|---|---|---|---|
| A | 8881 | 146 | 1.643959% |
| B | 8883 | 175 | 1.970055% |
| C | 8879 | 4224 | 47.572925% |
| D | 8885 | 297 | 3.342712% |
Noise dominated data is calculated using 1-second bins in cleaned event files. If a bin has >2000 counts, and if more than 50% of those come from <1% of pixels, then it is considered to be noise-dominated and hence unusable.
| Quadrant | # 1 sec bins | Bins with >0 counts | Bins with >2000 counts | High rate bins dominated by noise | Noise dominated (total time) | Noise dominated (detector-on time) | Marked lightcurve |
|---|---|---|---|---|---|---|---|
| A | 18550 | 8894 | 97 | 97 | 0.52% | 1.09% | 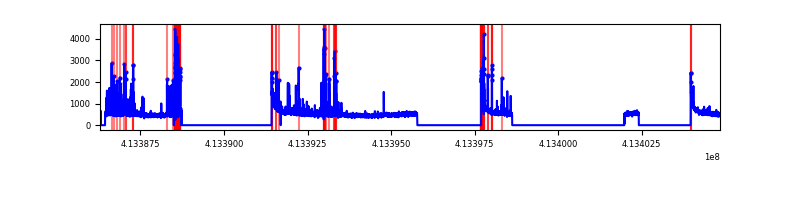 |
| B | 18551 | 8895 | 122 | 122 | 0.66% | 1.37% | 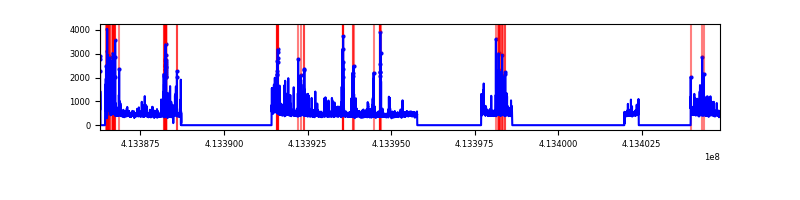 |
| C | 18551 | 8894 | 3887 | 3887 | 20.95% | 43.70% | 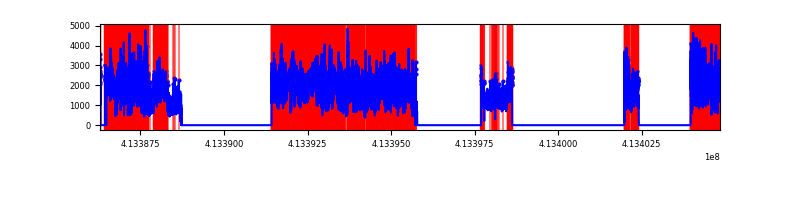 |
| D | 18551 | 8900 | 277 | 277 | 1.49% | 3.11% | 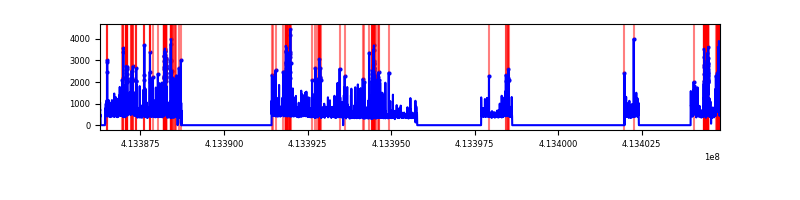 |
Top three noisy pixels from each quadrant. If the there are fewer than three noisy pixels in the level2.evt file, extra rows are filled as -1
| Pixel properties | Quadrant properties | ||||||
|---|---|---|---|---|---|---|---|
| Quadrant | DetID | PixID | Counts | Sigma | Mean | Median | Sigma |
| A | 10 | 83 | 770732 | 3830.3 | 984 | 965 | 201.0 |
| A | 9 | 143 | 467329 | 2320.59 | 984 | 965 | 201.0 |
| A | 13 | 248 | 201486 | 997.78 | 984 | 965 | 201.0 |
| B | 4 | 171 | 418142 | 2232.26 | 979 | 951 | 186.9 |
| B | 5 | 255 | 215629 | 1148.67 | 979 | 951 | 186.9 |
| B | 4 | 170 | 204011 | 1086.51 | 979 | 951 | 186.9 |
| C | 9 | 187 | 10259779 | 54841.5 | 805 | 810 | 187.1 |
| C | 15 | 208 | 2421243 | 12938.94 | 805 | 810 | 187.1 |
| C | 15 | 214 | 313726 | 1672.76 | 805 | 810 | 187.1 |
| D | 12 | 227 | 1064532 | 4532.13 | 958 | 930 | 234.7 |
| D | 13 | 249 | 270630 | 1149.22 | 958 | 930 | 234.7 |
| D | 12 | 233 | 233557 | 991.25 | 958 | 930 | 234.7 |
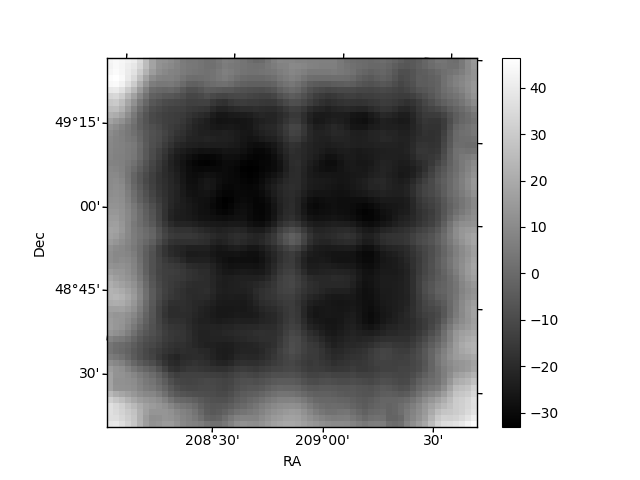
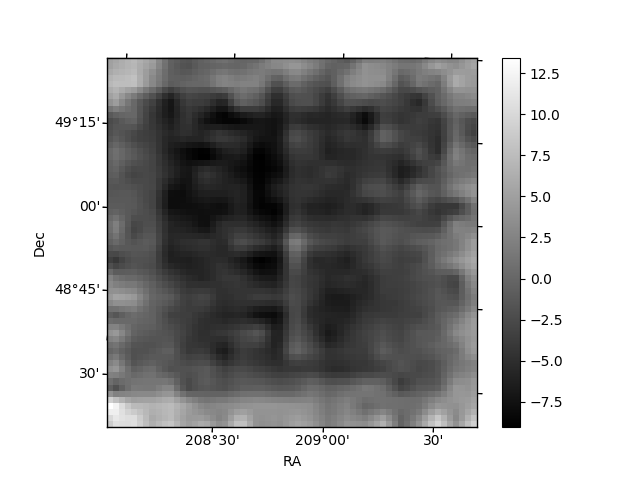
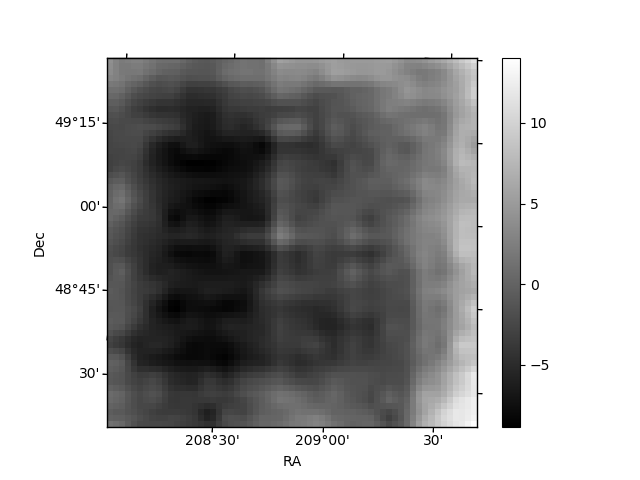
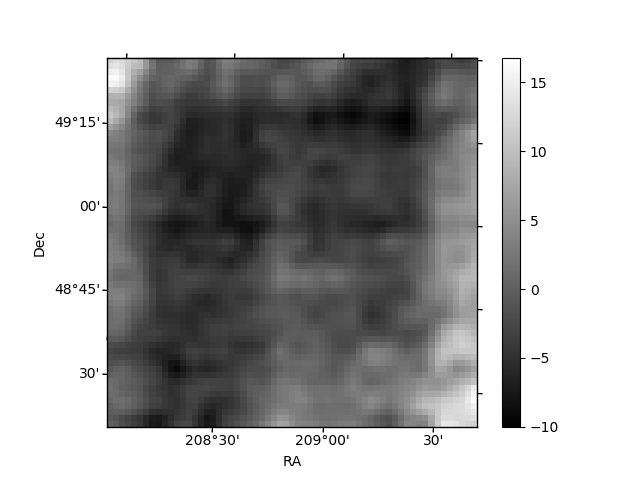
Histogram calculated using DETX and DETY for each event in the final _common_clean file
| Quadrant A | 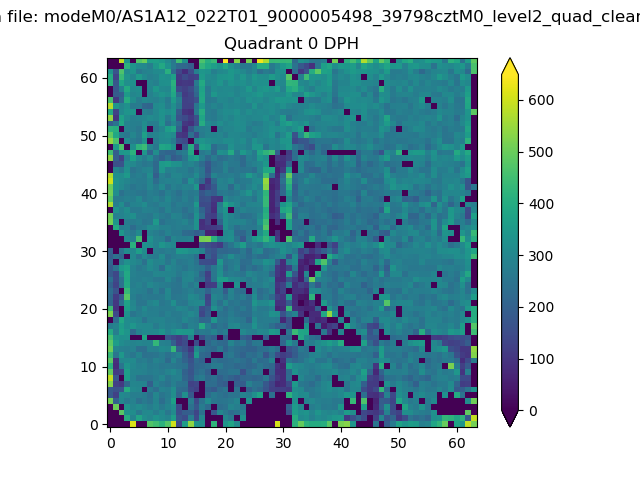 |
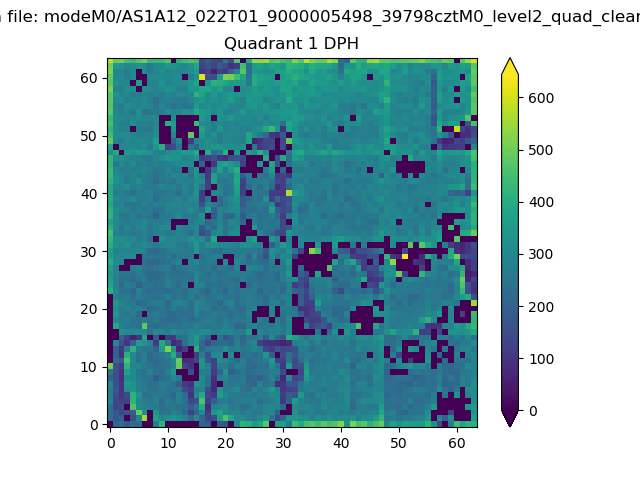 |
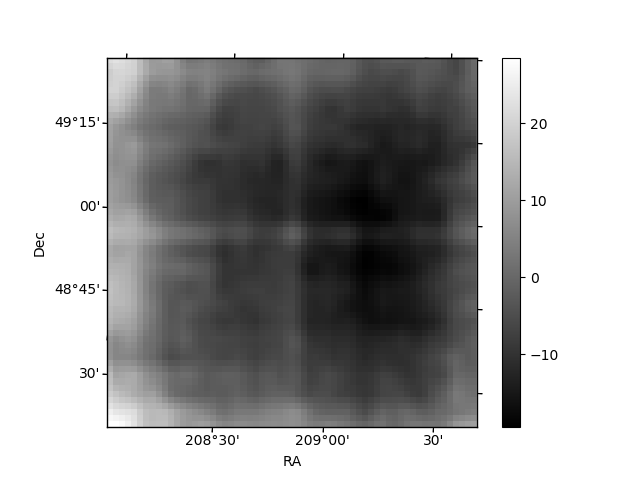
Quadrant B |
|---|---|---|---|
| Quadrant D | 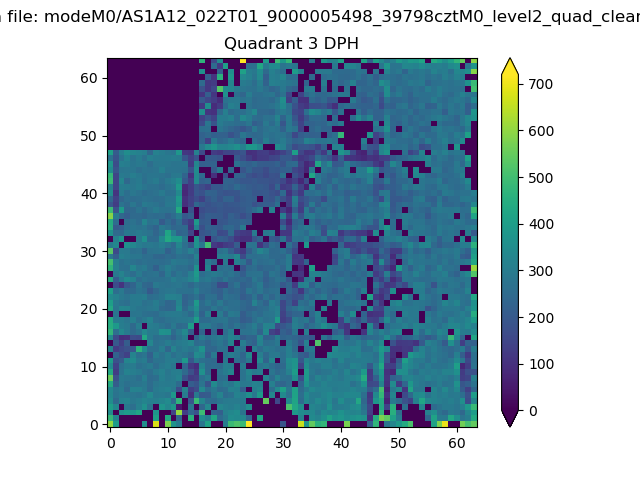 |
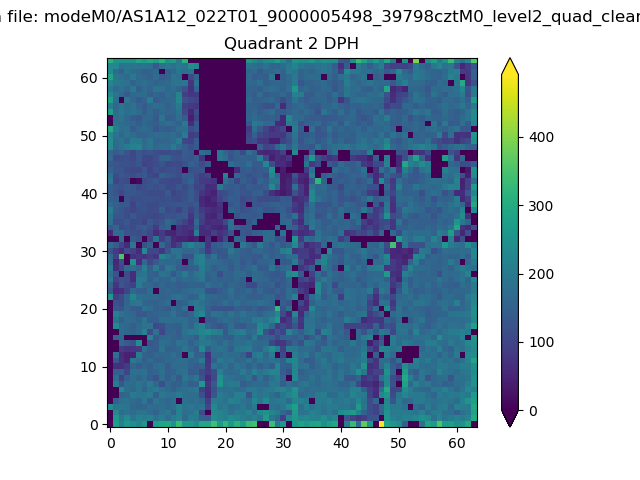 |
Quadrant C |
| Plot type | Count rate plots | Images |
|---|---|---|
| Comparison with Poisson distribution Blue bars denote a histogram of data divided into 1 sec bins. Red curve is a Poisson curve with rate = median count rate of data. |
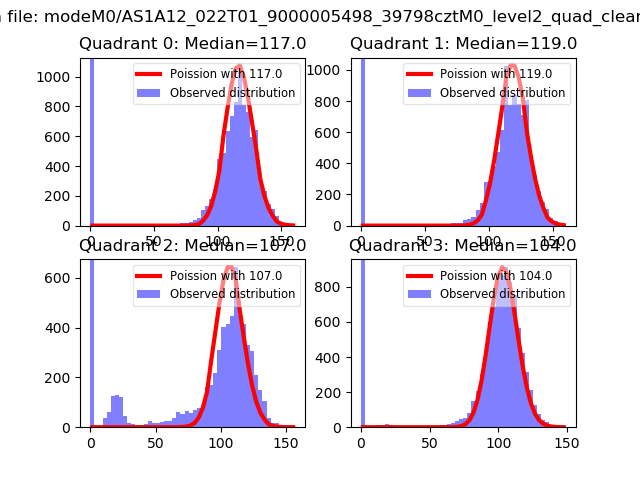 |
 |
| Quadrant-wise count rates Data is divided into 100 sec bins |
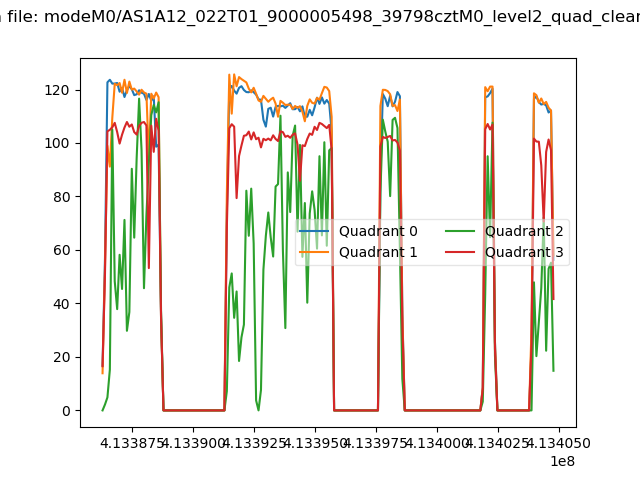 |
|
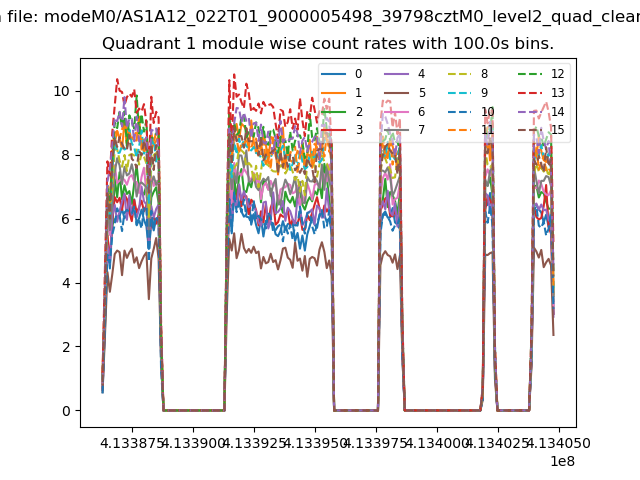
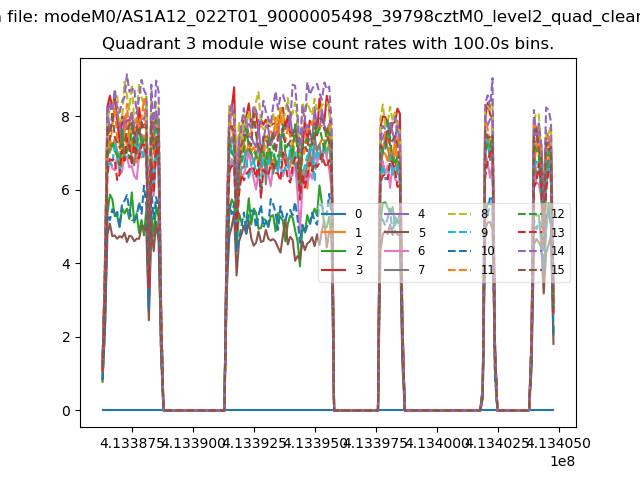
| Module-wise count rates for Quadrant A Data is divided into 100 sec bins |
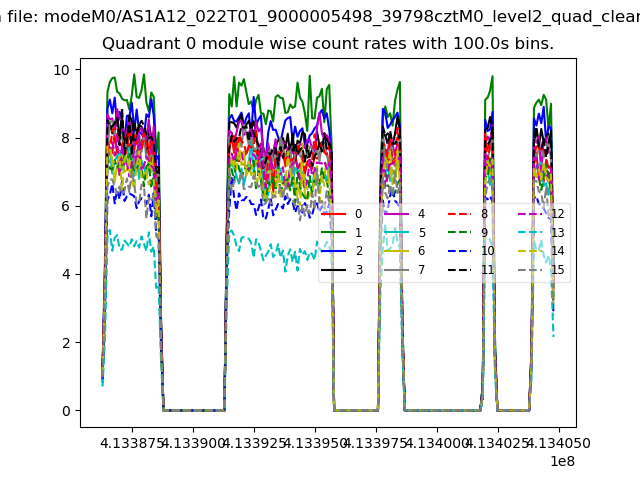 |
 |
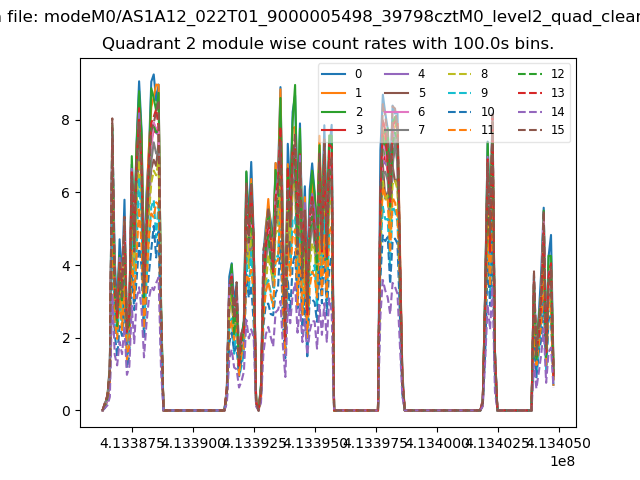
| Module-wise count rates for Quadrant B Data is divided into 100 sec bins |
 |
 |
| Module-wise count rates for Quadrant C Data is divided into 100 sec bins |
 |
 |
| Module-wise count rates for Quadrant D Data is divided into 100 sec bins |
 |
 |
| Parameter | Plot |
|---|---|
| CZT HV Monitor | 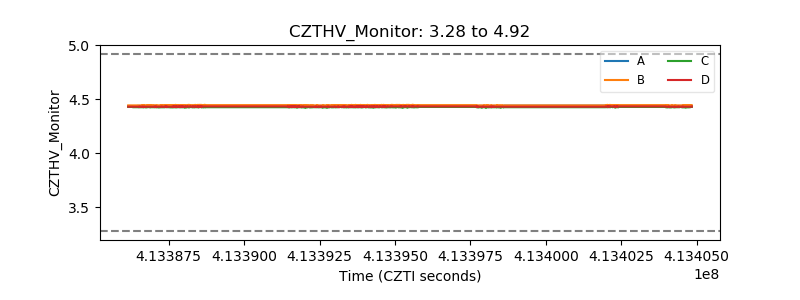 |
| D_VDD | 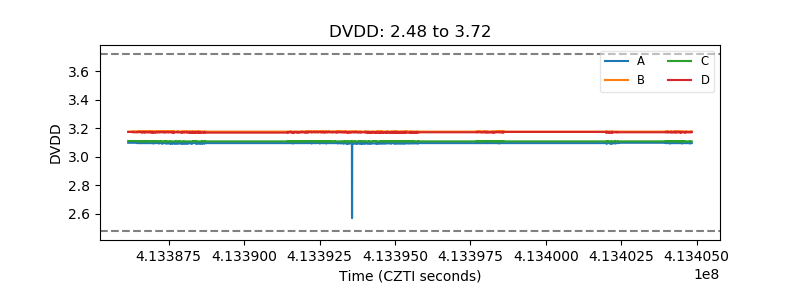 |
| Temperature 1 | 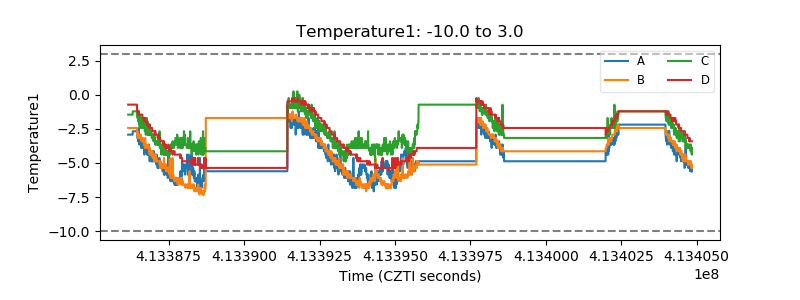 |
| Veto HV Monitor | 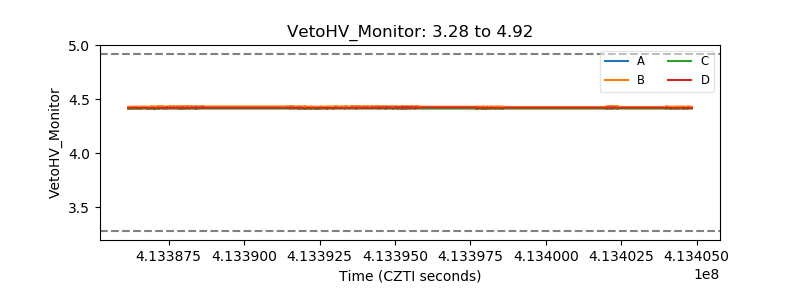 |
| Veto LLD | 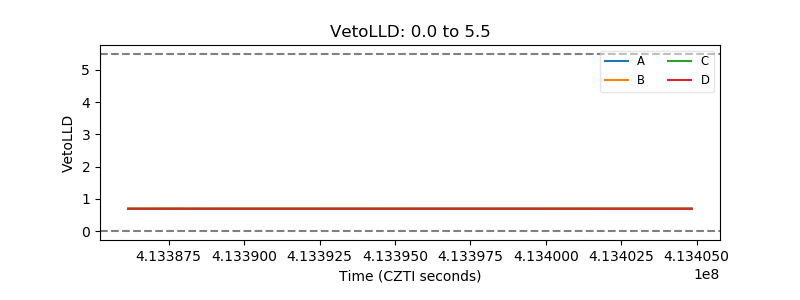 |
| Alpha Counter | 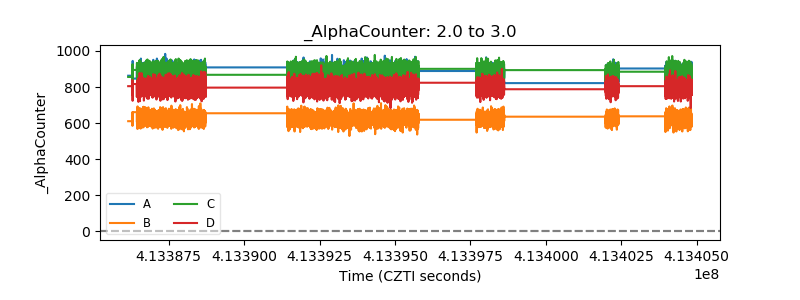 |
| _CPM_Rate | 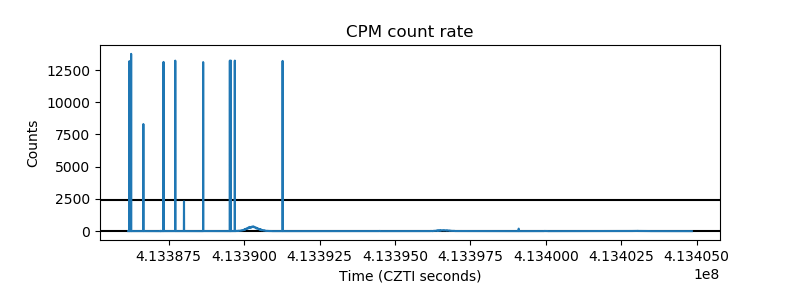 |
| CZT Counter | 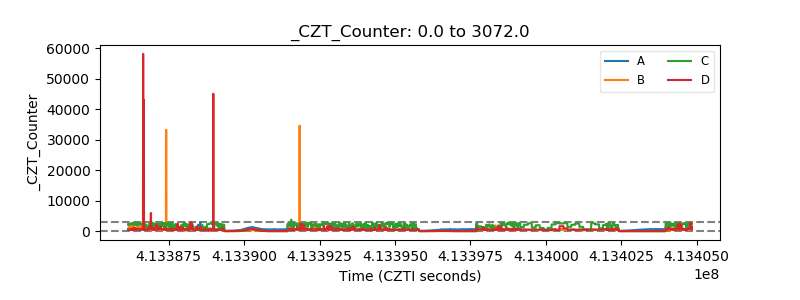 |
| +2.5 Volts monitor | 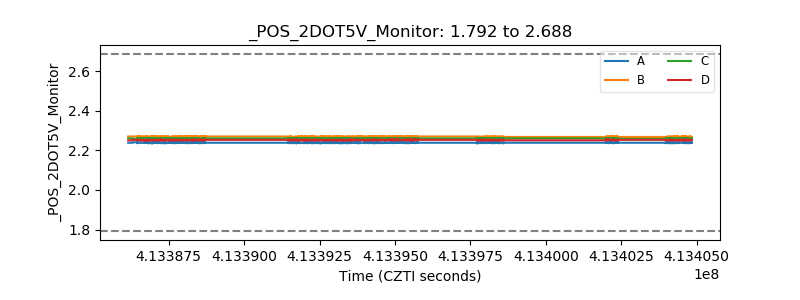 |
| +5 Volts monitor |  |
| _ROLL_ROT | 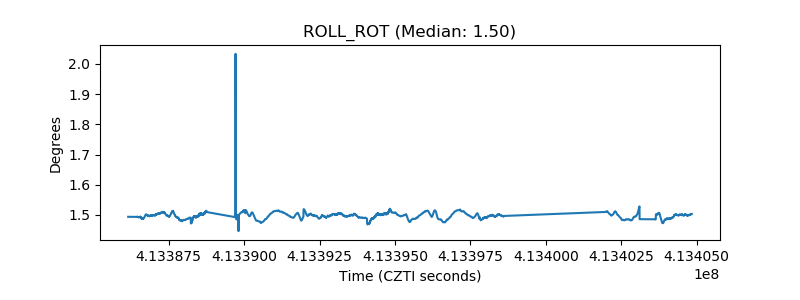 |
| _Roll_DEC | 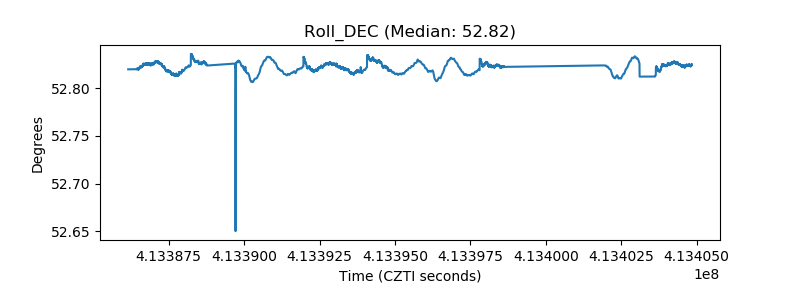 |
| _Roll_RA | 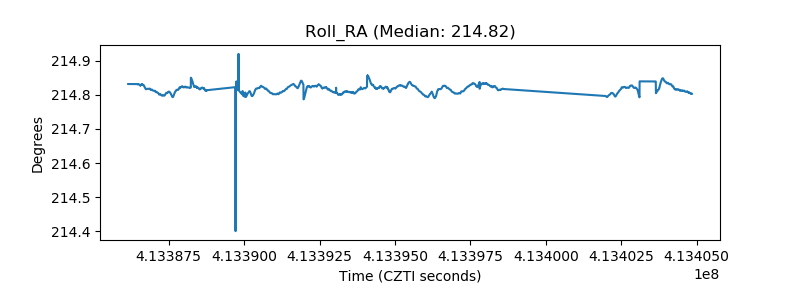 |
| Veto Counter | 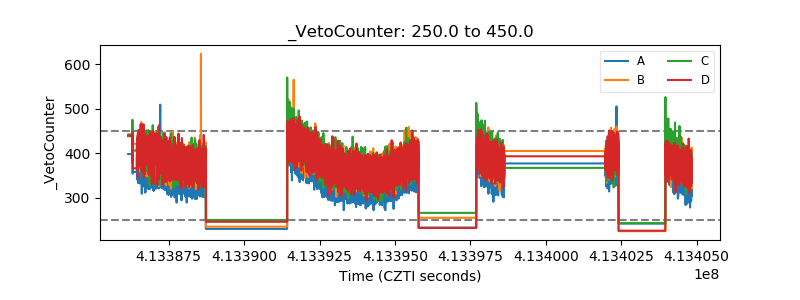 |