| Param | Original file | Final file |
|---|---|---|
| Filename | modeM0/AS1A12_022T01_9000005498_39799cztM0_level2.fits | modeM0/AS1A12_022T01_9000005498_39799cztM0_level2_quad_clean.evt |
| Size (bytes) | 546,076,800 | 79,948,800 |
| Size | 520.8 MB | 76.2 MB |
| Events in quadrant A | 4,113,331 | 583,043 |
| Events in quadrant B | 3,147,901 | 612,592 |
| Events in quadrant C | 9,092,636 | 302,508 |
| Events in quadrant D | 3,437,727 | 539,894 |
| Mode M0 | |||
|---|---|---|---|
| Quadrant | BADHDUFLAG | Total packets | Discarded packets |
| A | 0 | 21539 | 5825 |
| B | 0 | 19531 | 6317 |
| C | 0 | 47616 | 17148 |
| D | 0 | 20700 | 6489 |
| Mode M9 | |||
|---|---|---|---|
| Quadrant | BADHDUFLAG | Total packets | Discarded packets |
| A | 0 | 57 | 2 |
| B | 0 | 56 | 4 |
| C | 0 | 61 | 7 |
| D | 0 | 56 | 3 |
| Mode SS | |||
|---|---|---|---|
| Quadrant | BADHDUFLAG | Total packets | Discarded packets |
| A | 0 | 162 | 38 |
| B | 0 | 165 | 39 |
| C | 0 | 164 | 38 |
| D | 0 | 161 | 45 |
| Quadrant | Total seconds | Saturated seconds | Saturation percentage |
|---|---|---|---|
| A | 5537 | 247 | 4.460899% |
| B | 5566 | 134 | 2.407474% |
| C | 5008 | 2456 | 49.041534% |
| D | 5605 | 178 | 3.175736% |
Noise dominated data is calculated using 1-second bins in cleaned event files. If a bin has >2000 counts, and if more than 50% of those come from <1% of pixels, then it is considered to be noise-dominated and hence unusable.
| Quadrant | # 1 sec bins | Bins with >0 counts | Bins with >2000 counts | High rate bins dominated by noise | Noise dominated (total time) | Noise dominated (detector-on time) | Marked lightcurve |
|---|---|---|---|---|---|---|---|
| A | 25537 | 5983 | 237 | 237 | 0.93% | 3.96% | 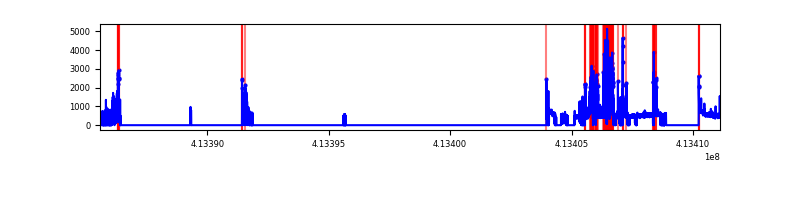 |
| B | 25520 | 5942 | 69 | 69 | 0.27% | 1.16% | 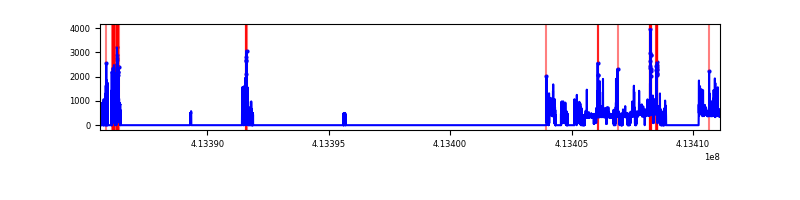 |
| C | 25481 | 5441 | 2061 | 2061 | 8.09% | 37.88% | 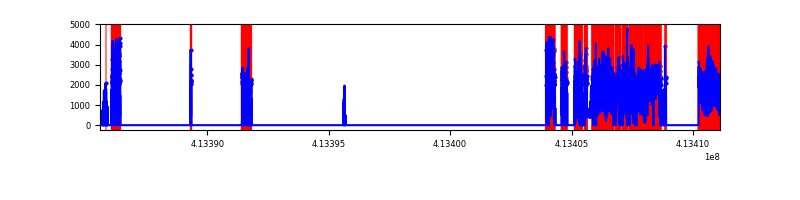 |
| D | 25463 | 6031 | 142 | 142 | 0.56% | 2.35% | 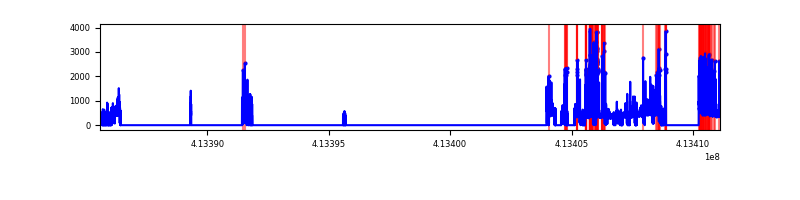 |
Top three noisy pixels from each quadrant. If the there are fewer than three noisy pixels in the level2.evt file, extra rows are filled as -1
| Pixel properties | Quadrant properties | ||||||
|---|---|---|---|---|---|---|---|
| Quadrant | DetID | PixID | Counts | Sigma | Mean | Median | Sigma |
| A | 9 | 143 | 1110191 | 8890.64 | 606 | 593 | 124.8 |
| A | 10 | 83 | 528285 | 4228.12 | 606 | 593 | 124.8 |
| A | 13 | 248 | 88104 | 701.18 | 606 | 593 | 124.8 |
| B | 4 | 170 | 282434 | 2399.71 | 607 | 590 | 117.4 |
| B | 5 | 255 | 255164 | 2167.53 | 607 | 590 | 117.4 |
| B | 4 | 171 | 90956 | 769.41 | 607 | 590 | 117.4 |
| C | 9 | 187 | 6352456 | 61479.54 | 440 | 443 | 103.3 |
| C | 15 | 208 | 758262 | 7334.74 | 440 | 443 | 103.3 |
| C | 15 | 214 | 177258 | 1711.35 | 440 | 443 | 103.3 |
| D | 12 | 227 | 306882 | 2065.09 | 600 | 583 | 148.3 |
| D | 13 | 249 | 283002 | 1904.09 | 600 | 583 | 148.3 |
| D | 2 | 249 | 217132 | 1459.99 | 600 | 583 | 148.3 |
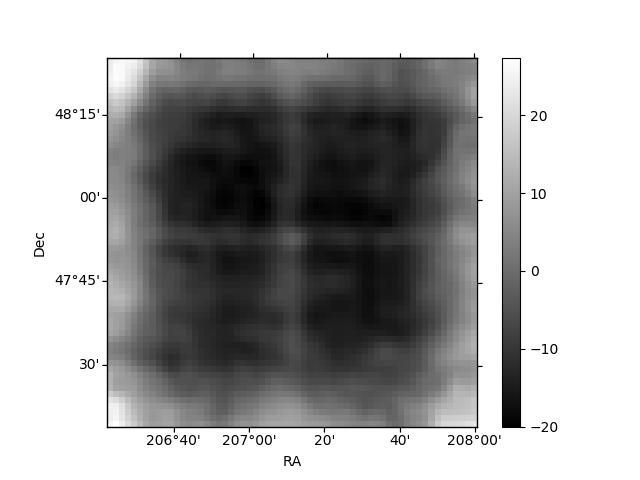
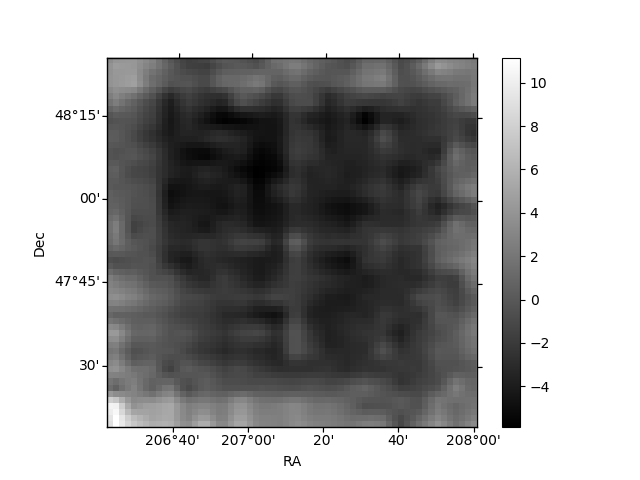
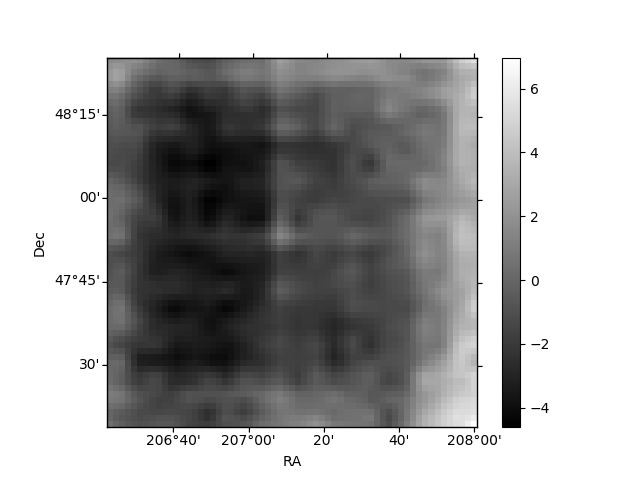
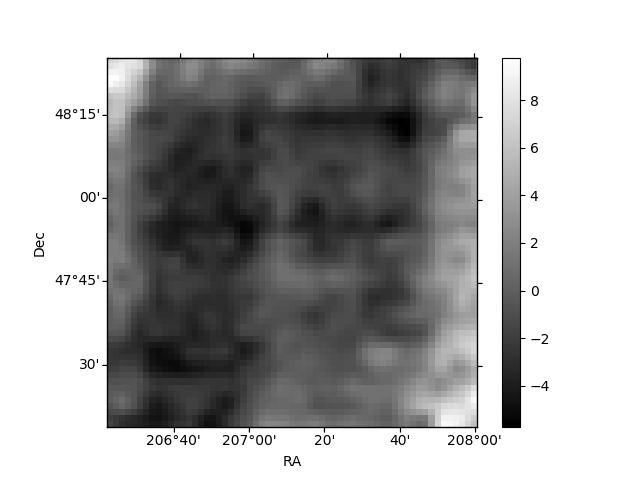
Histogram calculated using DETX and DETY for each event in the final _common_clean file
| Quadrant A | 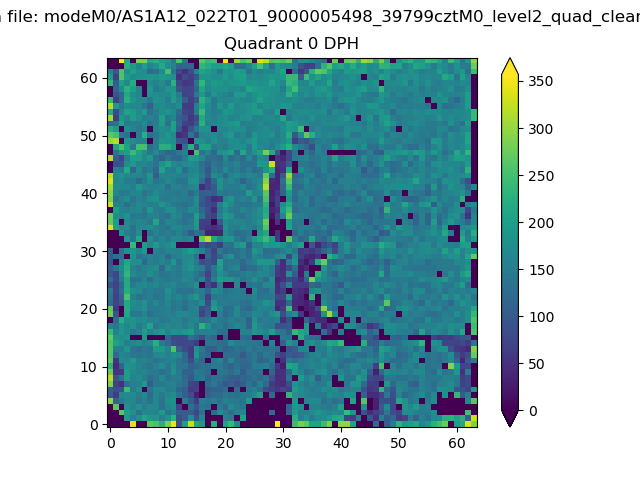 |
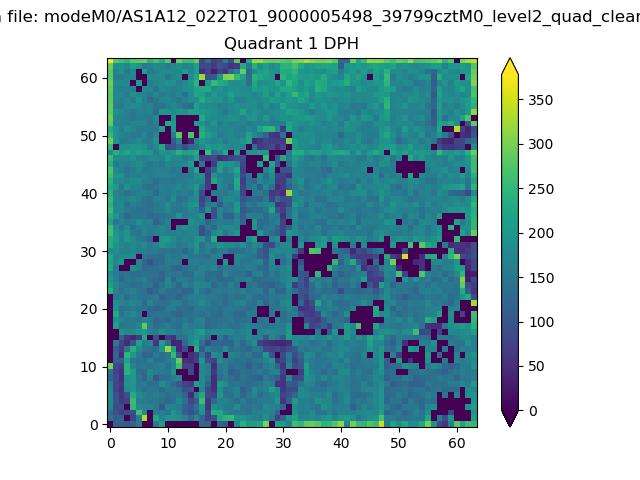 |
Quadrant B |
|---|---|---|---|
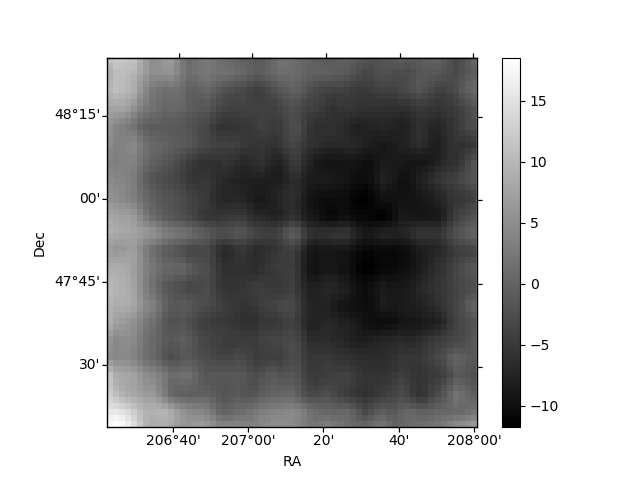
| Quadrant D | 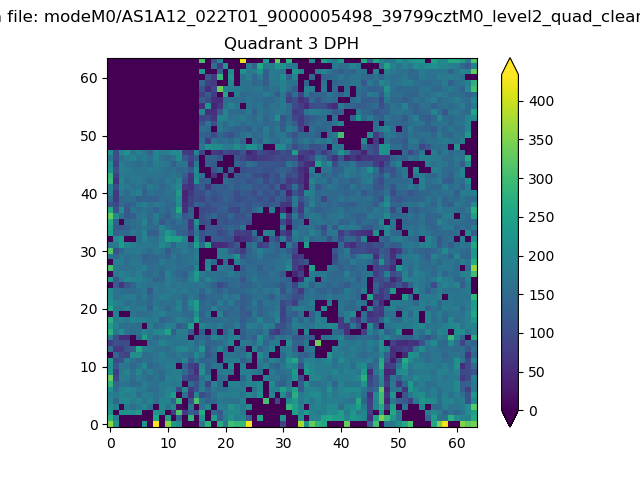 |
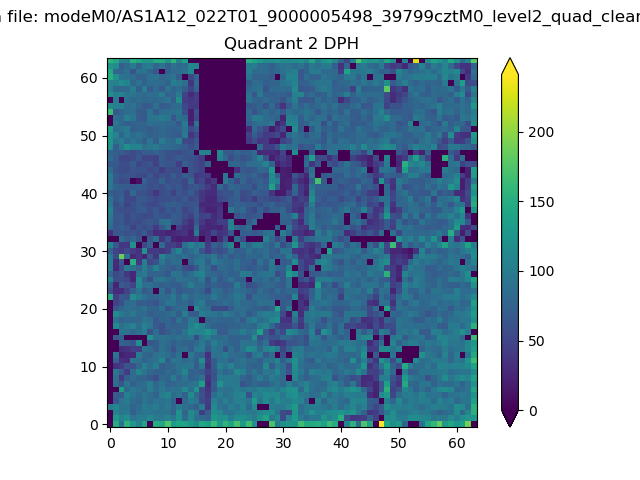 |
Quadrant C |
| Plot type | Count rate plots | Images |
|---|---|---|
| Comparison with Poisson distribution Blue bars denote a histogram of data divided into 1 sec bins. Red curve is a Poisson curve with rate = median count rate of data. |
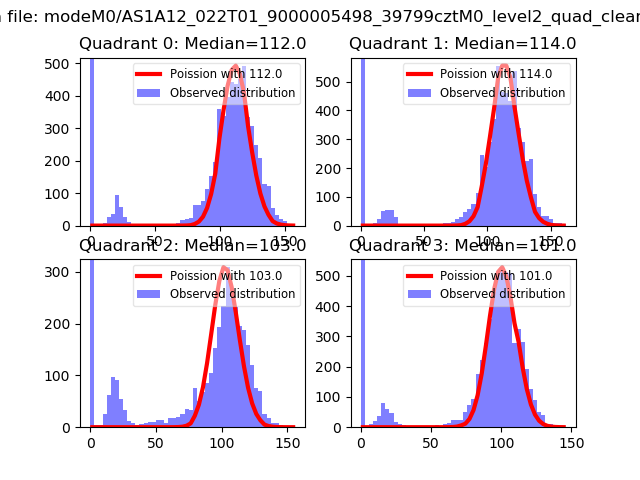 |
 |
| Quadrant-wise count rates Data is divided into 100 sec bins |
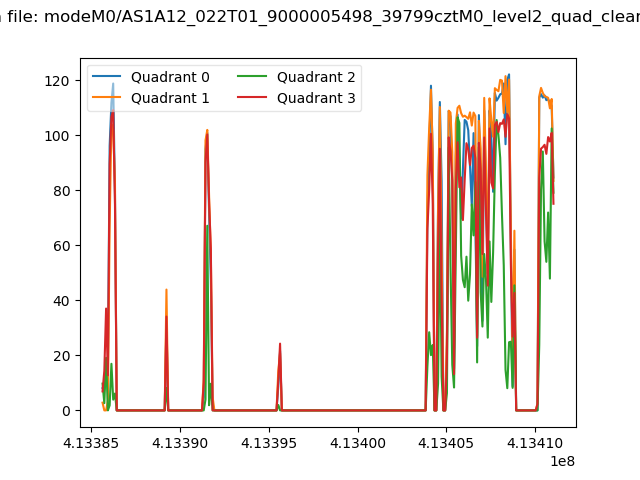 |
|
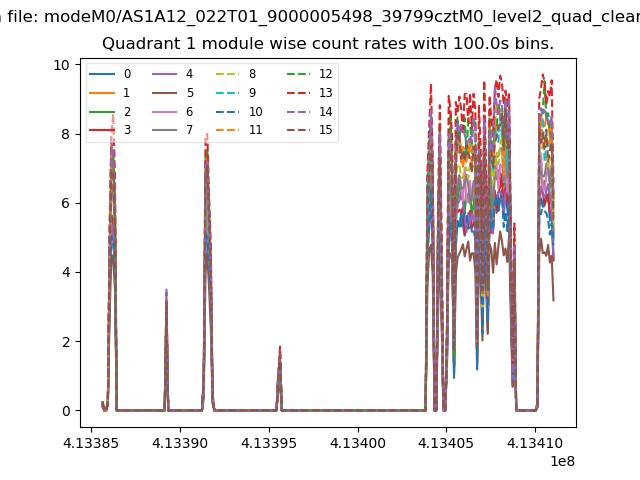
| Module-wise count rates for Quadrant A Data is divided into 100 sec bins |
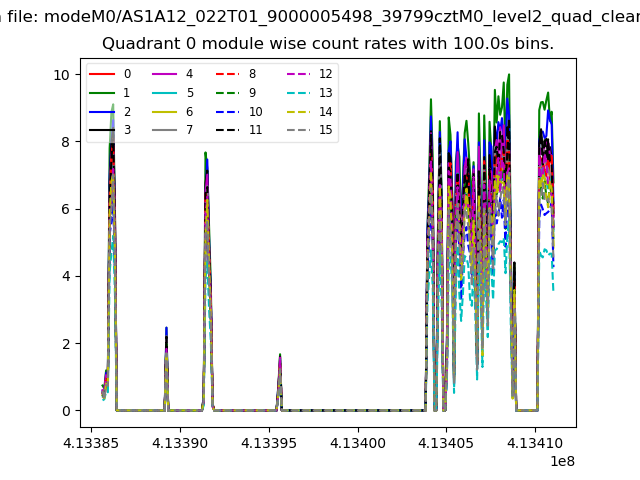 |
 |
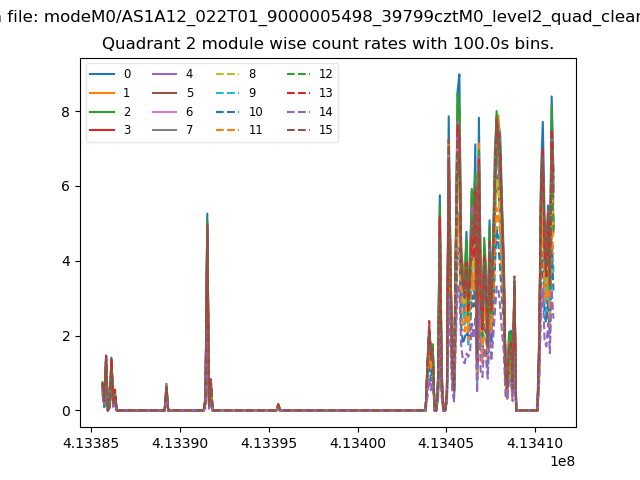
| Module-wise count rates for Quadrant B Data is divided into 100 sec bins |
 |
 |
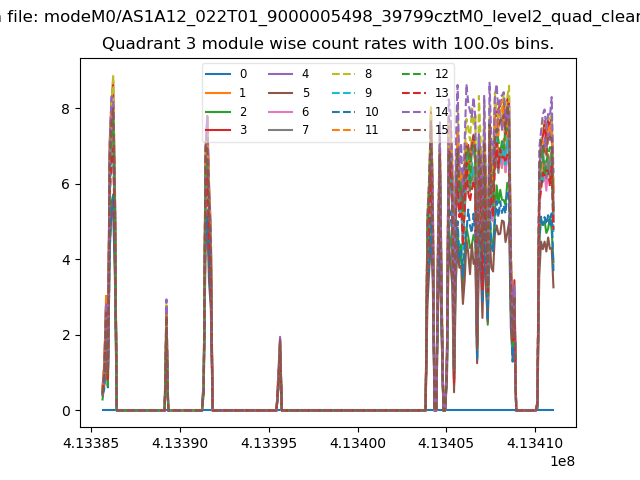
| Module-wise count rates for Quadrant C Data is divided into 100 sec bins |
 |
 |
| Module-wise count rates for Quadrant D Data is divided into 100 sec bins |
 |
 |
| Parameter | Plot |
|---|---|
| CZT HV Monitor | 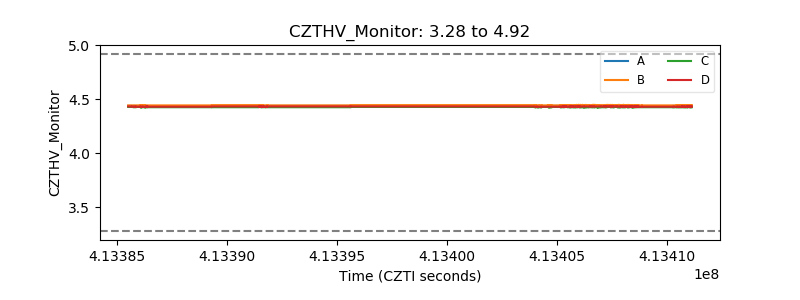 |
| D_VDD | 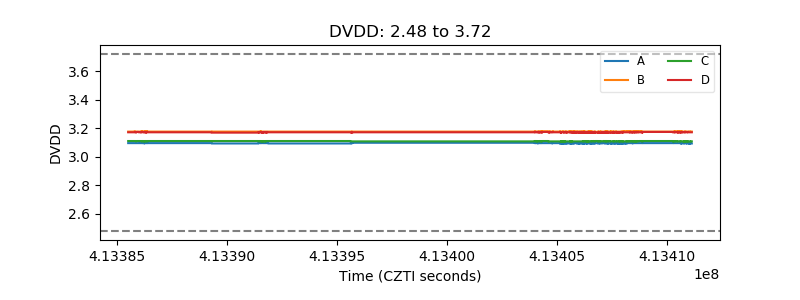 |
| Temperature 1 | 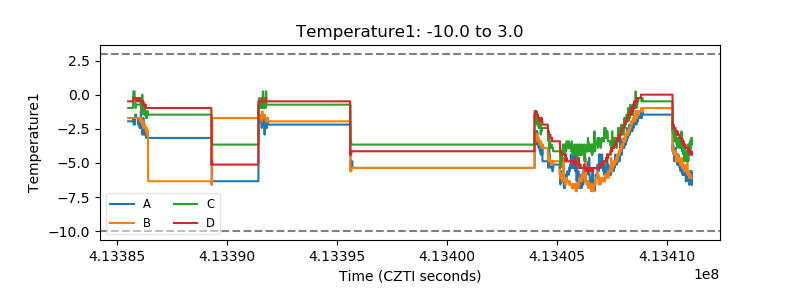 |
| Veto HV Monitor |  |
| Veto LLD | 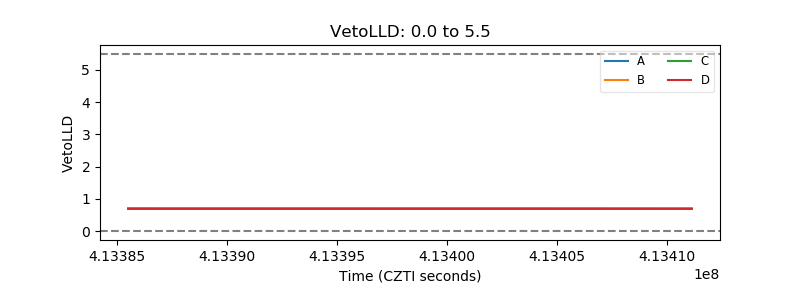 |
| Alpha Counter | 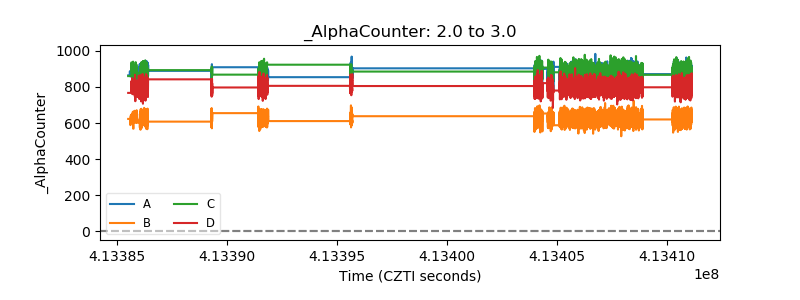 |
| _CPM_Rate | 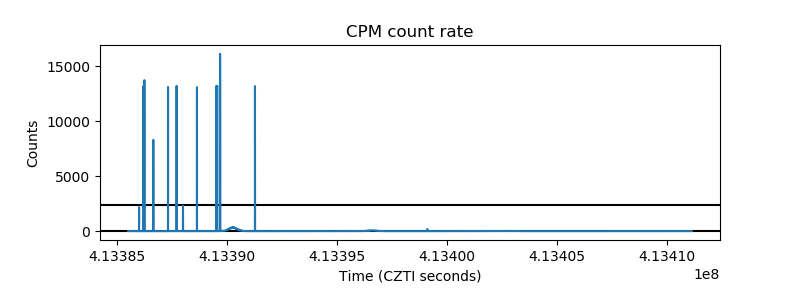 |
| CZT Counter | 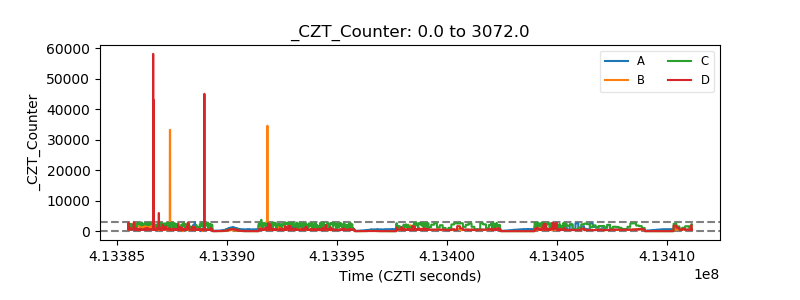 |
| +2.5 Volts monitor | 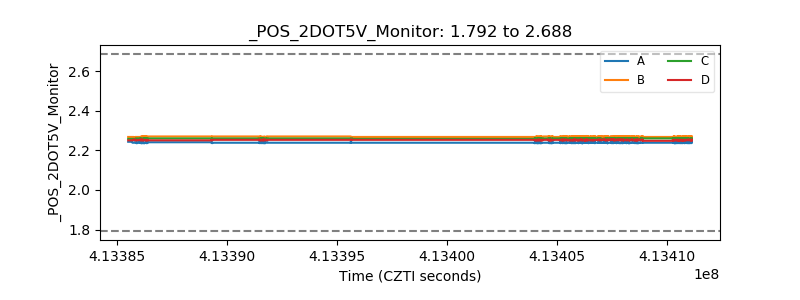 |
| +5 Volts monitor | 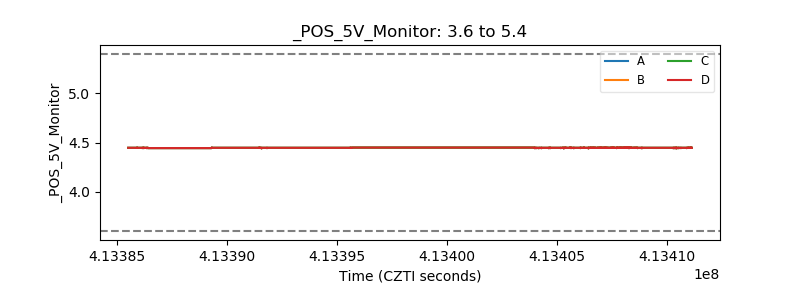 |
| _ROLL_ROT | 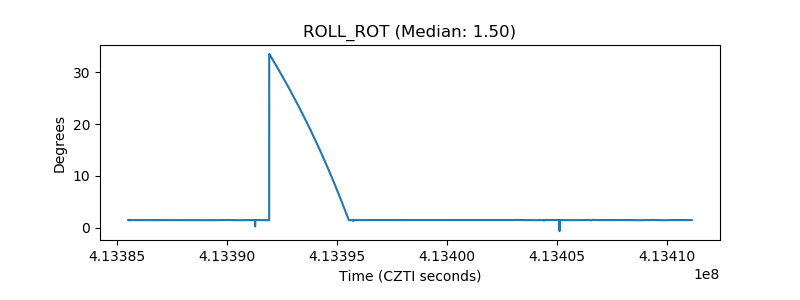 |
| _Roll_DEC | 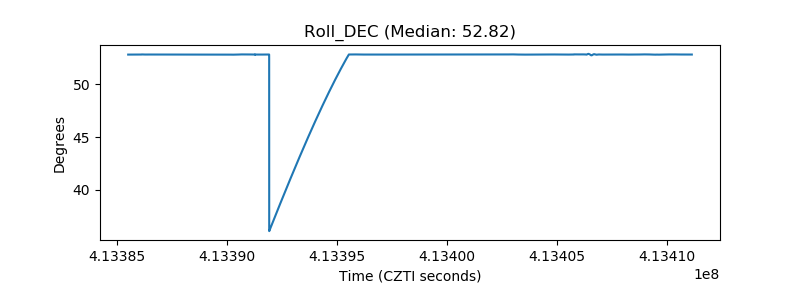 |
| _Roll_RA | 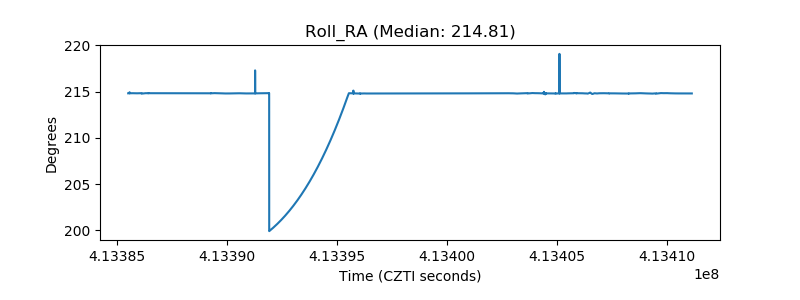 |
| Veto Counter | 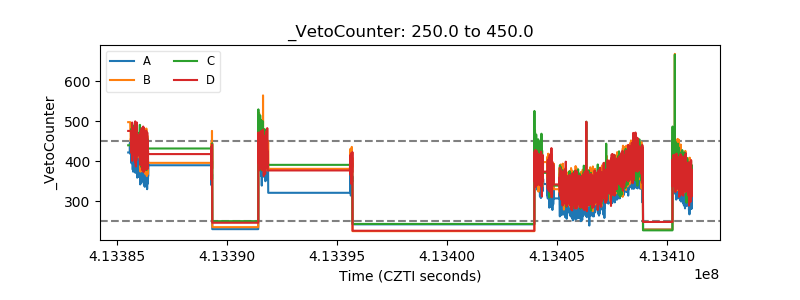 |