| Param | Original file | Final file |
|---|---|---|
| Filename | modeM0/AS1A12_022T01_9000005498_39800cztM0_level2.fits | modeM0/AS1A12_022T01_9000005498_39800cztM0_level2_quad_clean.evt |
| Size (bytes) | 561,818,880 | 90,253,440 |
| Size | 535.8 MB | 86.1 MB |
| Events in quadrant A | 3,165,412 | 656,138 |
| Events in quadrant B | 3,412,300 | 657,878 |
| Events in quadrant C | 9,909,879 | 434,153 |
| Events in quadrant D | 3,846,852 | 568,537 |
| Mode M0 | |||
|---|---|---|---|
| Quadrant | BADHDUFLAG | Total packets | Discarded packets |
| A | 0 | 13327 | 3 |
| B | 0 | 14435 | 2 |
| C | 0 | 33592 | 2 |
| D | 0 | 15602 | 2 |
| Mode M9 | |||
|---|---|---|---|
| Quadrant | BADHDUFLAG | Total packets | Discarded packets |
| A | 0 | 16 | 0 |
| B | 0 | 16 | 0 |
| C | 0 | 16 | 0 |
| D | 0 | 17 | 0 |
| Mode SS | |||
|---|---|---|---|
| Quadrant | BADHDUFLAG | Total packets | Discarded packets |
| A | 0 | 120 | 0 |
| B | 0 | 120 | 0 |
| C | 0 | 120 | 0 |
| D | 0 | 120 | 0 |
| Quadrant | Total seconds | Saturated seconds | Saturation percentage |
|---|---|---|---|
| A | 5952 | 31 | 0.520833% |
| B | 5952 | 165 | 2.772177% |
| C | 5952 | 2327 | 39.096102% |
| D | 5952 | 287 | 4.821909% |
Noise dominated data is calculated using 1-second bins in cleaned event files. If a bin has >2000 counts, and if more than 50% of those come from <1% of pixels, then it is considered to be noise-dominated and hence unusable.
| Quadrant | # 1 sec bins | Bins with >0 counts | Bins with >2000 counts | High rate bins dominated by noise | Noise dominated (total time) | Noise dominated (detector-on time) | Marked lightcurve |
|---|---|---|---|---|---|---|---|
| A | 7264 | 5953 | 20 | 20 | 0.28% | 0.34% | 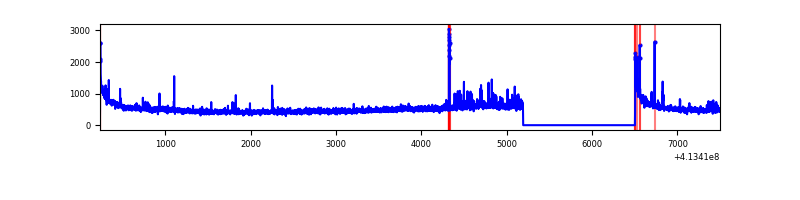 |
| B | 7264 | 5953 | 93 | 93 | 1.28% | 1.56% | 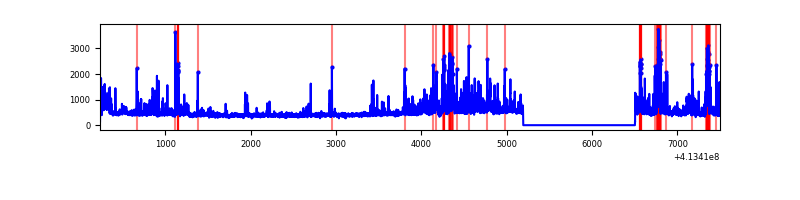 |
| C | 7264 | 5953 | 2040 | 2040 | 28.08% | 34.27% | 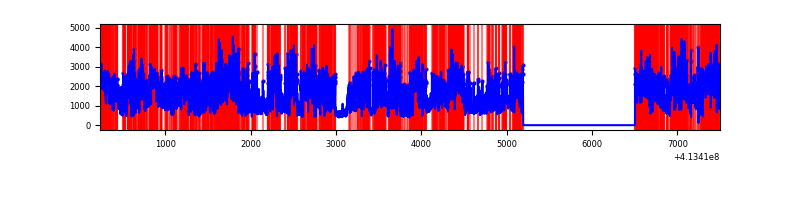 |
| D | 7264 | 5953 | 145 | 145 | 2.00% | 2.44% | 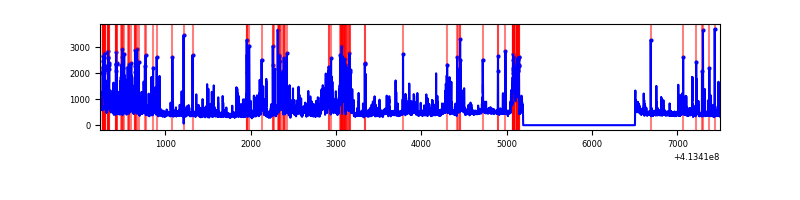 |
Top three noisy pixels from each quadrant. If the there are fewer than three noisy pixels in the level2.evt file, extra rows are filled as -1
| Pixel properties | Quadrant properties | ||||||
|---|---|---|---|---|---|---|---|
| Quadrant | DetID | PixID | Counts | Sigma | Mean | Median | Sigma |
| A | 10 | 83 | 489423 | 3656.08 | 645 | 631 | 133.7 |
| A | 9 | 143 | 86281 | 640.65 | 645 | 631 | 133.7 |
| A | 6 | 10 | 50522 | 373.18 | 645 | 631 | 133.7 |
| B | 5 | 255 | 372924 | 3001.5 | 637 | 618 | 124.0 |
| B | 5 | 172 | 245727 | 1976.05 | 637 | 618 | 124.0 |
| B | 4 | 171 | 181829 | 1460.91 | 637 | 618 | 124.0 |
| C | 9 | 187 | 6735258 | 53721.34 | 534 | 537 | 125.4 |
| C | 15 | 208 | 849351 | 6770.8 | 534 | 537 | 125.4 |
| C | 15 | 214 | 214249 | 1704.73 | 534 | 537 | 125.4 |
| D | 12 | 227 | 549531 | 3595.22 | 617 | 597 | 152.7 |
| D | 2 | 249 | 209740 | 1369.77 | 617 | 597 | 152.7 |
| D | 12 | 233 | 186689 | 1218.8 | 617 | 597 | 152.7 |
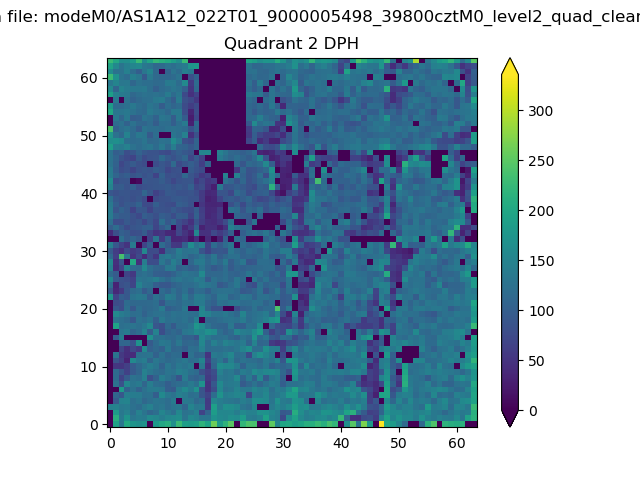
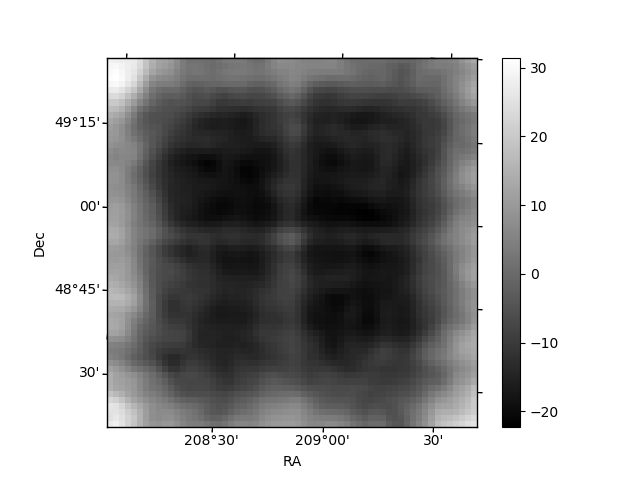
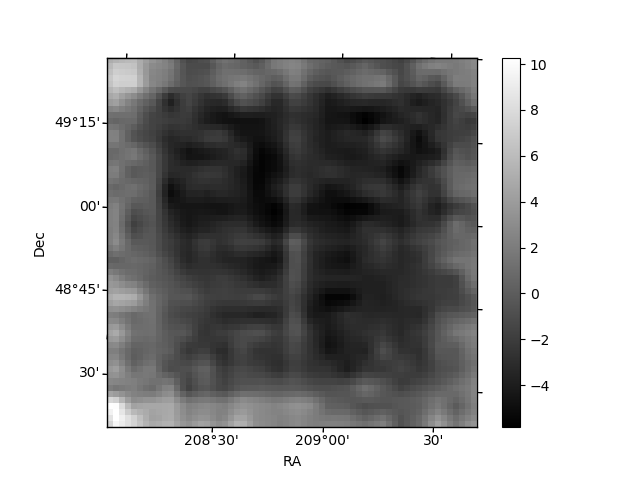
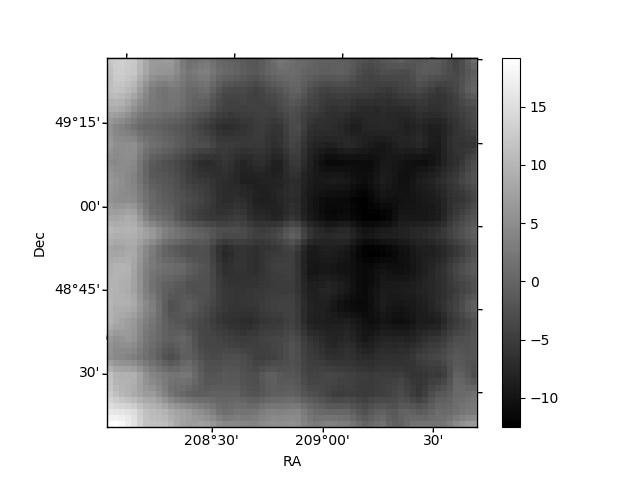
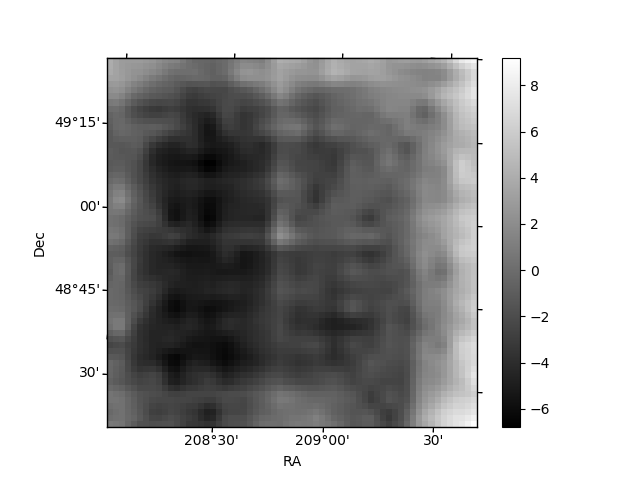
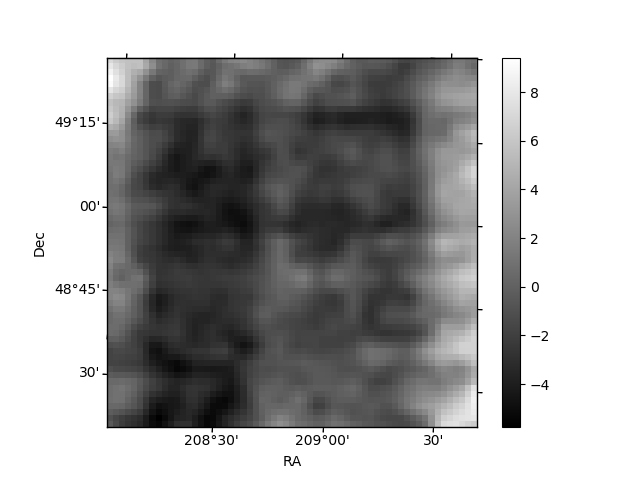
Histogram calculated using DETX and DETY for each event in the final _common_clean file
| Quadrant A | 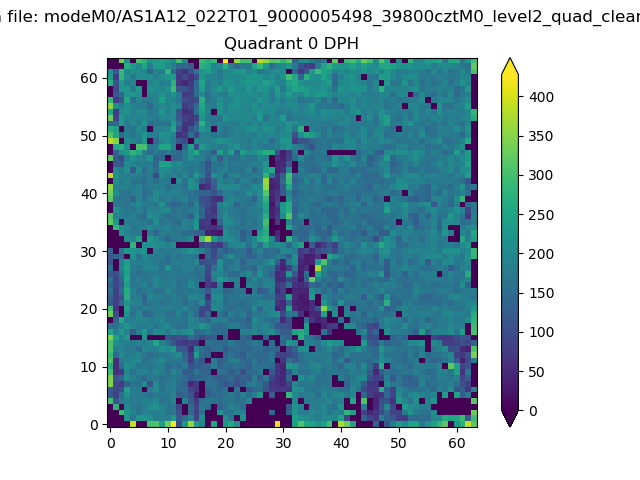 |
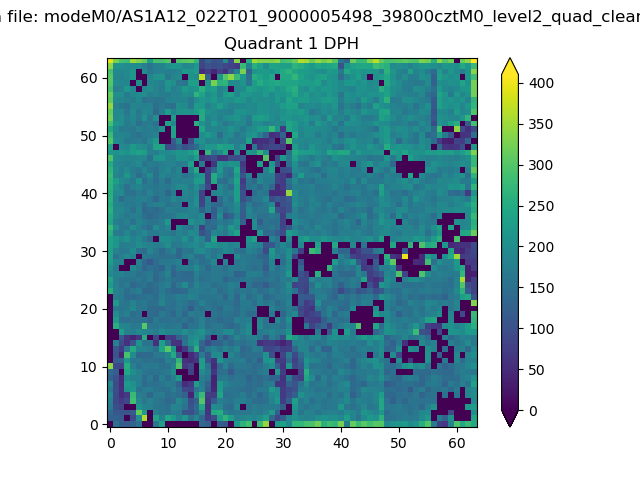 |
Quadrant B |
|---|---|---|---|
| Quadrant D | 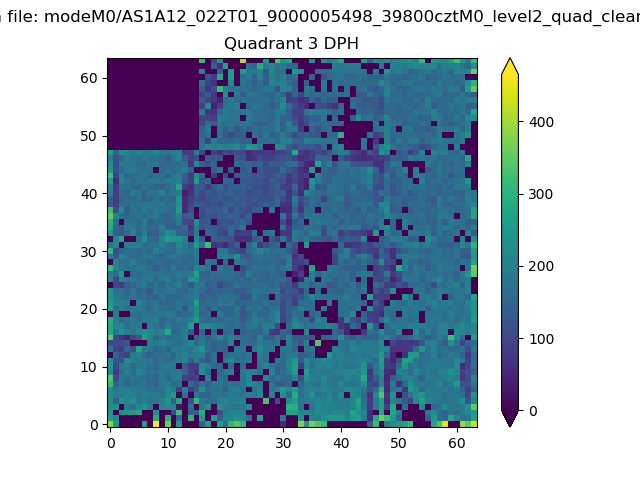 |
 |
Quadrant C |
| Plot type | Count rate plots | Images |
|---|---|---|
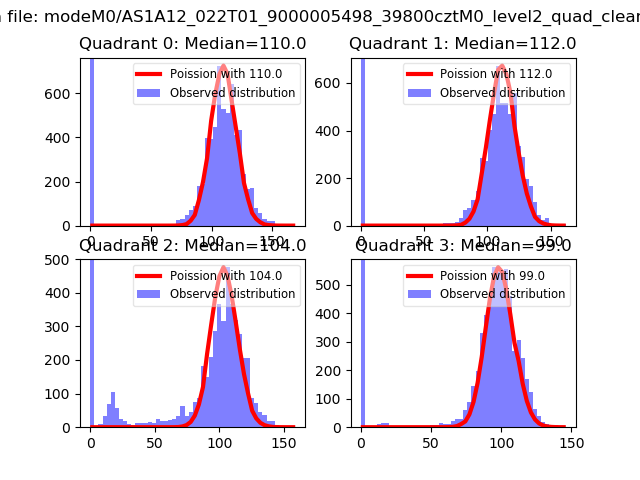
| Comparison with Poisson distribution Blue bars denote a histogram of data divided into 1 sec bins. Red curve is a Poisson curve with rate = median count rate of data. |
 |
 |
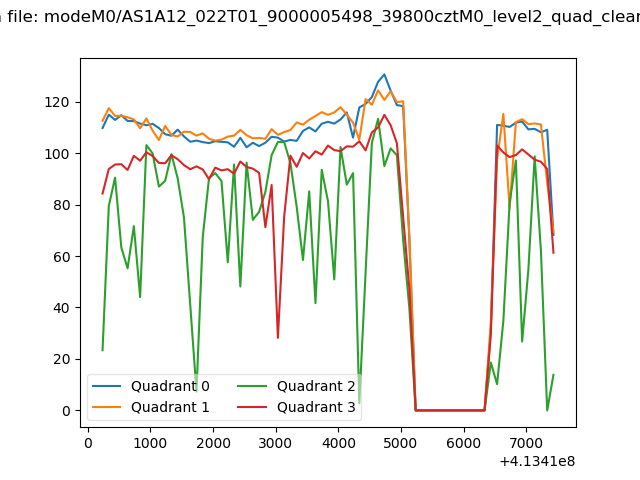
| Quadrant-wise count rates Data is divided into 100 sec bins |
 |
|
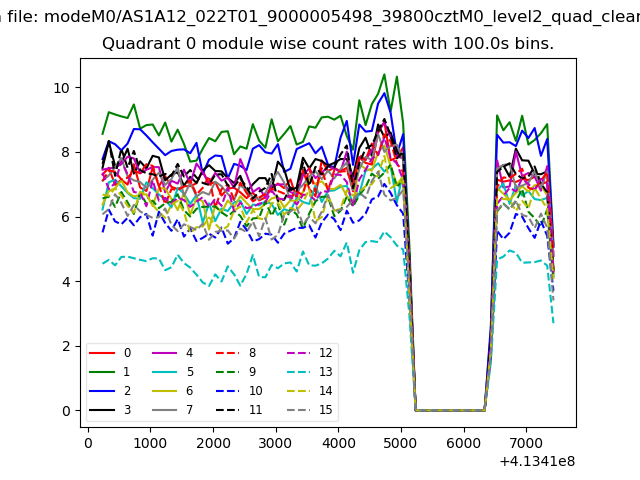
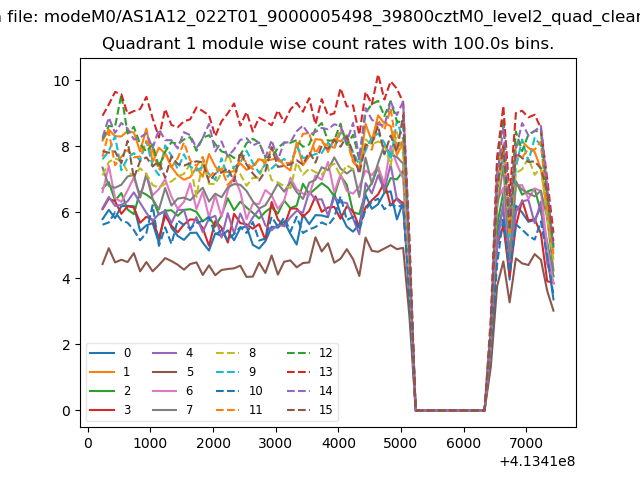
| Module-wise count rates for Quadrant A Data is divided into 100 sec bins |
 |
 |
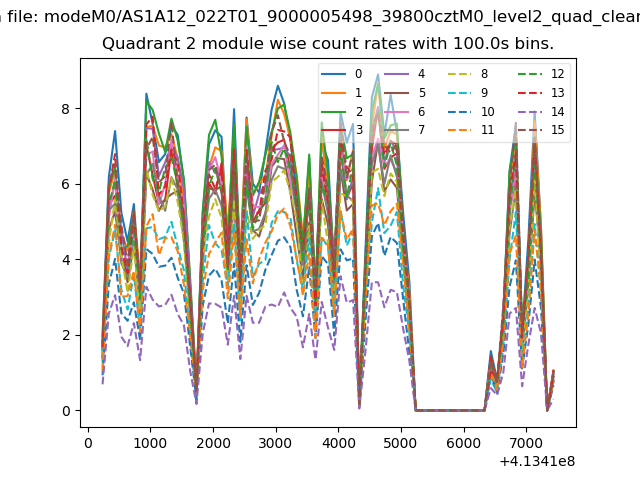
| Module-wise count rates for Quadrant B Data is divided into 100 sec bins |
 |
 |
| Module-wise count rates for Quadrant C Data is divided into 100 sec bins |
 |
 |
| Module-wise count rates for Quadrant D Data is divided into 100 sec bins |
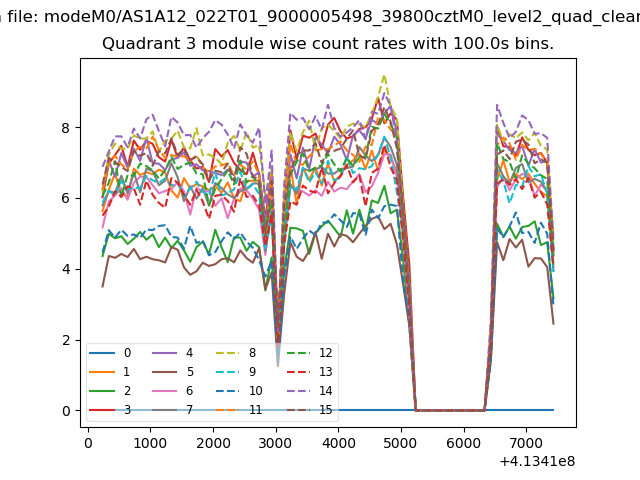 |
 |
| Parameter | Plot |
|---|---|
| CZT HV Monitor | 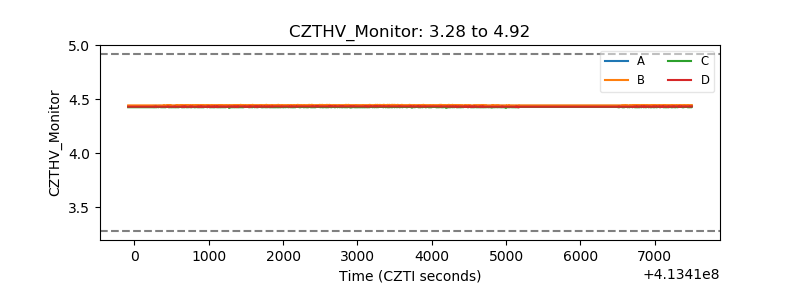 |
| D_VDD | 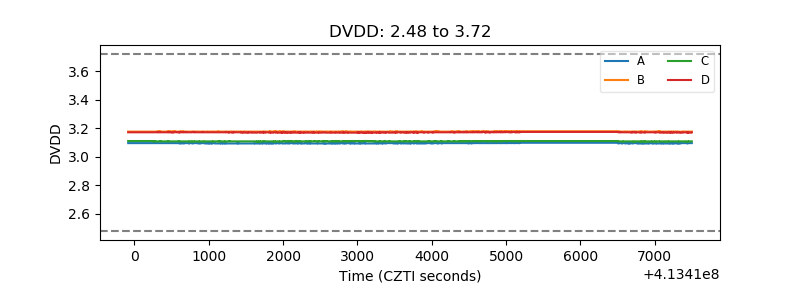 |
| Temperature 1 | 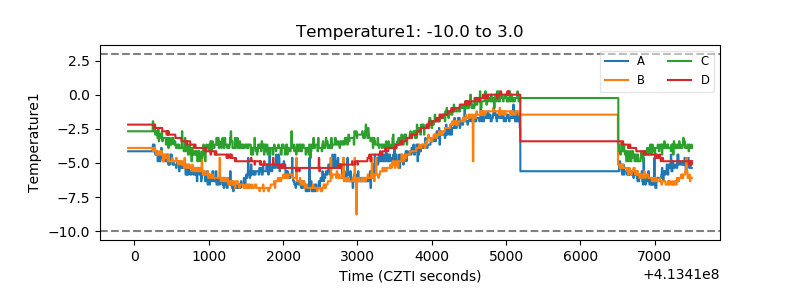 |
| Veto HV Monitor | 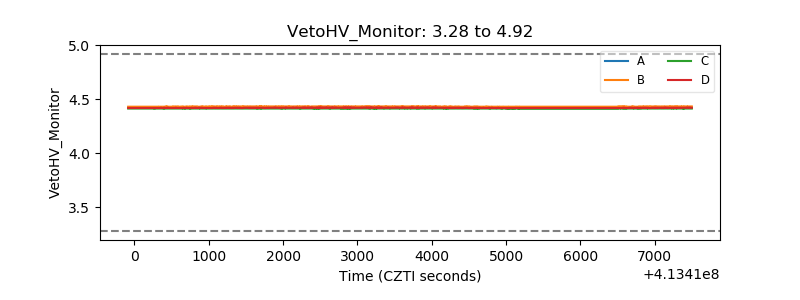 |
| Veto LLD | 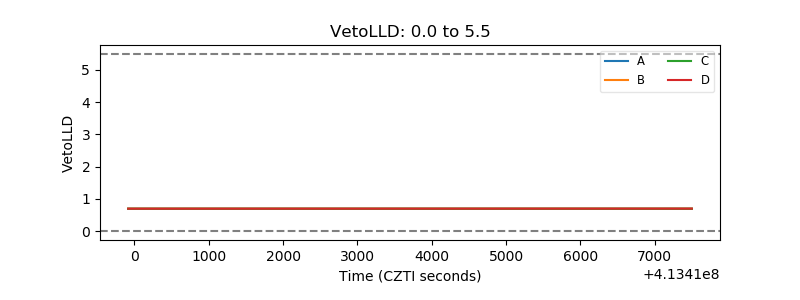 |
| Alpha Counter | 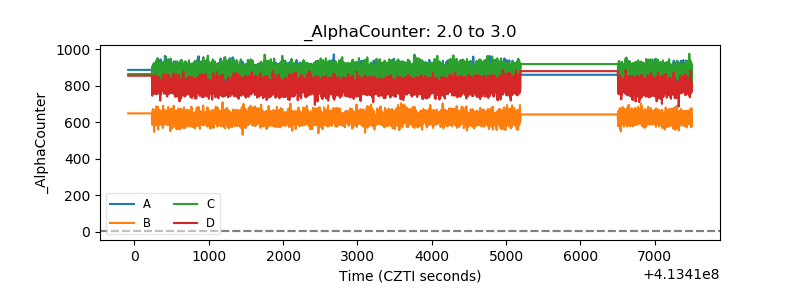 |
| _CPM_Rate | 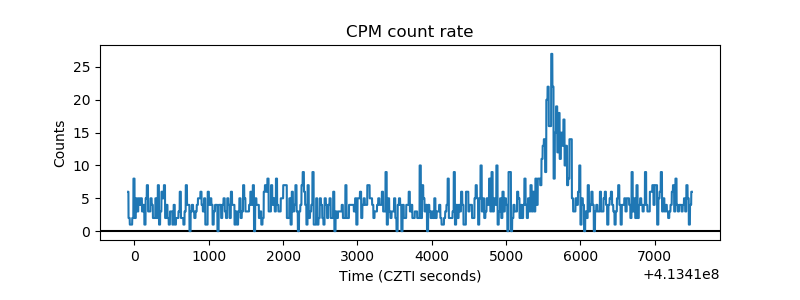 |
| CZT Counter | 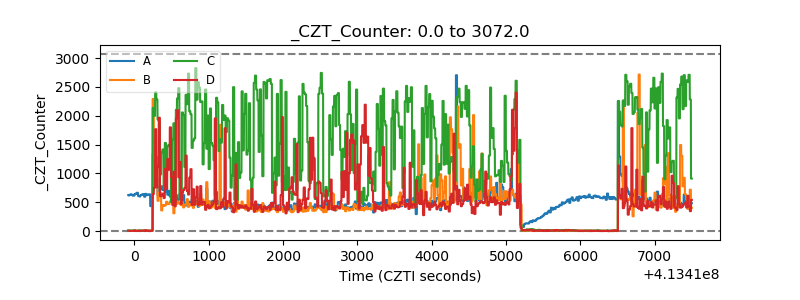 |
| +2.5 Volts monitor |  |
| +5 Volts monitor | 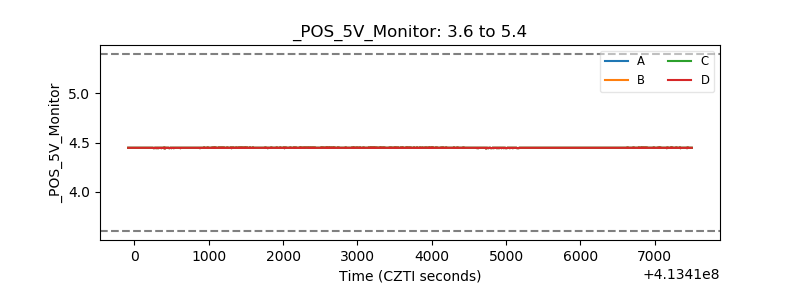 |
| _ROLL_ROT | 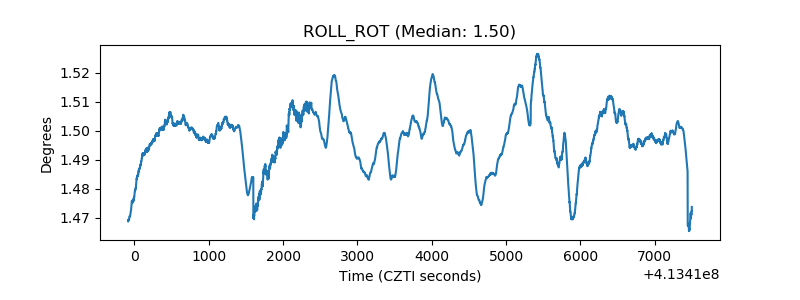 |
| _Roll_DEC | 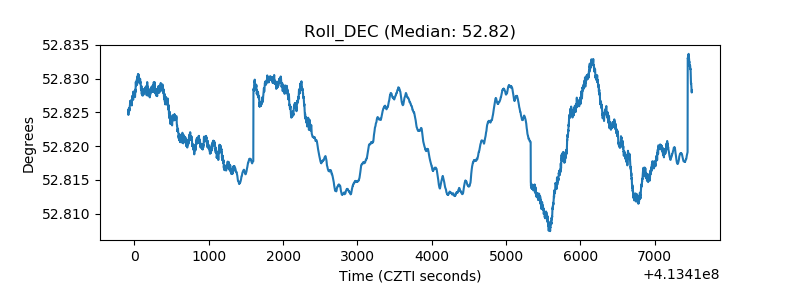 |
| _Roll_RA | 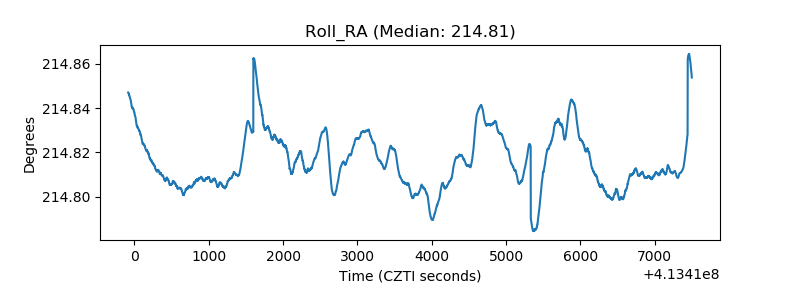 |
| Veto Counter | 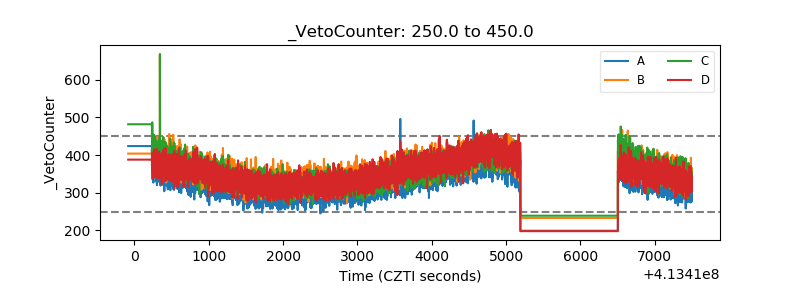 |