| Param | Original file | Final file |
|---|---|---|
| Filename | modeM0/AS1A12_022T01_9000005498_39803cztM0_level2.fits | modeM0/AS1A12_022T01_9000005498_39803cztM0_level2_quad_clean.evt |
| Size (bytes) | 1,941,065,280 | 303,926,400 |
| Size | 1.8 GB | 289.8 MB |
| Events in quadrant A | 11,900,300 | 2,245,976 |
| Events in quadrant B | 11,042,883 | 2,282,010 |
| Events in quadrant C | 35,349,444 | 1,316,752 |
| Events in quadrant D | 11,951,136 | 1,922,758 |
| Mode M0 | |||
|---|---|---|---|
| Quadrant | BADHDUFLAG | Total packets | Discarded packets |
| A | 0 | 55331 | 6358 |
| B | 0 | 54036 | 6309 |
| C | 0 | 132033 | 12766 |
| D | 0 | 57237 | 6204 |
| Mode M9 | |||
|---|---|---|---|
| Quadrant | BADHDUFLAG | Total packets | Discarded packets |
| A | 0 | 71 | 17 |
| B | 0 | 72 | 19 |
| C | 0 | 78 | 25 |
| D | 0 | 69 | 16 |
| Mode SS | |||
|---|---|---|---|
| Quadrant | BADHDUFLAG | Total packets | Discarded packets |
| A | 0 | 485 | 61 |
| B | 0 | 481 | 61 |
| C | 0 | 478 | 54 |
| D | 0 | 475 | 48 |
| Quadrant | Total seconds | Saturated seconds | Saturation percentage |
|---|---|---|---|
| A | 20872 | 334 | 1.600230% |
| B | 20848 | 396 | 1.899463% |
| C | 20697 | 8885 | 42.928927% |
| D | 20825 | 655 | 3.145258% |
Noise dominated data is calculated using 1-second bins in cleaned event files. If a bin has >2000 counts, and if more than 50% of those come from <1% of pixels, then it is considered to be noise-dominated and hence unusable.
| Quadrant | # 1 sec bins | Bins with >0 counts | Bins with >2000 counts | High rate bins dominated by noise | Noise dominated (total time) | Noise dominated (detector-on time) | Marked lightcurve |
|---|---|---|---|---|---|---|---|
| A | 28881 | 21110 | 309 | 309 | 1.07% | 1.46% | 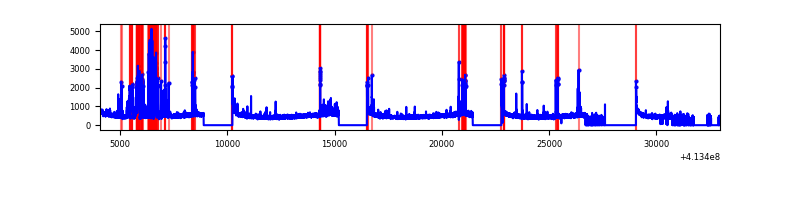 |
| B | 28892 | 21075 | 223 | 223 | 0.77% | 1.06% | 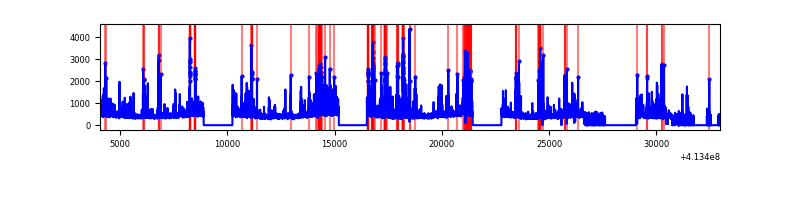 |
| C | 28882 | 20883 | 8049 | 8049 | 27.87% | 38.54% | 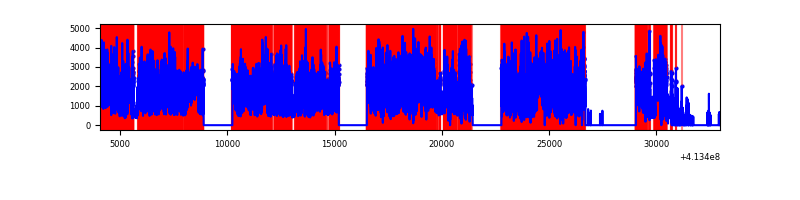 |
| D | 28900 | 21072 | 470 | 470 | 1.63% | 2.23% | 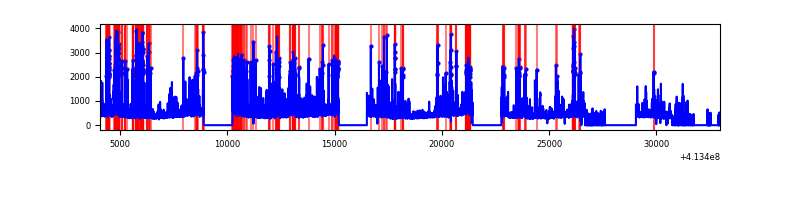 |
Top three noisy pixels from each quadrant. If the there are fewer than three noisy pixels in the level2.evt file, extra rows are filled as -1
| Pixel properties | Quadrant properties | ||||||
|---|---|---|---|---|---|---|---|
| Quadrant | DetID | PixID | Counts | Sigma | Mean | Median | Sigma |
| A | 10 | 83 | 1475935 | 3278.02 | 2224 | 2182 | 449.6 |
| A | 9 | 143 | 1435615 | 3188.34 | 2224 | 2182 | 449.6 |
| A | 13 | 248 | 152602 | 334.57 | 2224 | 2182 | 449.6 |
| B | 5 | 255 | 992078 | 2370.74 | 2199 | 2136 | 417.6 |
| B | 5 | 172 | 624478 | 1490.4 | 2199 | 2136 | 417.6 |
| B | 4 | 171 | 488442 | 1164.62 | 2199 | 2136 | 417.6 |
| C | 9 | 187 | 22559660 | 55132.83 | 1768 | 1777 | 409.2 |
| C | 15 | 208 | 5069563 | 12385.98 | 1768 | 1777 | 409.2 |
| C | 15 | 214 | 711535 | 1734.69 | 1768 | 1777 | 409.2 |
| D | 12 | 227 | 991651 | 1889.24 | 2138 | 2074 | 523.8 |
| D | 2 | 249 | 838718 | 1597.27 | 2138 | 2074 | 523.8 |
| D | 13 | 249 | 748380 | 1424.8 | 2138 | 2074 | 523.8 |
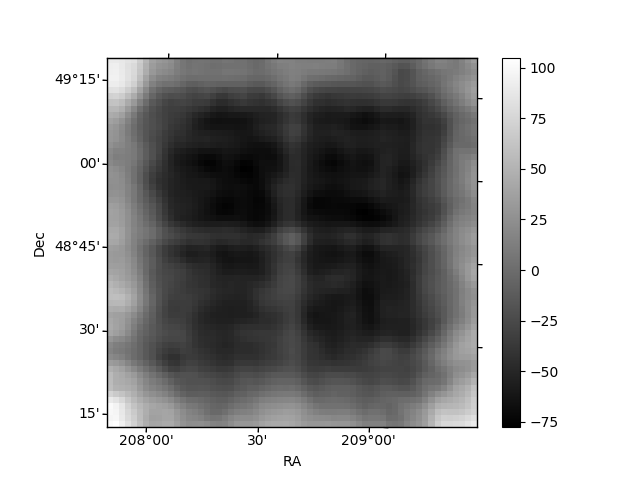
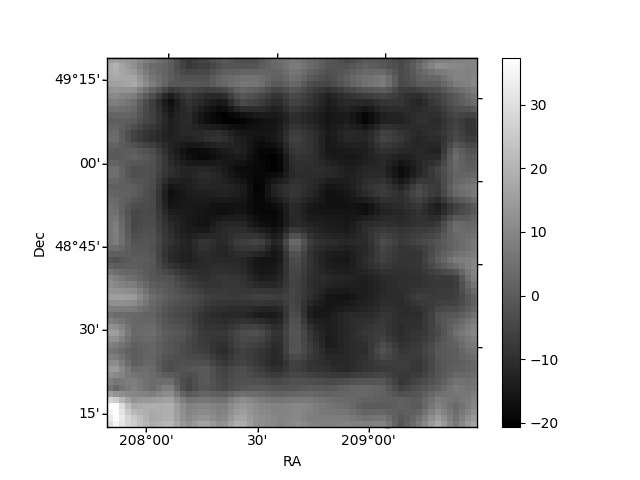
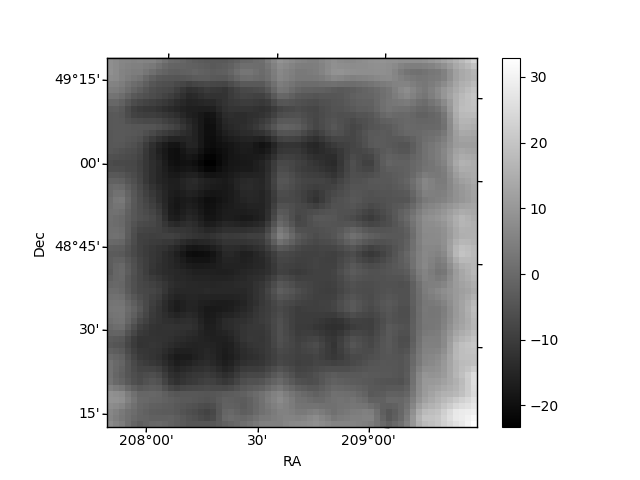
Histogram calculated using DETX and DETY for each event in the final _common_clean file
| Quadrant A | 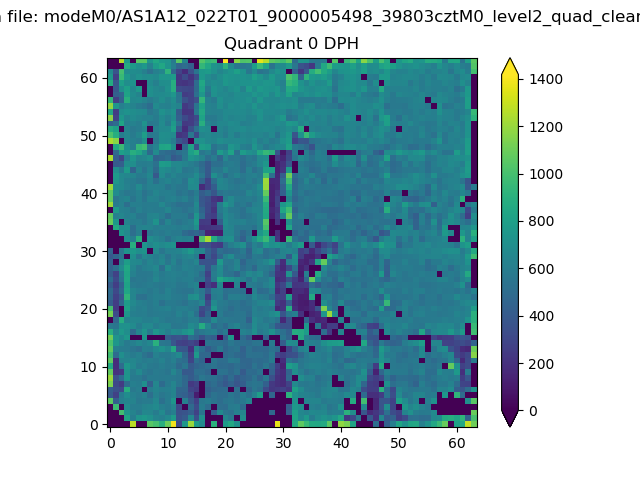 |
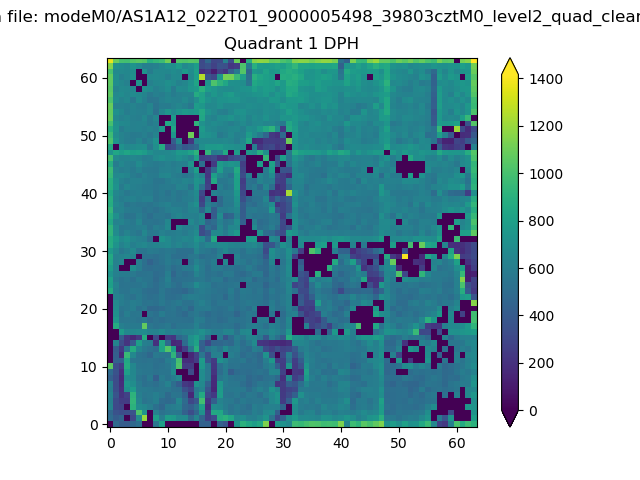 |
Quadrant B |
|---|---|---|---|
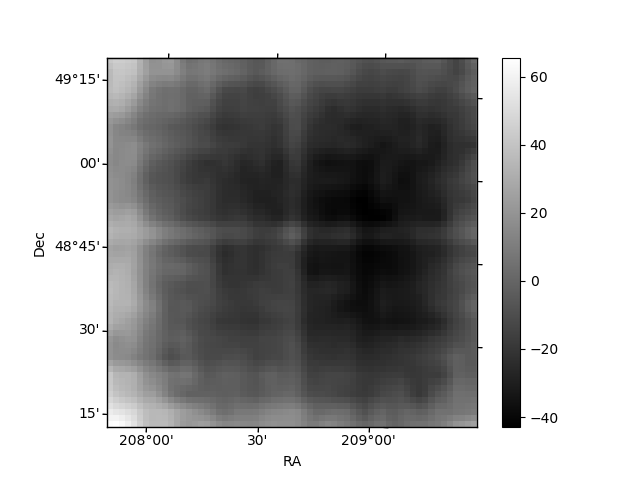
| Quadrant D | 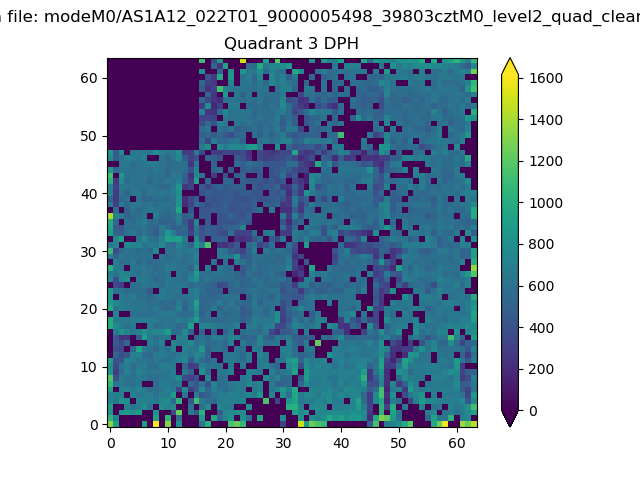 |
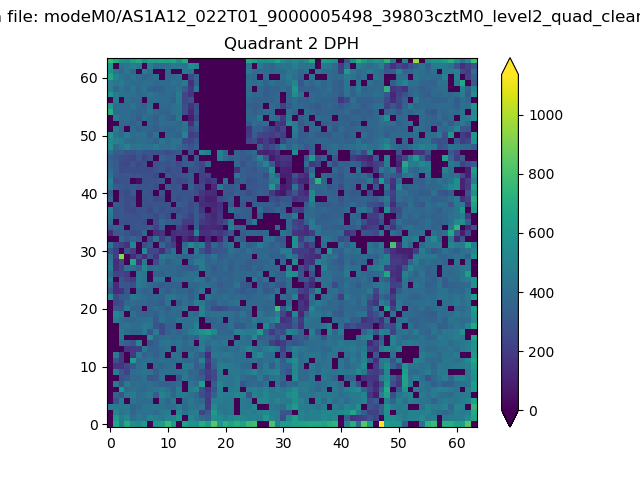 |
Quadrant C |
| Plot type | Count rate plots | Images |
|---|---|---|
| Comparison with Poisson distribution Blue bars denote a histogram of data divided into 1 sec bins. Red curve is a Poisson curve with rate = median count rate of data. |
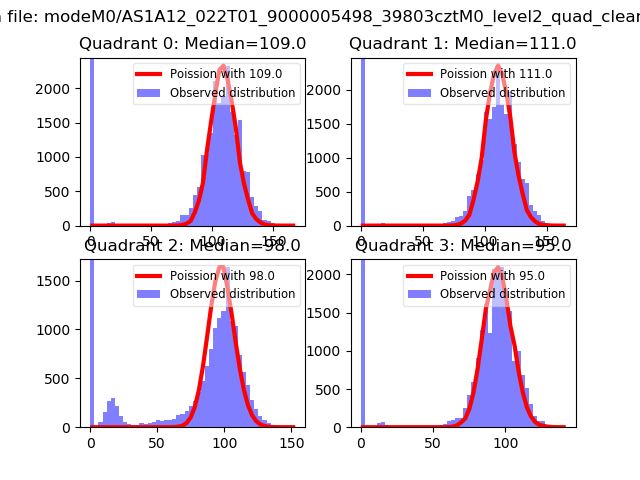 |
 |
| Quadrant-wise count rates Data is divided into 100 sec bins |
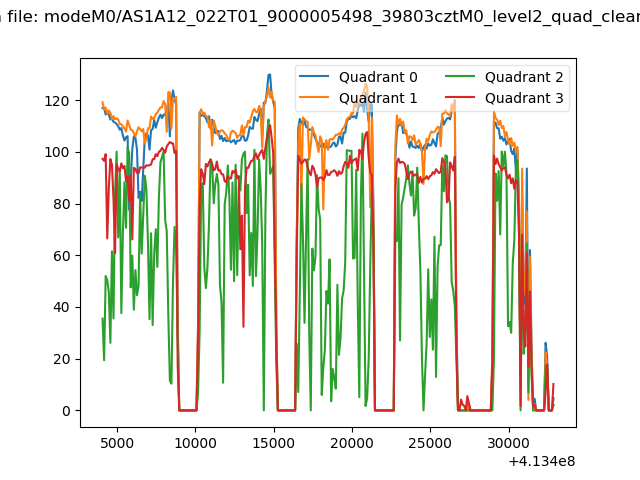 |
|
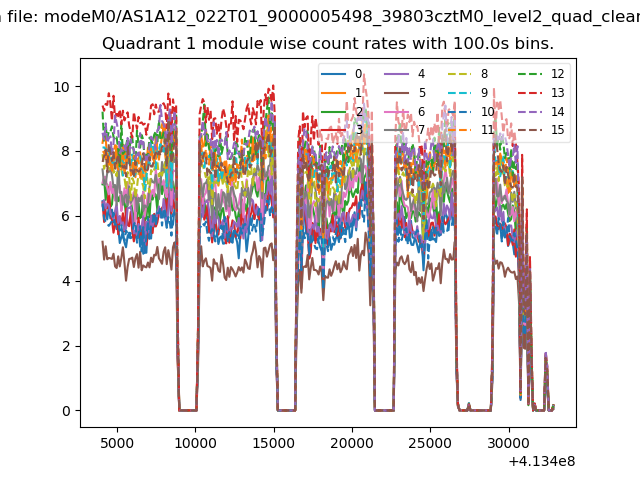
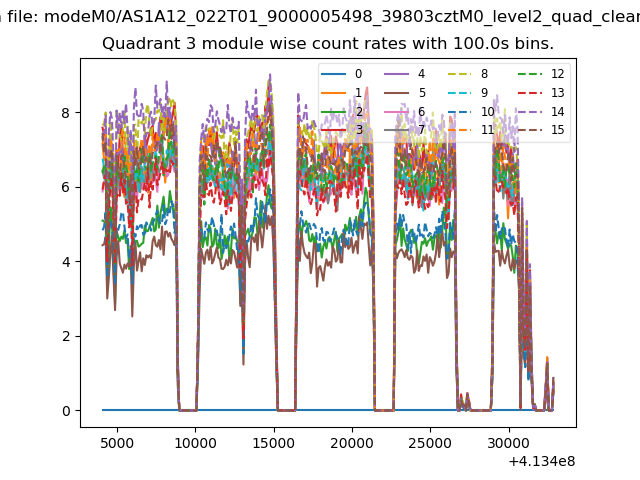
| Module-wise count rates for Quadrant A Data is divided into 100 sec bins |
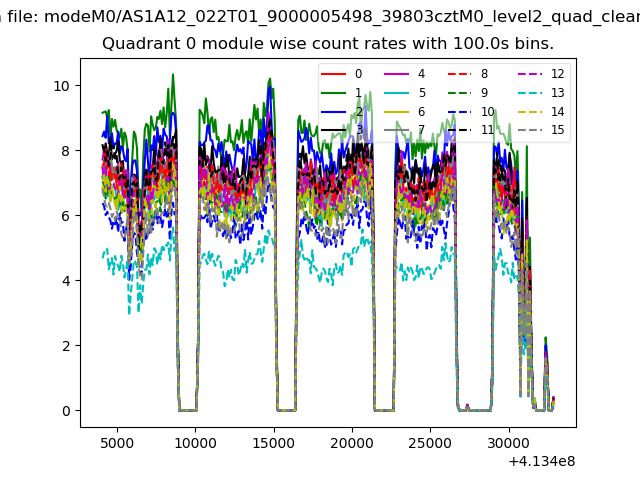 |
 |
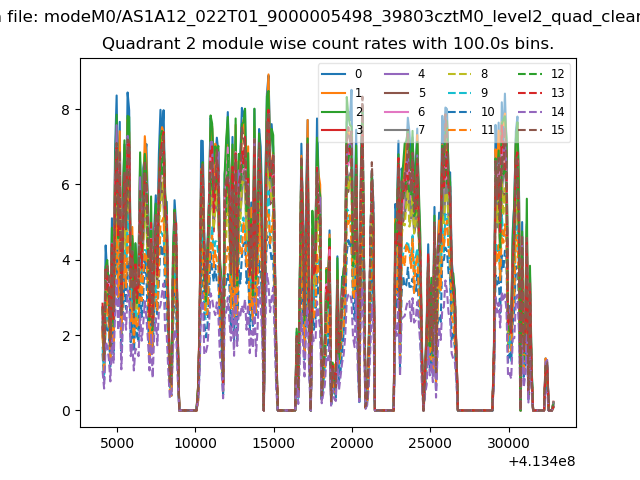
| Module-wise count rates for Quadrant B Data is divided into 100 sec bins |
 |
 |
| Module-wise count rates for Quadrant C Data is divided into 100 sec bins |
 |
 |
| Module-wise count rates for Quadrant D Data is divided into 100 sec bins |
 |
 |
| Parameter | Plot |
|---|---|
| CZT HV Monitor | 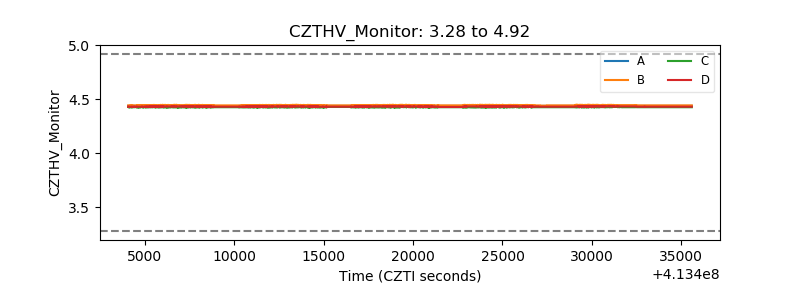 |
| D_VDD | 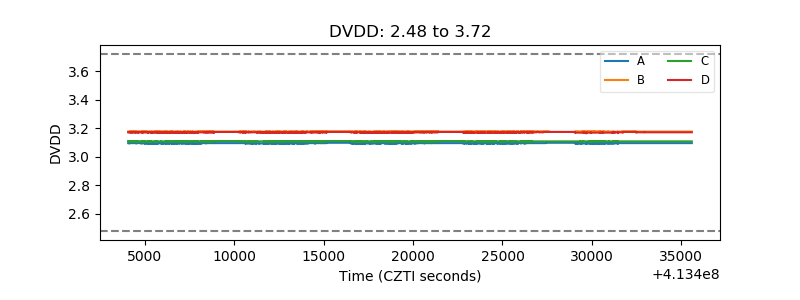 |
| Temperature 1 | 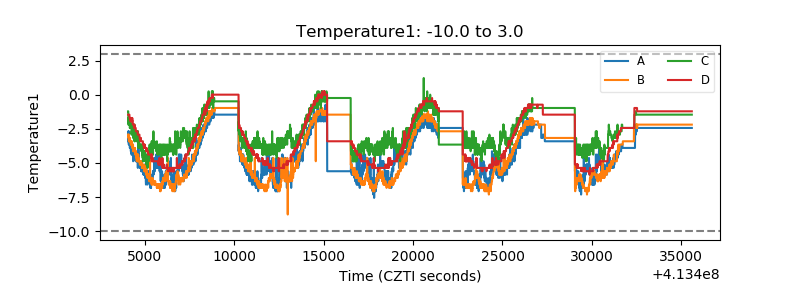 |
| Veto HV Monitor | 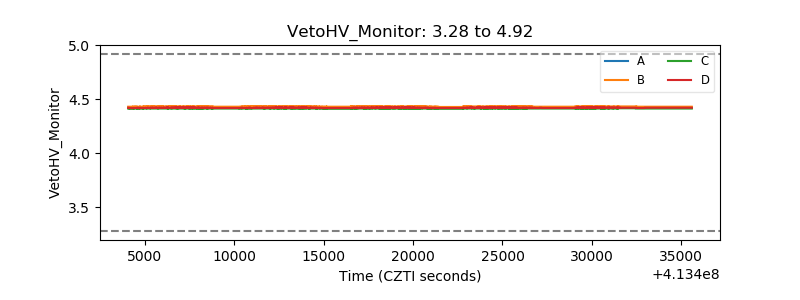 |
| Veto LLD | 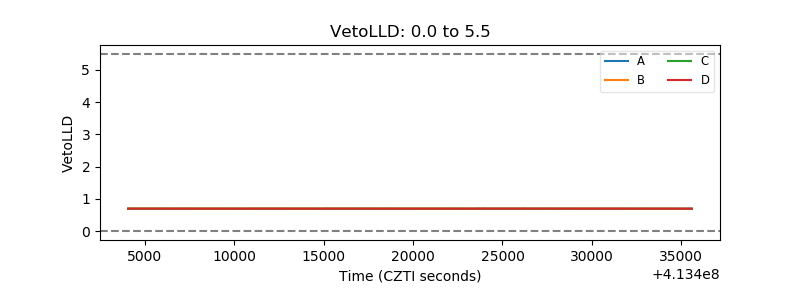 |
| Alpha Counter | 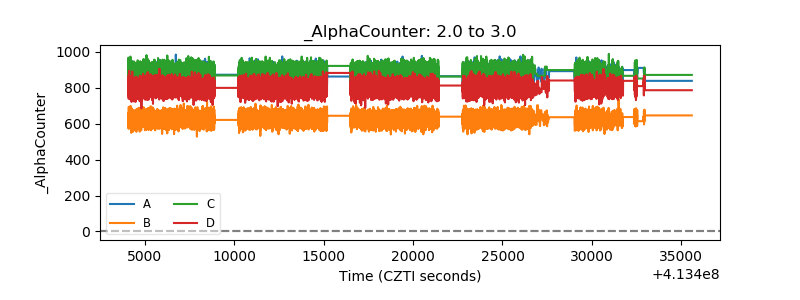 |
| _CPM_Rate | 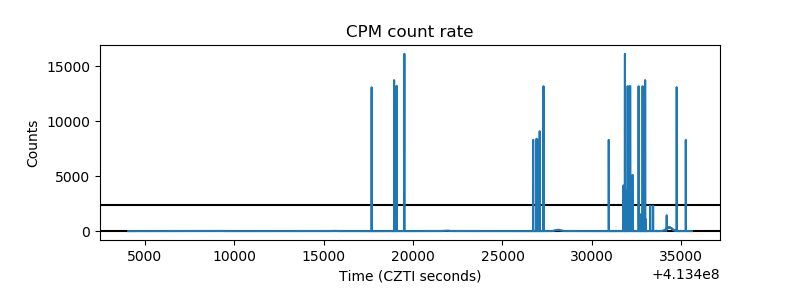 |
| CZT Counter | 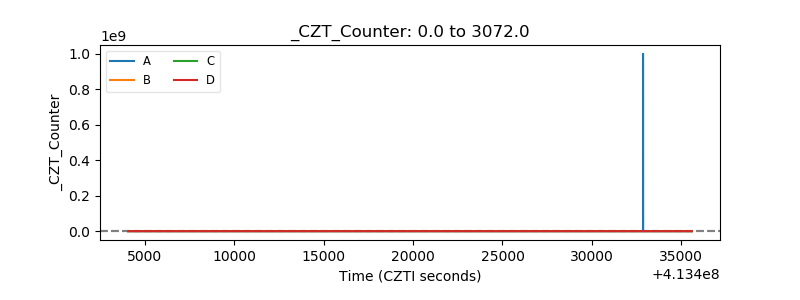 |
| +2.5 Volts monitor | 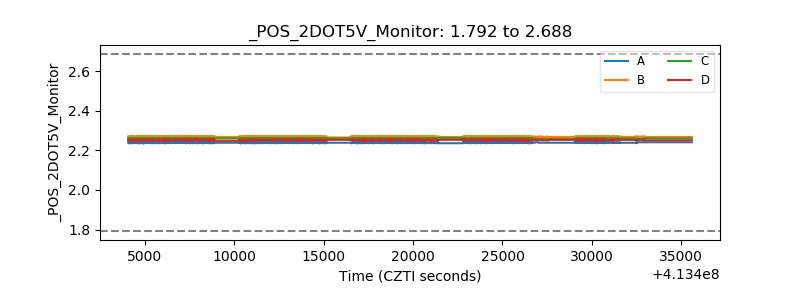 |
| +5 Volts monitor | 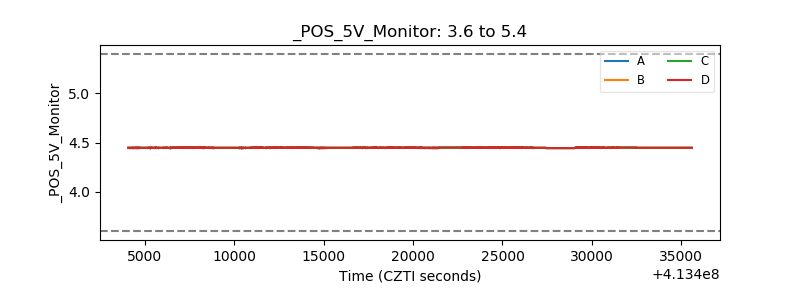 |
| _ROLL_ROT | 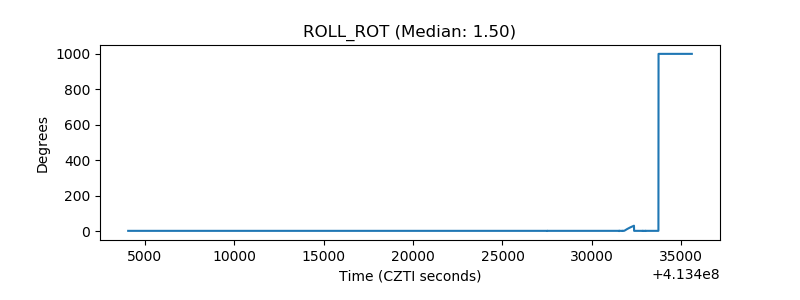 |
| _Roll_DEC | 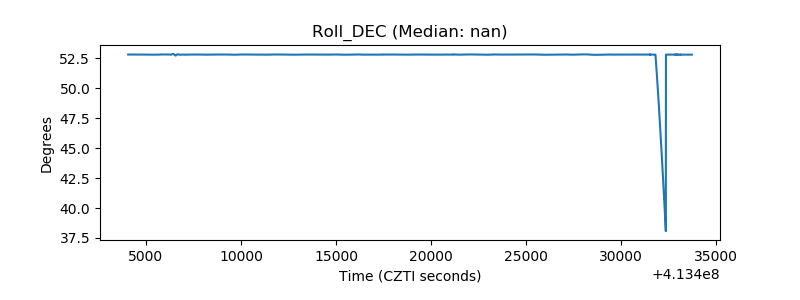 |
| _Roll_RA | 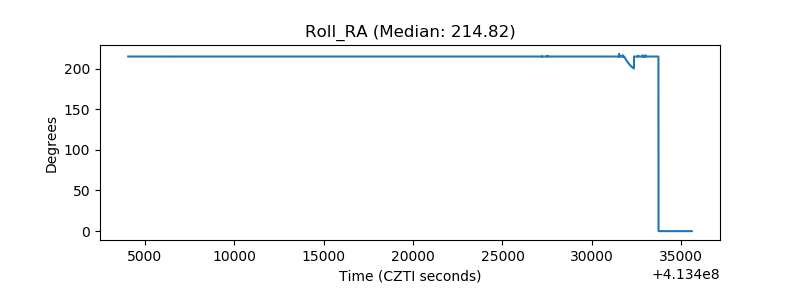 |
| Veto Counter | 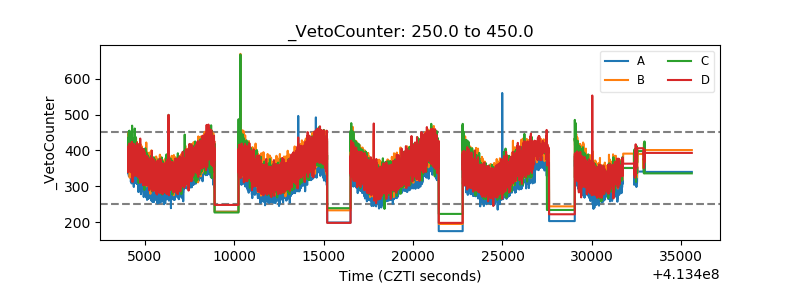 |