| Param | Original file | Final file |
|---|---|---|
| Filename | modeM0/AS1A12_022T01_9000005498_39806cztM0_level2.fits | modeM0/AS1A12_022T01_9000005498_39806cztM0_level2_quad_clean.evt |
| Size (bytes) | 477,959,040 | 78,183,360 |
| Size | 455.8 MB | 74.6 MB |
| Events in quadrant A | 2,969,270 | 583,762 |
| Events in quadrant B | 2,915,212 | 591,419 |
| Events in quadrant C | 8,556,433 | 285,736 |
| Events in quadrant D | 2,832,635 | 528,906 |
| Mode M0 | |||
|---|---|---|---|
| Quadrant | BADHDUFLAG | Total packets | Discarded packets |
| A | 0 | 17934 | 5526 |
| B | 0 | 18282 | 5798 |
| C | 0 | 43166 | 14342 |
| D | 0 | 18110 | 5611 |
| Mode M9 | |||
|---|---|---|---|
| Quadrant | BADHDUFLAG | Total packets | Discarded packets |
| A | 0 | 26 | 9 |
| B | 0 | 28 | 12 |
| C | 0 | 39 | 22 |
| D | 0 | 36 | 18 |
| Mode SS | |||
|---|---|---|---|
| Quadrant | BADHDUFLAG | Total packets | Discarded packets |
| A | 0 | 166 | 55 |
| B | 0 | 157 | 48 |
| C | 0 | 173 | 58 |
| D | 0 | 164 | 44 |
| Quadrant | Total seconds | Saturated seconds | Saturation percentage |
|---|---|---|---|
| A | 5504 | 57 | 1.035610% |
| B | 5461 | 98 | 1.794543% |
| C | 5018 | 2409 | 48.007174% |
| D | 5500 | 75 | 1.363636% |
Noise dominated data is calculated using 1-second bins in cleaned event files. If a bin has >2000 counts, and if more than 50% of those come from <1% of pixels, then it is considered to be noise-dominated and hence unusable.
| Quadrant | # 1 sec bins | Bins with >0 counts | Bins with >2000 counts | High rate bins dominated by noise | Noise dominated (total time) | Noise dominated (detector-on time) | Marked lightcurve |
|---|---|---|---|---|---|---|---|
| A | 13642 | 5897 | 25 | 25 | 0.18% | 0.42% | 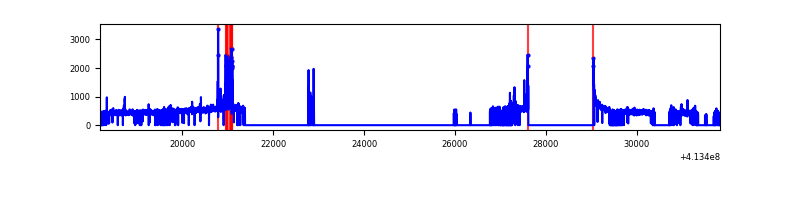 |
| B | 13606 | 5864 | 35 | 35 | 0.26% | 0.60% | 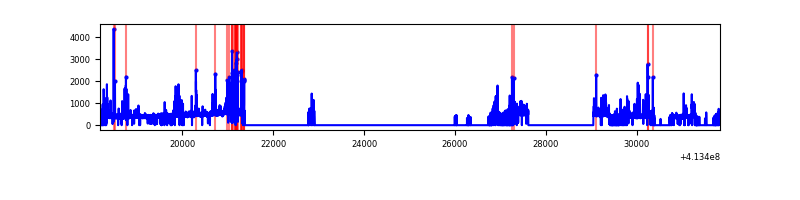 |
| C | 13583 | 5504 | 1942 | 1942 | 14.30% | 35.28% | 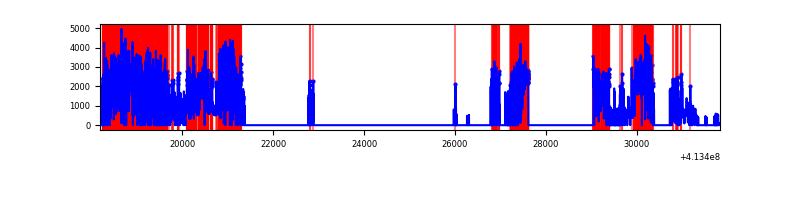 |
| D | 13612 | 5869 | 41 | 41 | 0.30% | 0.70% | 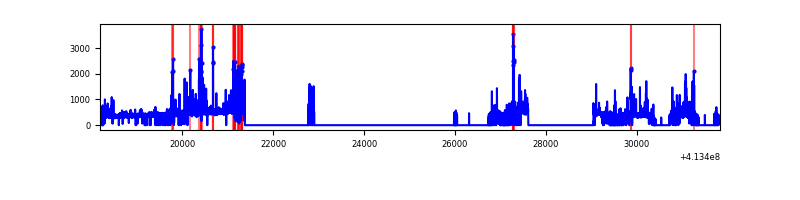 |
Top three noisy pixels from each quadrant. If the there are fewer than three noisy pixels in the level2.evt file, extra rows are filled as -1
| Pixel properties | Quadrant properties | ||||||
|---|---|---|---|---|---|---|---|
| Quadrant | DetID | PixID | Counts | Sigma | Mean | Median | Sigma |
| A | 10 | 83 | 403829 | 3289.96 | 605 | 591 | 122.6 |
| A | 13 | 248 | 152177 | 1236.77 | 605 | 591 | 122.6 |
| A | 2 | 79 | 28719 | 229.49 | 605 | 591 | 122.6 |
| B | 5 | 172 | 248149 | 2144.43 | 590 | 574 | 115.5 |
| B | 5 | 255 | 136420 | 1176.67 | 590 | 574 | 115.5 |
| B | 4 | 171 | 121573 | 1048.06 | 590 | 574 | 115.5 |
| C | 9 | 187 | 5331648 | 54638.47 | 413 | 415 | 97.6 |
| C | 15 | 208 | 1431494 | 14666.77 | 413 | 415 | 97.6 |
| C | 15 | 214 | 165330 | 1690.17 | 413 | 415 | 97.6 |
| D | 2 | 249 | 235318 | 1608.91 | 585 | 565 | 145.9 |
| D | 13 | 249 | 119000 | 811.71 | 585 | 565 | 145.9 |
| D | 12 | 227 | 113339 | 772.91 | 585 | 565 | 145.9 |
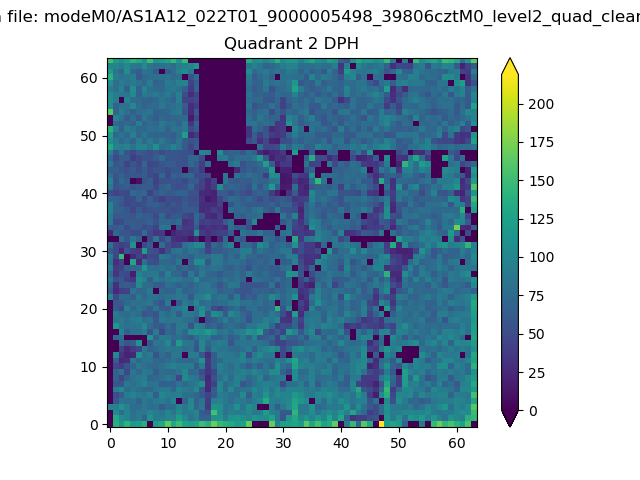
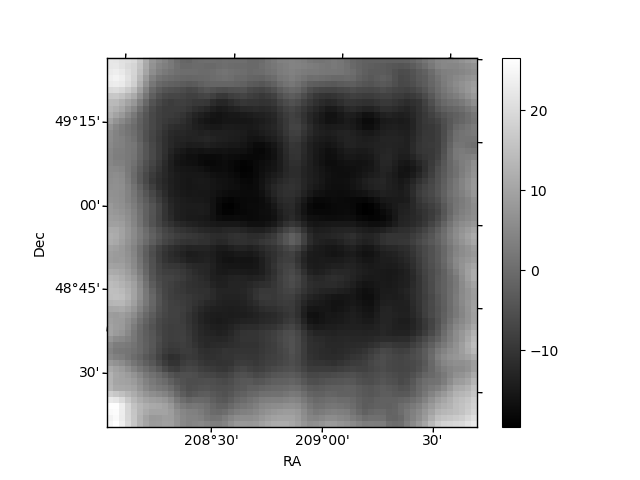
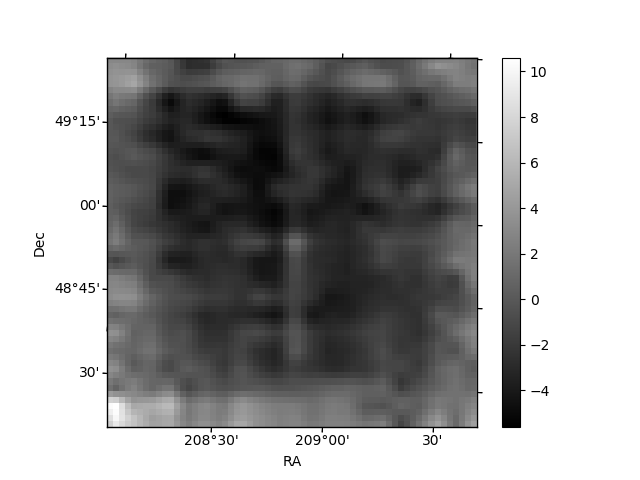
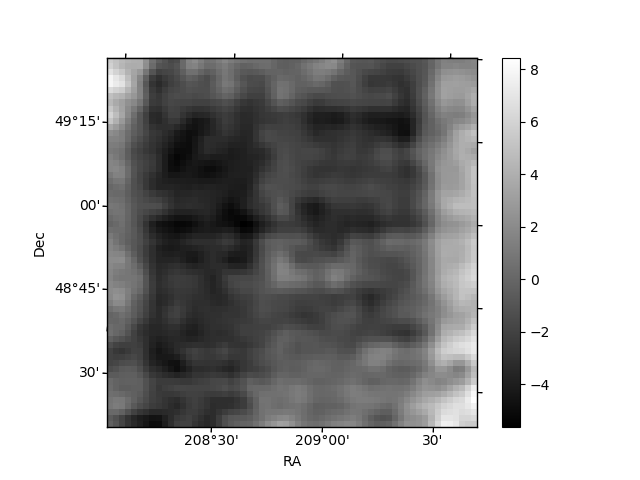
Histogram calculated using DETX and DETY for each event in the final _common_clean file
| Quadrant A | 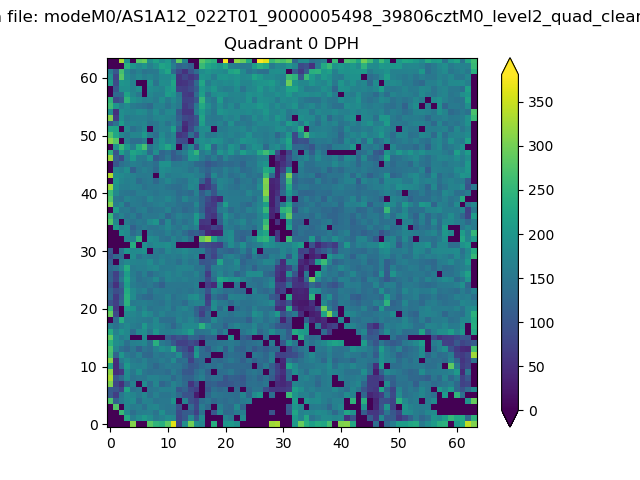 |
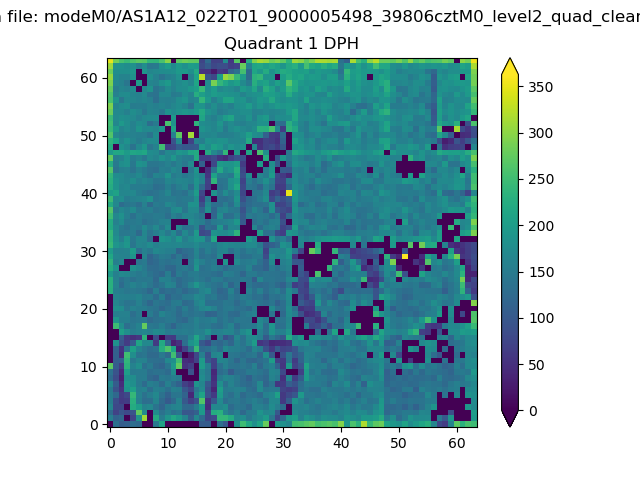 |
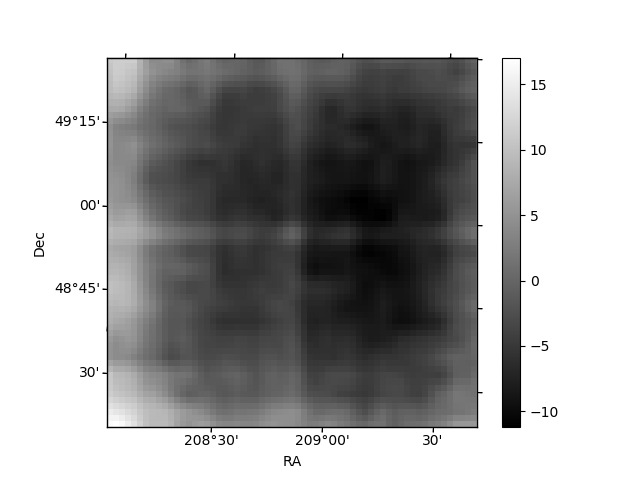
Quadrant B |
|---|---|---|---|
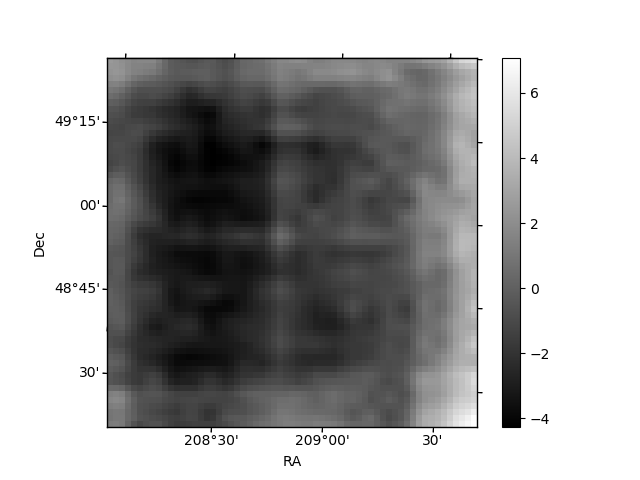
| Quadrant D | 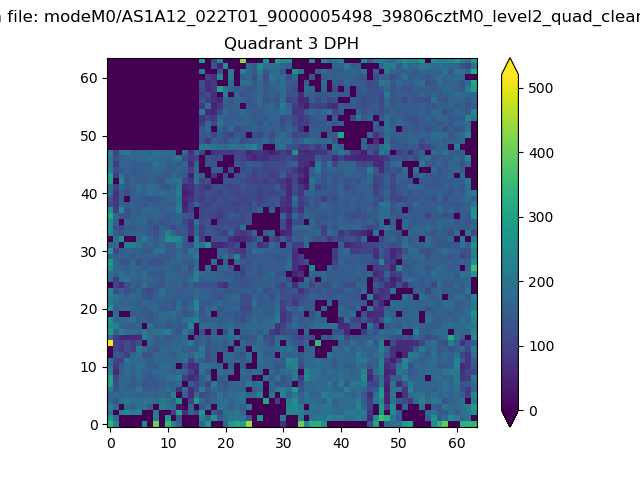 |
 |
Quadrant C |
| Plot type | Count rate plots | Images |
|---|---|---|
| Comparison with Poisson distribution Blue bars denote a histogram of data divided into 1 sec bins. Red curve is a Poisson curve with rate = median count rate of data. |
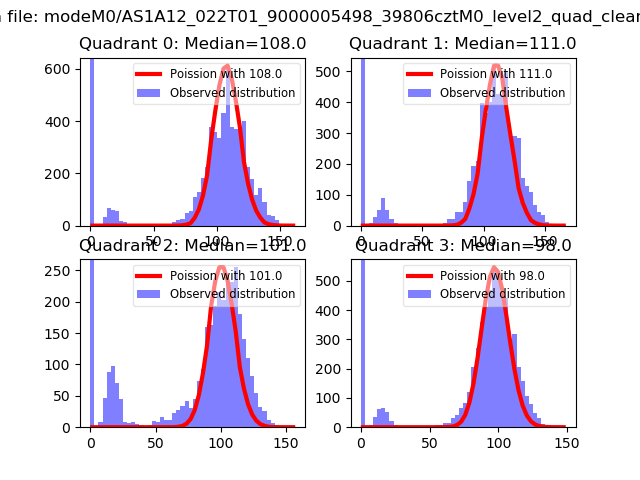 |
 |
| Quadrant-wise count rates Data is divided into 100 sec bins |
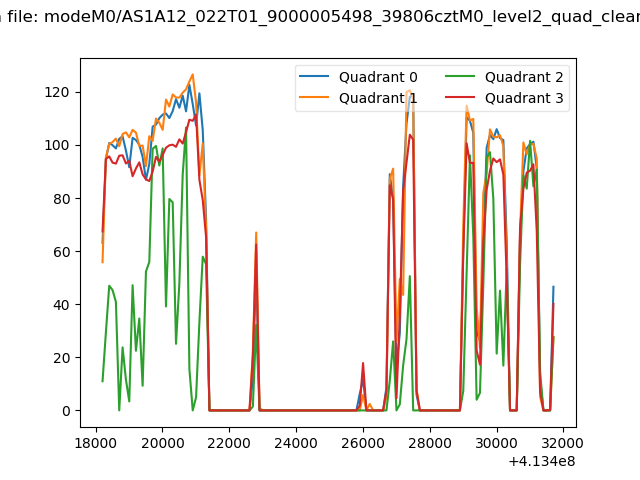 |
|
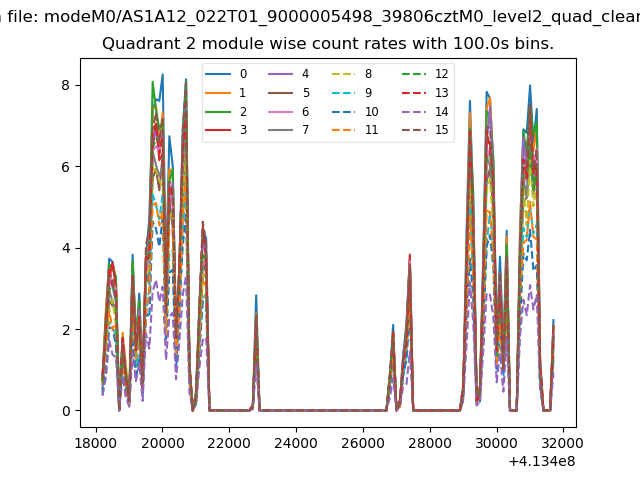
| Module-wise count rates for Quadrant A Data is divided into 100 sec bins |
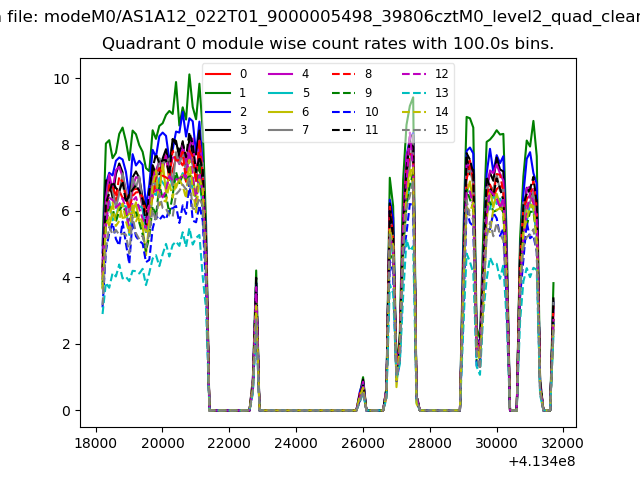 |
 |
| Module-wise count rates for Quadrant B Data is divided into 100 sec bins |
 |
 |
| Module-wise count rates for Quadrant C Data is divided into 100 sec bins |
 |
 |
| Module-wise count rates for Quadrant D Data is divided into 100 sec bins |
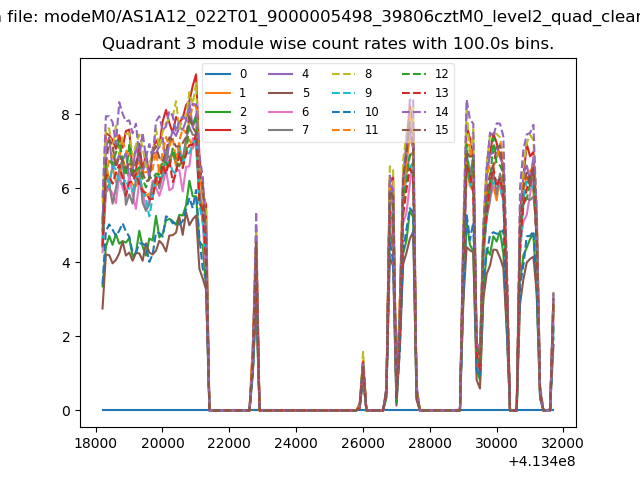 |
 |
| Parameter | Plot |
|---|---|
| CZT HV Monitor | 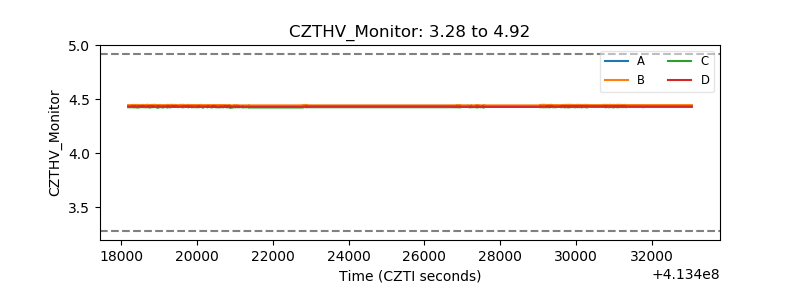 |
| D_VDD | 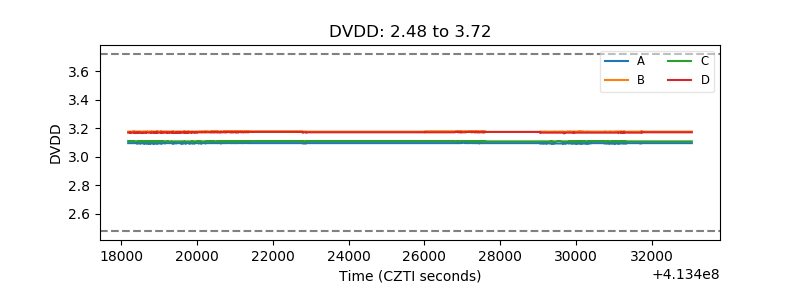 |
| Temperature 1 | 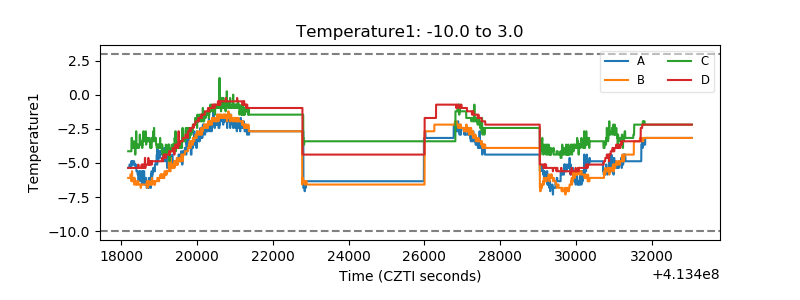 |
| Veto HV Monitor | 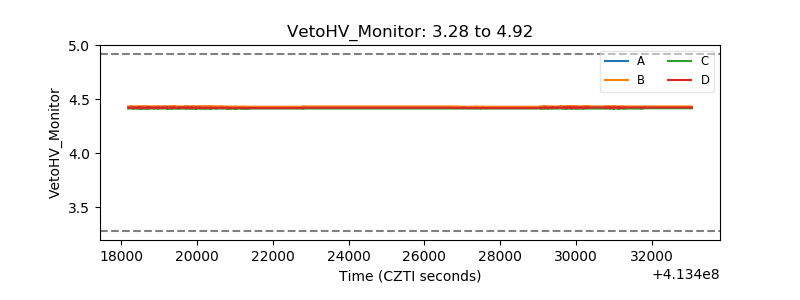 |
| Veto LLD | 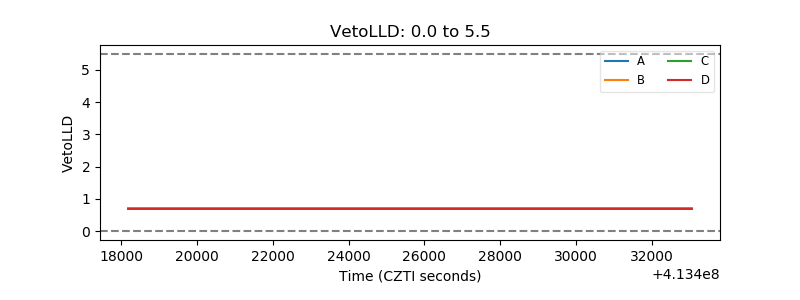 |
| Alpha Counter | 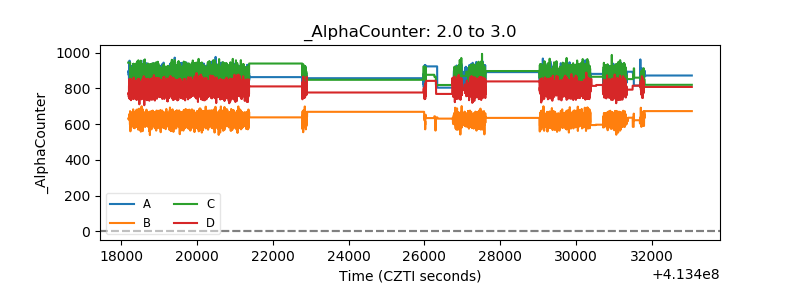 |
| _CPM_Rate | 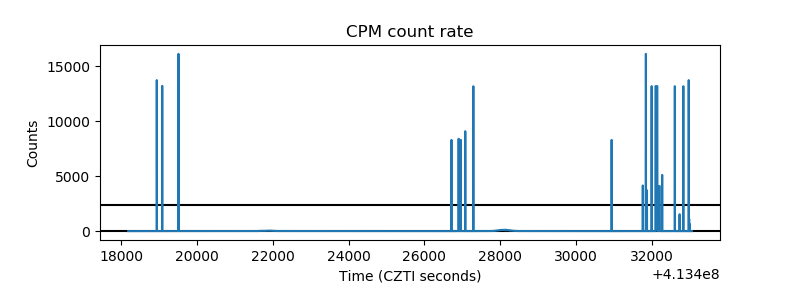 |
| CZT Counter | 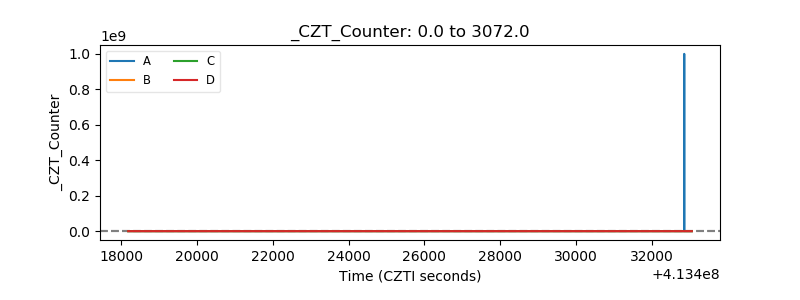 |
| +2.5 Volts monitor | 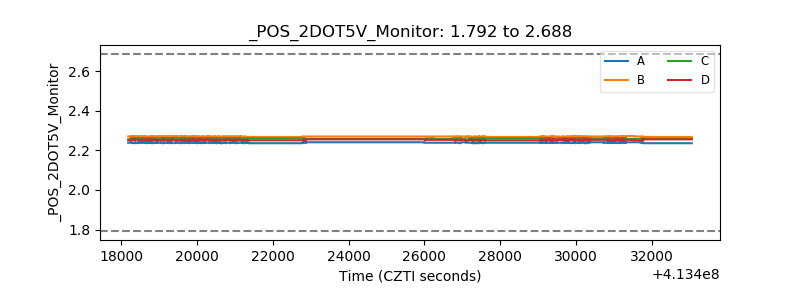 |
| +5 Volts monitor | 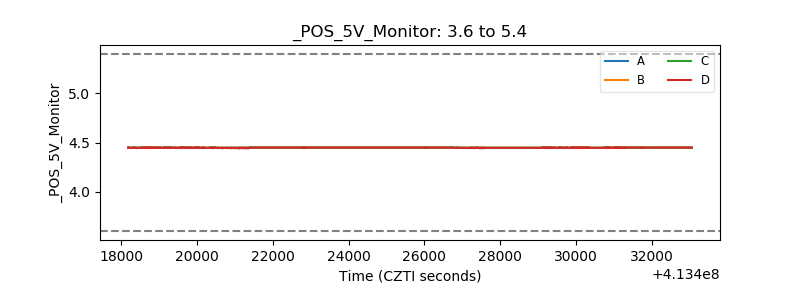 |
| _ROLL_ROT | 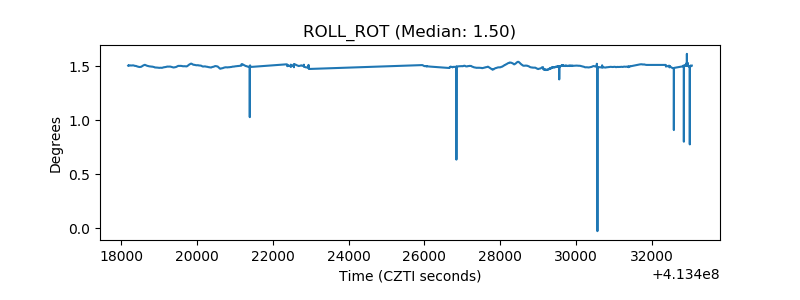 |
| _Roll_DEC | 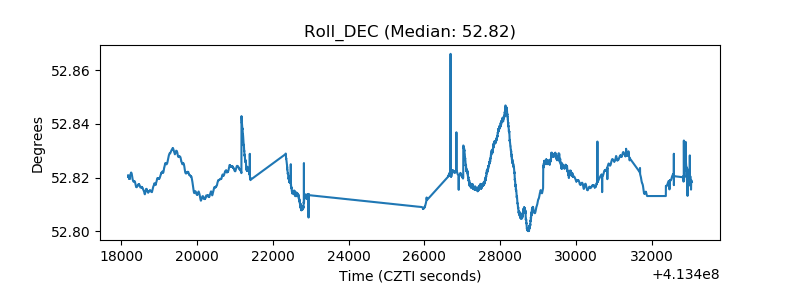 |
| _Roll_RA | 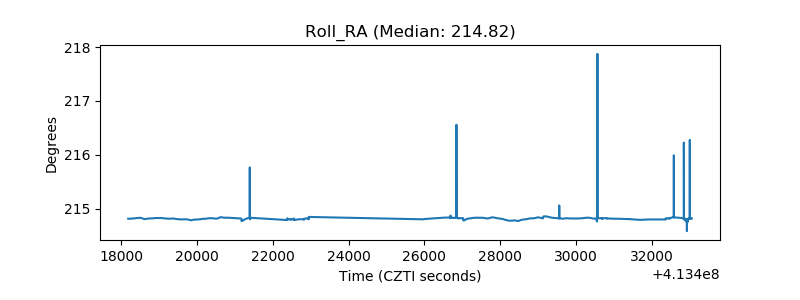 |
| Veto Counter | 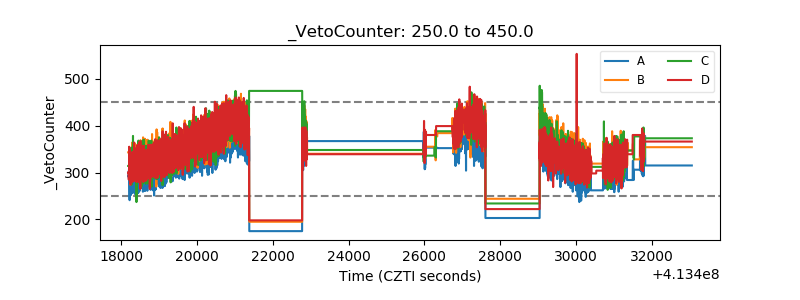 |