| Param | Original file | Final file |
|---|---|---|
| Filename | modeM0/AS1A12_022T01_9000005498_39807cztM0_level2.fits | modeM0/AS1A12_022T01_9000005498_39807cztM0_level2_quad_clean.evt |
| Size (bytes) | 439,761,600 | 85,296,960 |
| Size | 419.4 MB | 81.3 MB |
| Events in quadrant A | 2,943,921 | 616,679 |
| Events in quadrant B | 2,613,274 | 621,205 |
| Events in quadrant C | 7,443,188 | 448,530 |
| Events in quadrant D | 2,884,752 | 541,535 |
| Mode M0 | |||
|---|---|---|---|
| Quadrant | BADHDUFLAG | Total packets | Discarded packets |
| A | 0 | 11803 | 69 |
| B | 0 | 11075 | 66 |
| C | 0 | 25883 | 254 |
| D | 0 | 11928 | 48 |
| Mode M9 | |||
|---|---|---|---|
| Quadrant | BADHDUFLAG | Total packets | Discarded packets |
| A | 0 | 19 | 0 |
| B | 0 | 19 | 0 |
| C | 0 | 19 | 0 |
| D | 0 | 19 | 0 |
| Mode SS | |||
|---|---|---|---|
| Quadrant | BADHDUFLAG | Total packets | Discarded packets |
| A | 0 | 104 | 2 |
| B | 0 | 104 | 0 |
| C | 0 | 104 | 0 |
| D | 0 | 104 | 0 |
| Quadrant | Total seconds | Saturated seconds | Saturation percentage |
|---|---|---|---|
| A | 5068 | 24 | 0.473560% |
| B | 5064 | 56 | 1.105845% |
| C | 5037 | 1381 | 27.417113% |
| D | 5076 | 61 | 1.201734% |
Noise dominated data is calculated using 1-second bins in cleaned event files. If a bin has >2000 counts, and if more than 50% of those come from <1% of pixels, then it is considered to be noise-dominated and hence unusable.
| Quadrant | # 1 sec bins | Bins with >0 counts | Bins with >2000 counts | High rate bins dominated by noise | Noise dominated (total time) | Noise dominated (detector-on time) | Marked lightcurve |
|---|---|---|---|---|---|---|---|
| A | 7041 | 5091 | 10 | 10 | 0.14% | 0.20% | 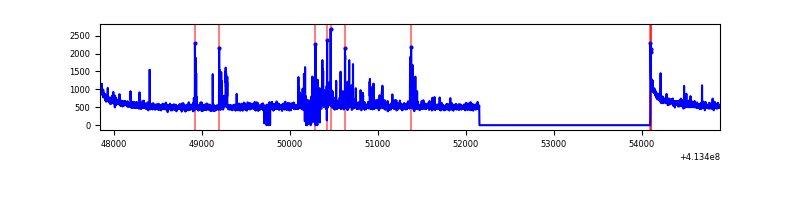 |
| B | 7041 | 5088 | 38 | 38 | 0.54% | 0.75% | 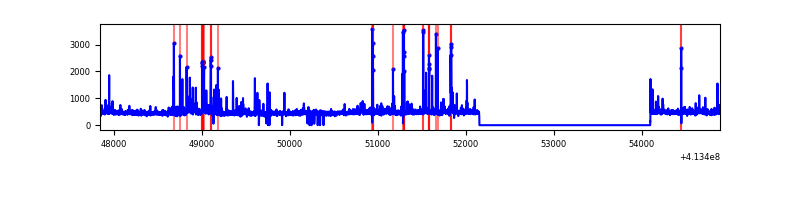 |
| C | 7041 | 5071 | 1319 | 1319 | 18.73% | 26.01% | 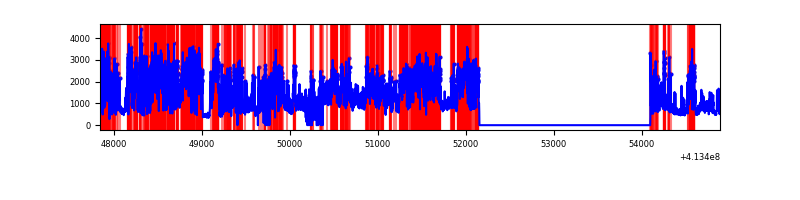 |
| D | 7041 | 5095 | 57 | 57 | 0.81% | 1.12% | 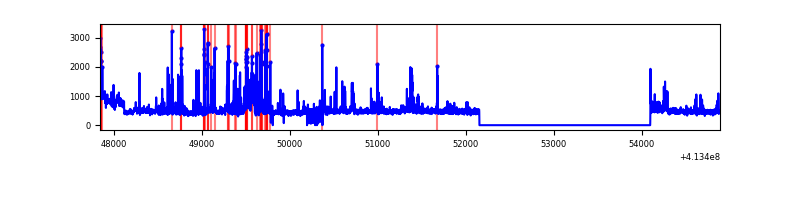 |
Top three noisy pixels from each quadrant. If the there are fewer than three noisy pixels in the level2.evt file, extra rows are filled as -1
| Pixel properties | Quadrant properties | ||||||
|---|---|---|---|---|---|---|---|
| Quadrant | DetID | PixID | Counts | Sigma | Mean | Median | Sigma |
| A | 10 | 83 | 433187 | 3673.44 | 585 | 575 | 117.8 |
| A | 13 | 248 | 97666 | 824.43 | 585 | 575 | 117.8 |
| A | 9 | 143 | 79586 | 670.91 | 585 | 575 | 117.8 |
| B | 5 | 172 | 214933 | 1948.14 | 570 | 554 | 110.0 |
| B | 4 | 171 | 62541 | 563.3 | 570 | 554 | 110.0 |
| B | 0 | 190 | 28335 | 252.46 | 570 | 554 | 110.0 |
| C | 9 | 187 | 4106156 | 35773.52 | 497 | 500 | 114.8 |
| C | 15 | 208 | 1162685 | 10126.38 | 497 | 500 | 114.8 |
| C | 15 | 214 | 194301 | 1688.63 | 497 | 500 | 114.8 |
| D | 12 | 227 | 305407 | 2236.38 | 562 | 545 | 136.3 |
| D | 2 | 249 | 167302 | 1223.28 | 562 | 545 | 136.3 |
| D | 13 | 249 | 157149 | 1148.8 | 562 | 545 | 136.3 |
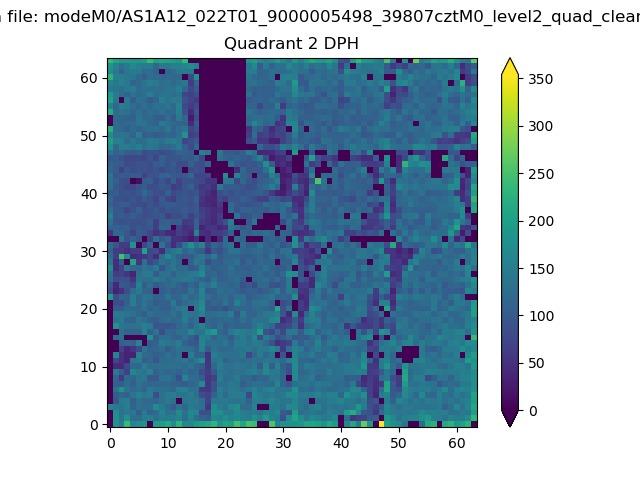
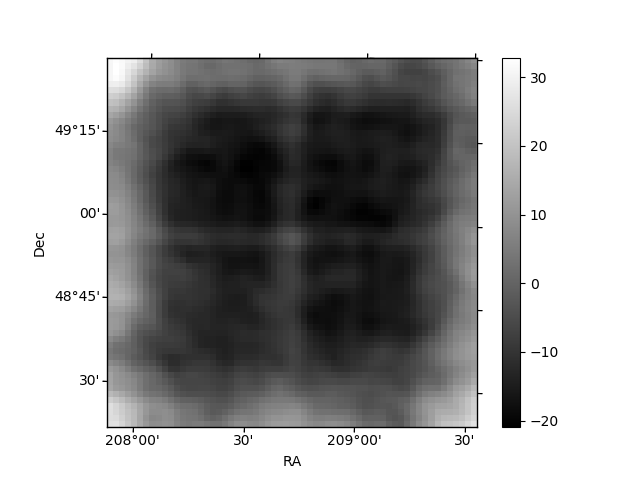
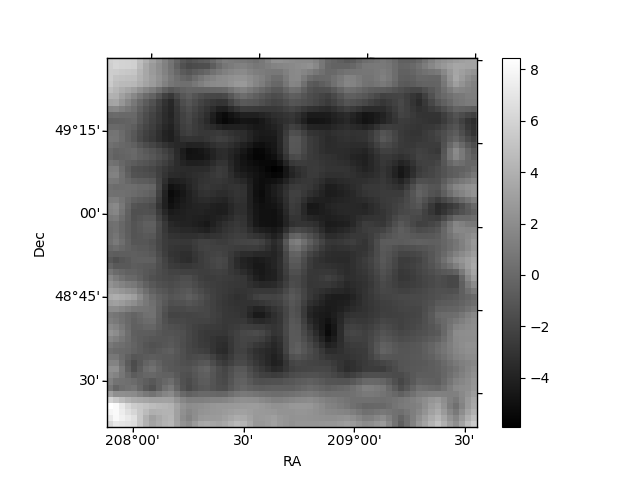
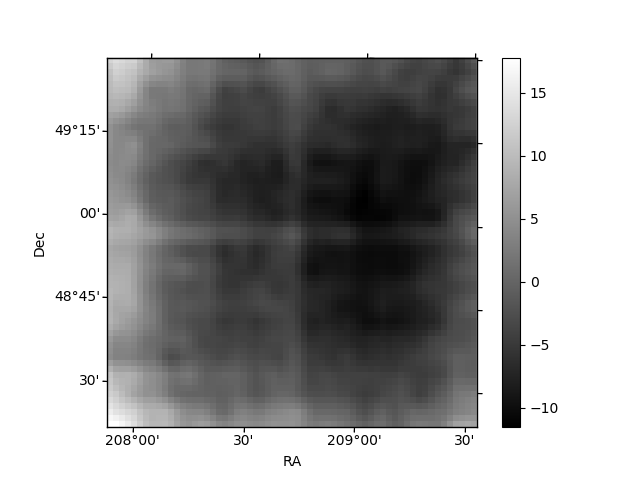
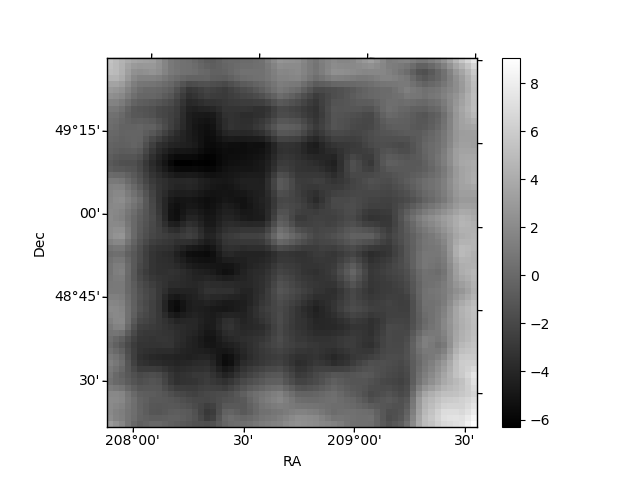
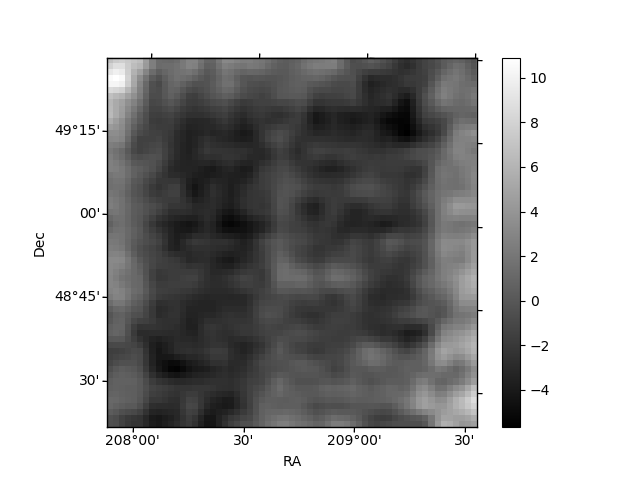
Histogram calculated using DETX and DETY for each event in the final _common_clean file
| Quadrant A | 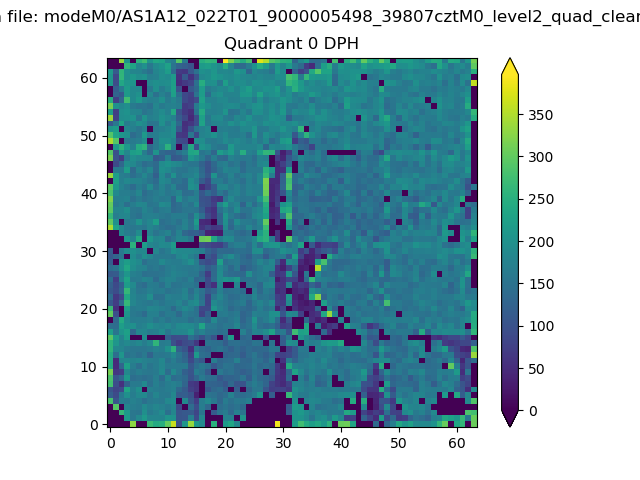 |
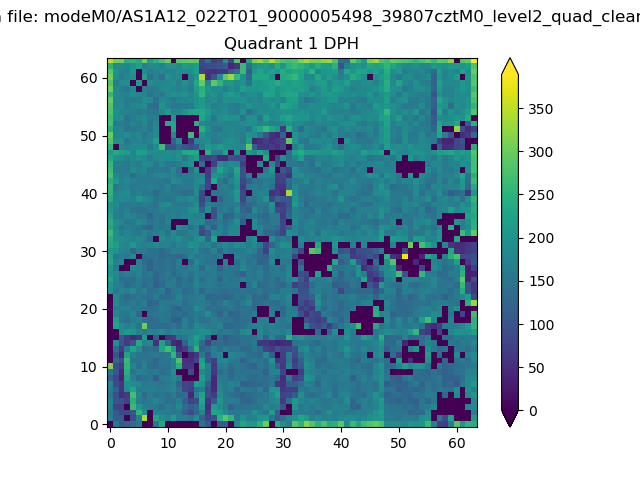 |
Quadrant B |
|---|---|---|---|
| Quadrant D | 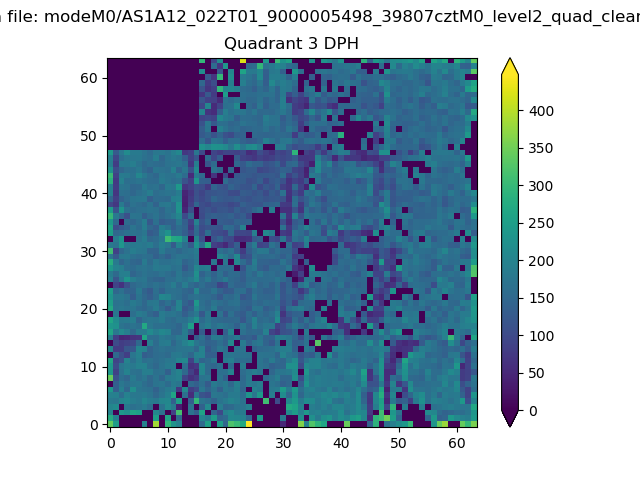 |
 |
Quadrant C |
| Plot type | Count rate plots | Images |
|---|---|---|
| Comparison with Poisson distribution Blue bars denote a histogram of data divided into 1 sec bins. Red curve is a Poisson curve with rate = median count rate of data. |
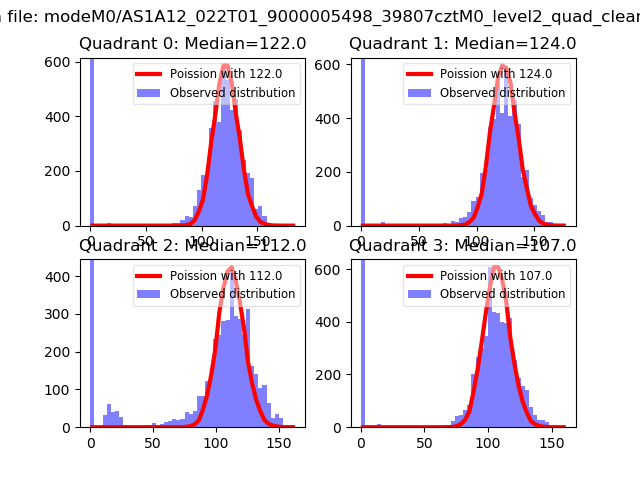 |
 |
| Quadrant-wise count rates Data is divided into 100 sec bins |
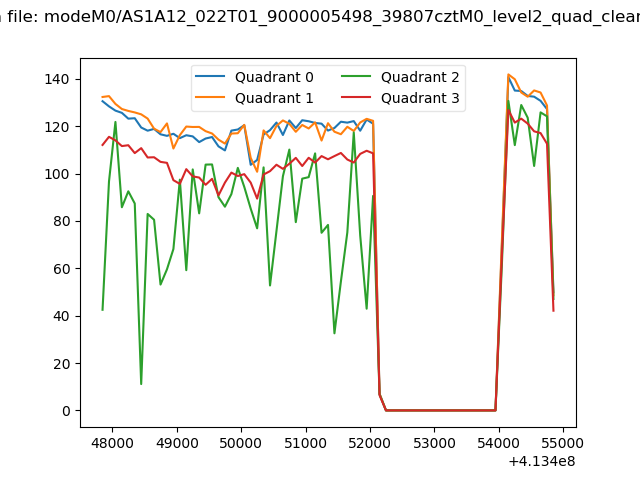 |
|
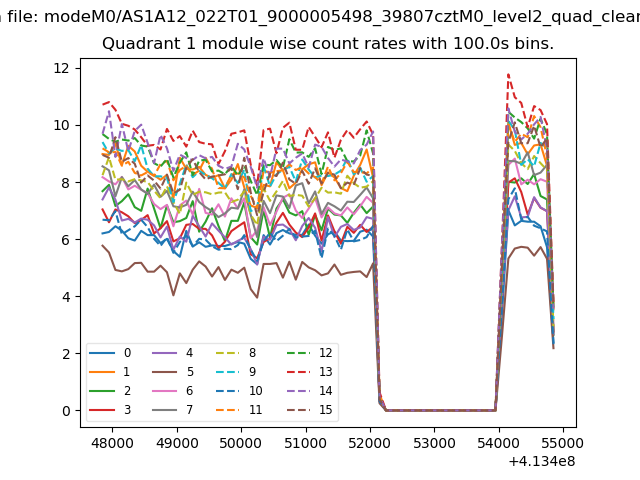
| Module-wise count rates for Quadrant A Data is divided into 100 sec bins |
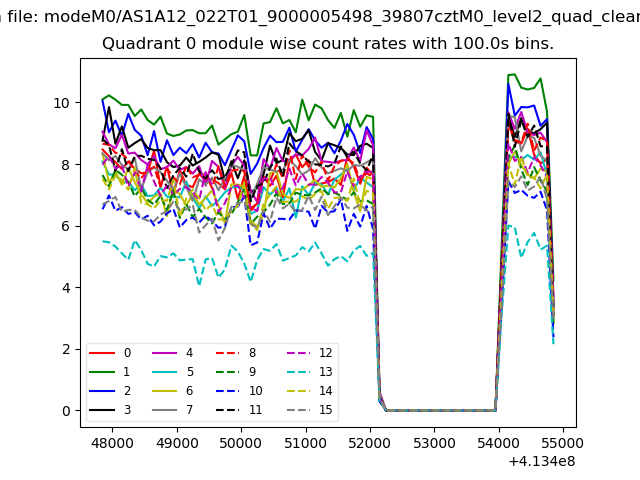 |
 |
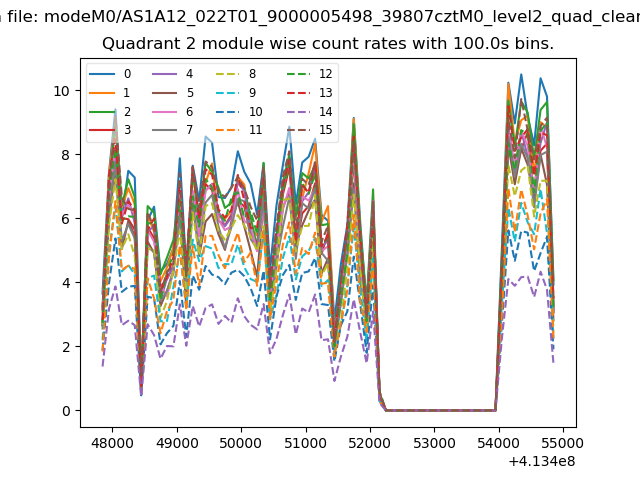
| Module-wise count rates for Quadrant B Data is divided into 100 sec bins |
 |
 |
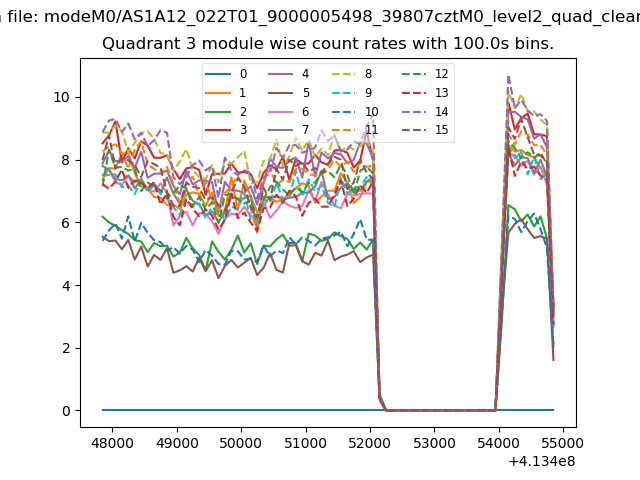
| Module-wise count rates for Quadrant C Data is divided into 100 sec bins |
 |
 |
| Module-wise count rates for Quadrant D Data is divided into 100 sec bins |
 |
 |
| Parameter | Plot |
|---|---|
| CZT HV Monitor | 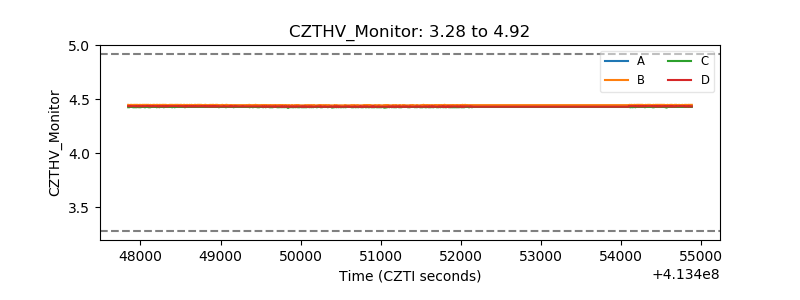 |
| D_VDD | 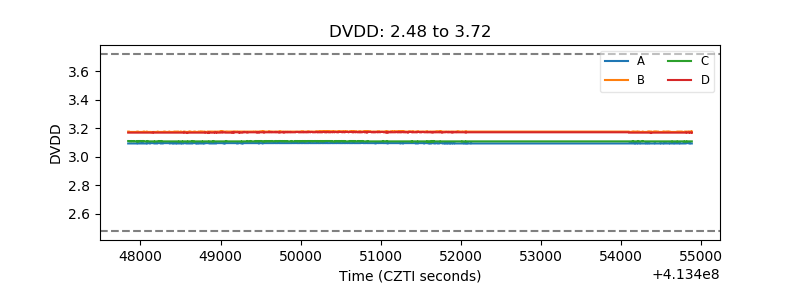 |
| Temperature 1 | 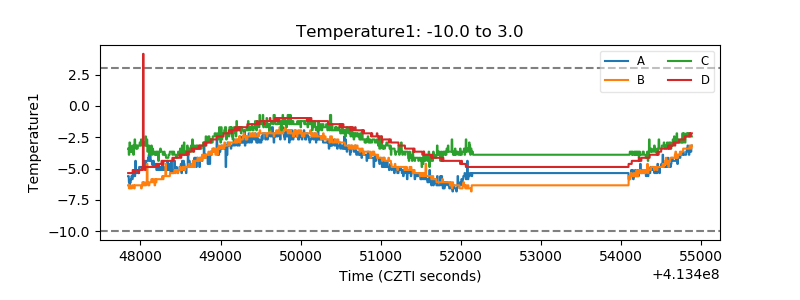 |
| Veto HV Monitor | 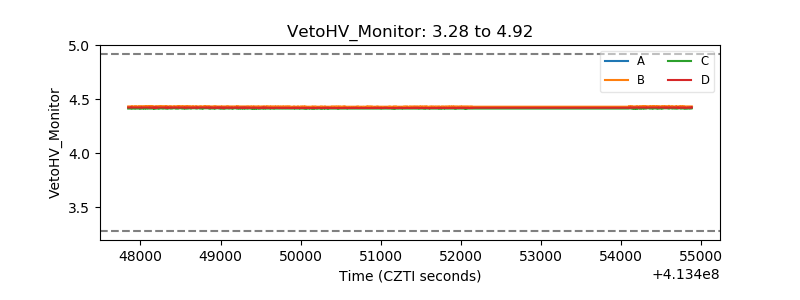 |
| Veto LLD | 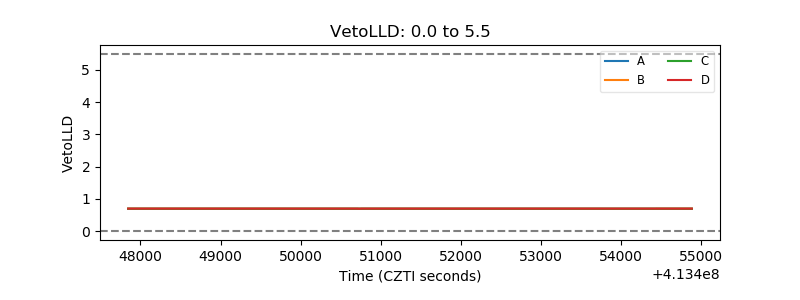 |
| Alpha Counter | 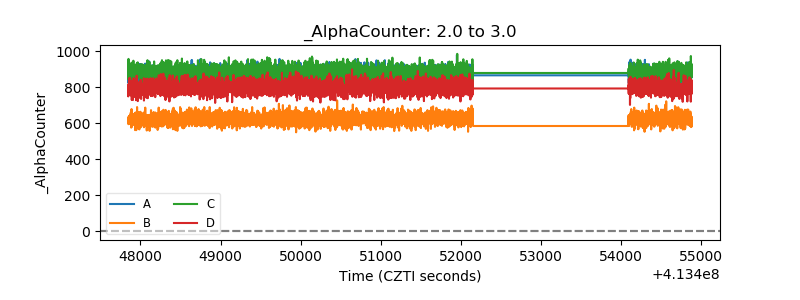 |
| _CPM_Rate | 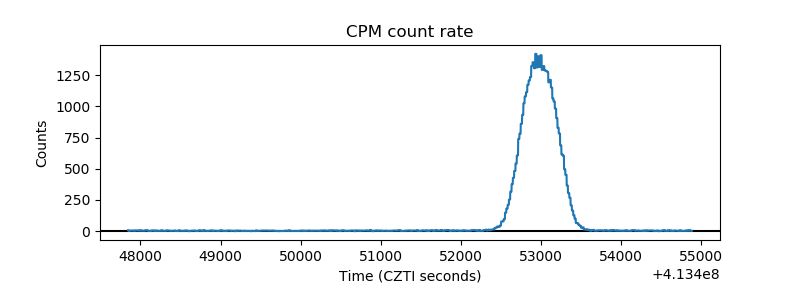 |
| CZT Counter | 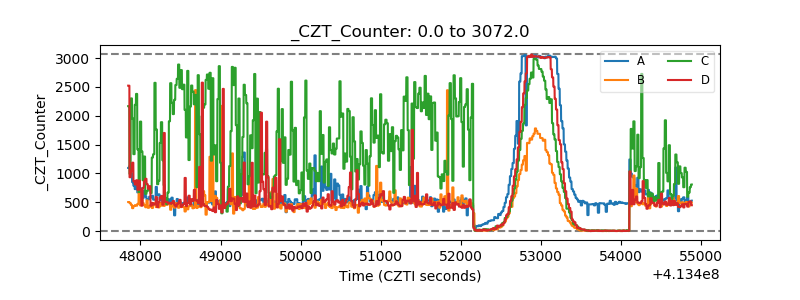 |
| +2.5 Volts monitor | 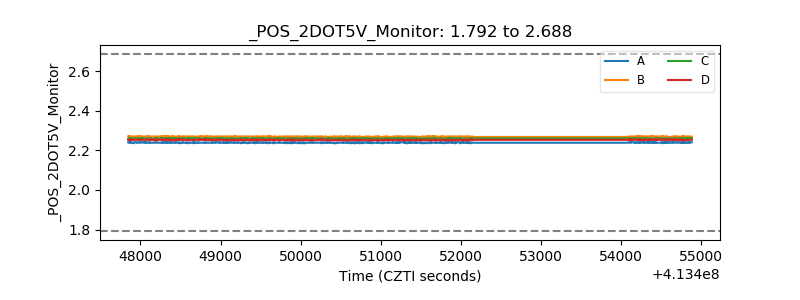 |
| +5 Volts monitor | 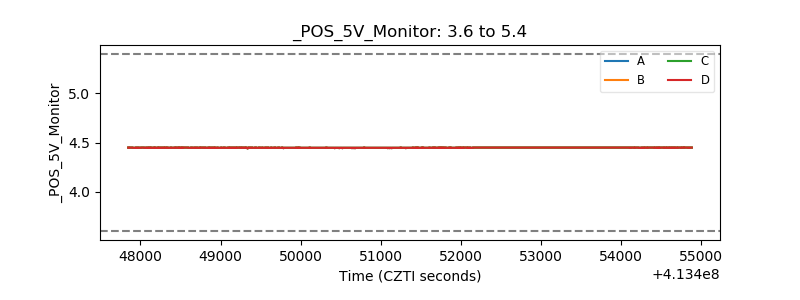 |
| _ROLL_ROT | 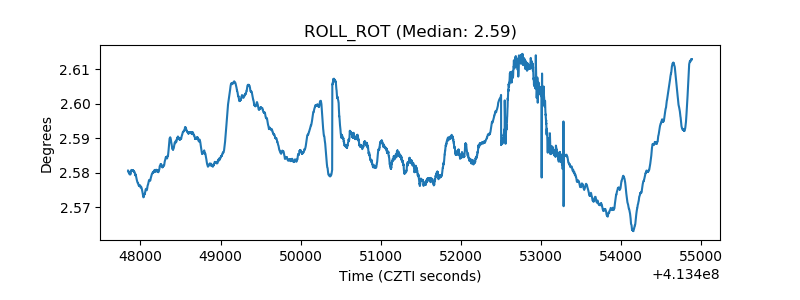 |
| _Roll_DEC | 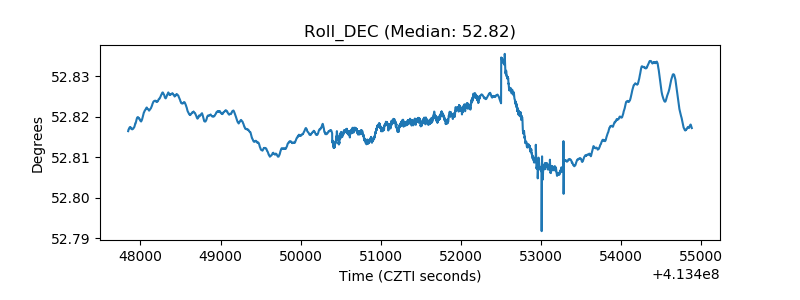 |
| _Roll_RA | 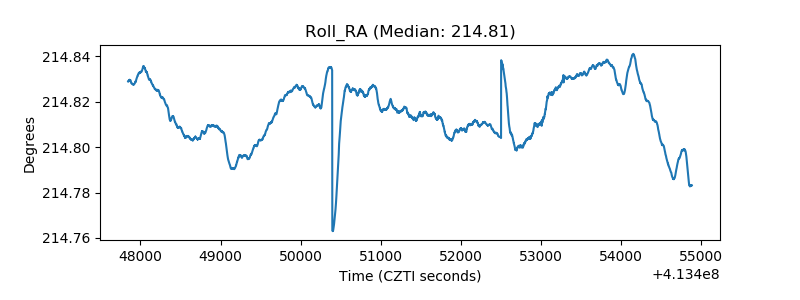 |
| Veto Counter | 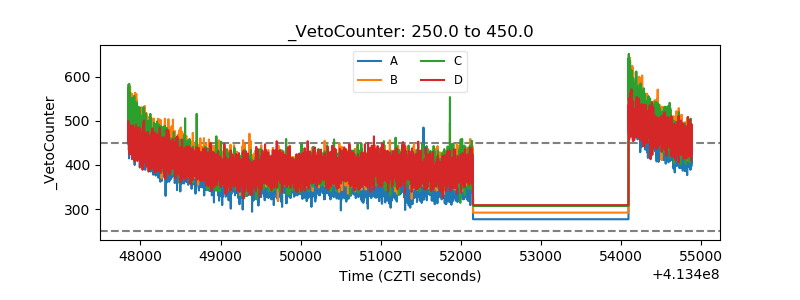 |