| Param | Original file | Final file |
|---|---|---|
| Filename | modeM0/AS1A12_022T01_9000005498_39808cztM0_level2.fits | modeM0/AS1A12_022T01_9000005498_39808cztM0_level2_quad_clean.evt |
| Size (bytes) | 1,167,920,640 | 224,760,960 |
| Size | 1.1 GB | 214.3 MB |
| Events in quadrant A | 7,853,762 | 1,626,572 |
| Events in quadrant B | 7,374,774 | 1,643,072 |
| Events in quadrant C | 19,628,900 | 1,174,952 |
| Events in quadrant D | 7,326,015 | 1,423,146 |
| Mode M0 | |||
|---|---|---|---|
| Quadrant | BADHDUFLAG | Total packets | Discarded packets |
| A | 0 | 31382 | 4 |
| B | 0 | 30731 | 3 |
| C | 0 | 67747 | 3 |
| D | 0 | 30901 | 3 |
| Mode M9 | |||
|---|---|---|---|
| Quadrant | BADHDUFLAG | Total packets | Discarded packets |
| A | 0 | 57 | 0 |
| B | 0 | 57 | 0 |
| C | 0 | 57 | 0 |
| D | 0 | 57 | 0 |
| Mode SS | |||
|---|---|---|---|
| Quadrant | BADHDUFLAG | Total packets | Discarded packets |
| A | 0 | 278 | 0 |
| B | 0 | 278 | 0 |
| C | 0 | 278 | 0 |
| D | 0 | 278 | 0 |
| Quadrant | Total seconds | Saturated seconds | Saturation percentage |
|---|---|---|---|
| A | 13574 | 119 | 0.876676% |
| B | 13574 | 180 | 1.326065% |
| C | 13574 | 3787 | 27.898924% |
| D | 13574 | 157 | 1.156623% |
Noise dominated data is calculated using 1-second bins in cleaned event files. If a bin has >2000 counts, and if more than 50% of those come from <1% of pixels, then it is considered to be noise-dominated and hence unusable.
| Quadrant | # 1 sec bins | Bins with >0 counts | Bins with >2000 counts | High rate bins dominated by noise | Noise dominated (total time) | Noise dominated (detector-on time) | Marked lightcurve |
|---|---|---|---|---|---|---|---|
| A | 19342 | 13577 | 78 | 78 | 0.40% | 0.57% | 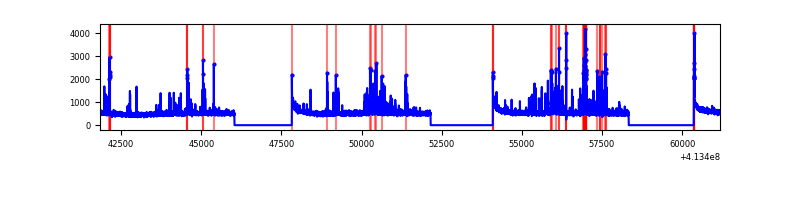 |
| B | 19342 | 13577 | 121 | 121 | 0.63% | 0.89% | 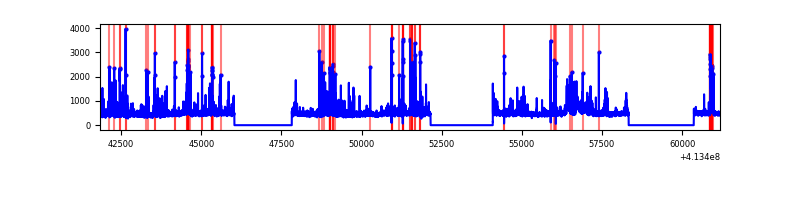 |
| C | 19342 | 13577 | 3404 | 3404 | 17.60% | 25.07% | 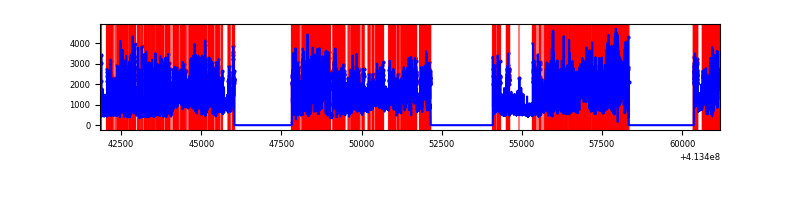 |
| D | 19342 | 13577 | 135 | 135 | 0.70% | 0.99% | 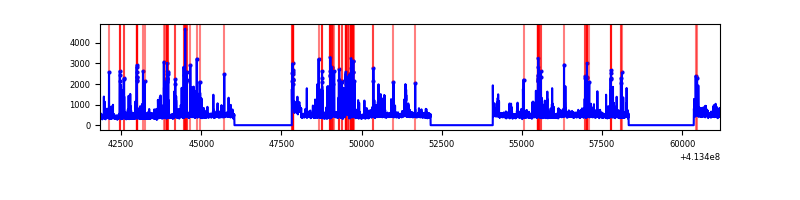 |
Top three noisy pixels from each quadrant. If the there are fewer than three noisy pixels in the level2.evt file, extra rows are filled as -1
| Pixel properties | Quadrant properties | ||||||
|---|---|---|---|---|---|---|---|
| Quadrant | DetID | PixID | Counts | Sigma | Mean | Median | Sigma |
| A | 10 | 83 | 1014451 | 3234.41 | 1556 | 1527 | 313.2 |
| A | 9 | 143 | 399222 | 1269.89 | 1556 | 1527 | 313.2 |
| A | 13 | 248 | 217402 | 689.32 | 1556 | 1527 | 313.2 |
| B | 5 | 172 | 454056 | 1572.31 | 1522 | 1482 | 287.8 |
| B | 4 | 171 | 361095 | 1249.35 | 1522 | 1482 | 287.8 |
| B | 5 | 32 | 217677 | 751.1 | 1522 | 1482 | 287.8 |
| C | 9 | 187 | 10741774 | 35365.48 | 1327 | 1332 | 303.7 |
| C | 15 | 208 | 3139207 | 10332.2 | 1327 | 1332 | 303.7 |
| C | 15 | 214 | 507670 | 1667.24 | 1327 | 1332 | 303.7 |
| D | 12 | 227 | 486421 | 1329.94 | 1504 | 1461 | 364.6 |
| D | 2 | 249 | 419481 | 1146.37 | 1504 | 1461 | 364.6 |
| D | 13 | 249 | 354420 | 967.94 | 1504 | 1461 | 364.6 |
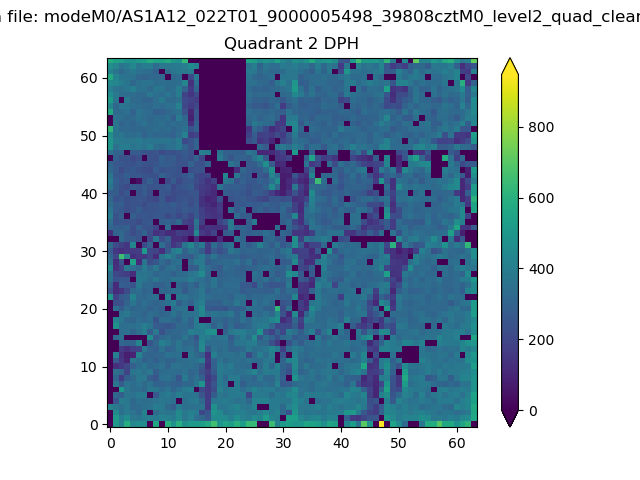
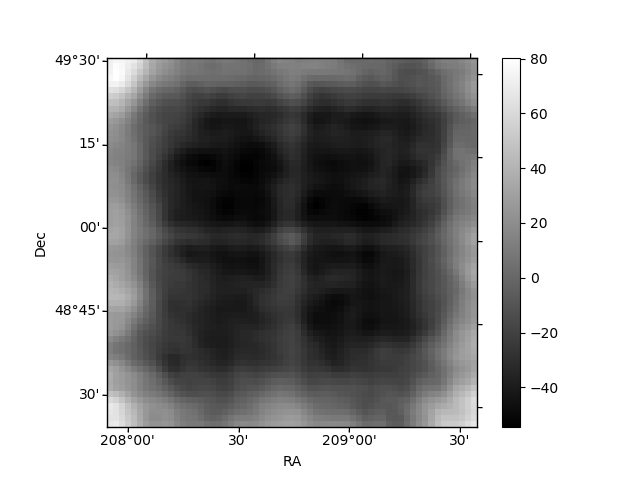
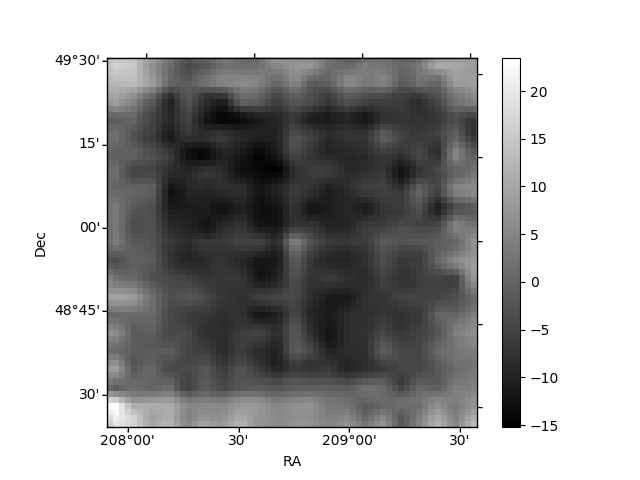
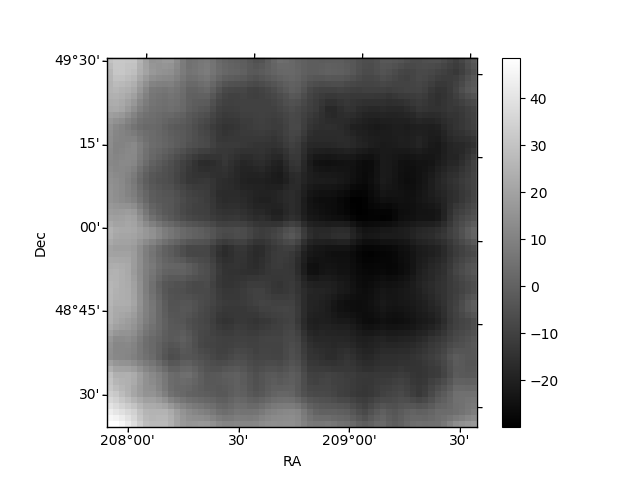
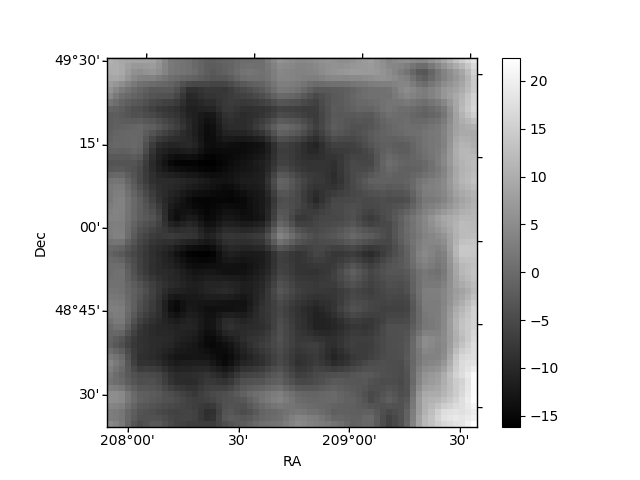
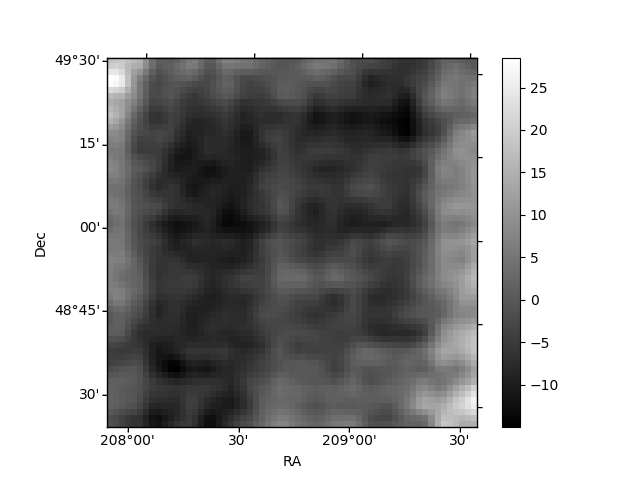
Histogram calculated using DETX and DETY for each event in the final _common_clean file
| Quadrant A | 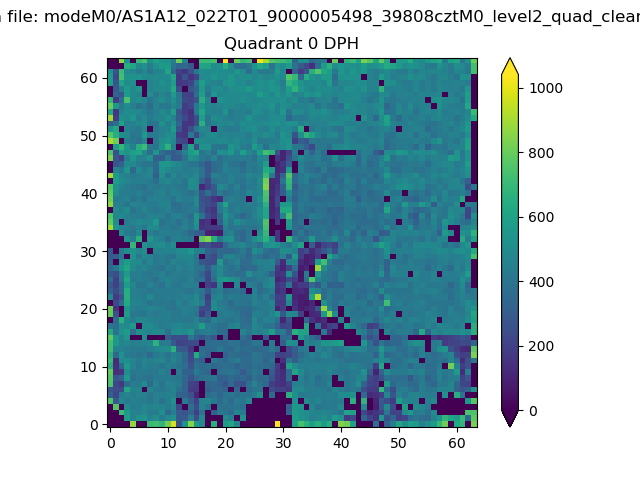 |
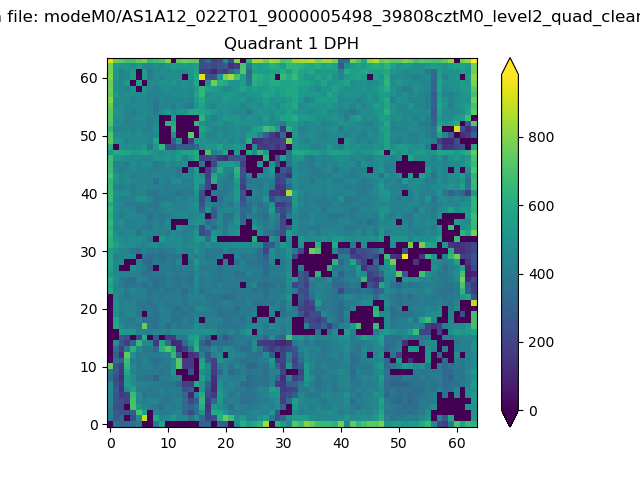 |
Quadrant B |
|---|---|---|---|
| Quadrant D | 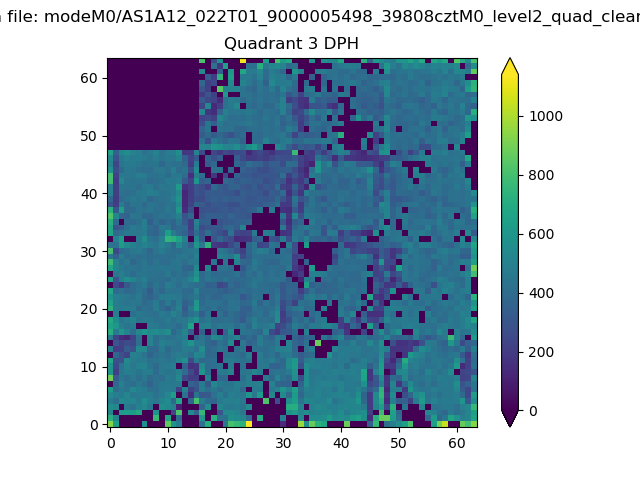 |
 |
Quadrant C |
| Plot type | Count rate plots | Images |
|---|---|---|
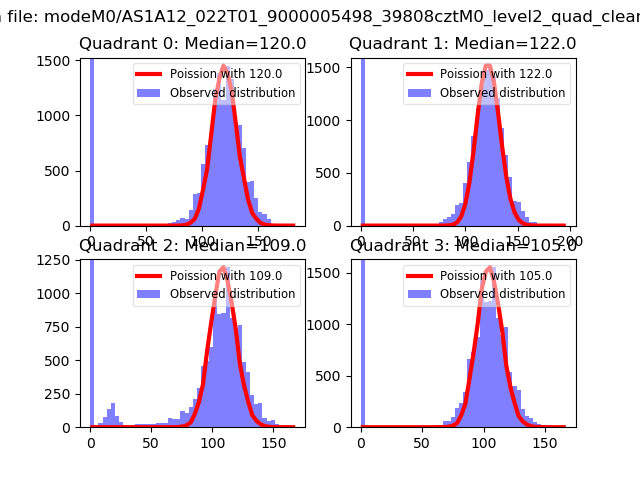
| Comparison with Poisson distribution Blue bars denote a histogram of data divided into 1 sec bins. Red curve is a Poisson curve with rate = median count rate of data. |
 |
 |
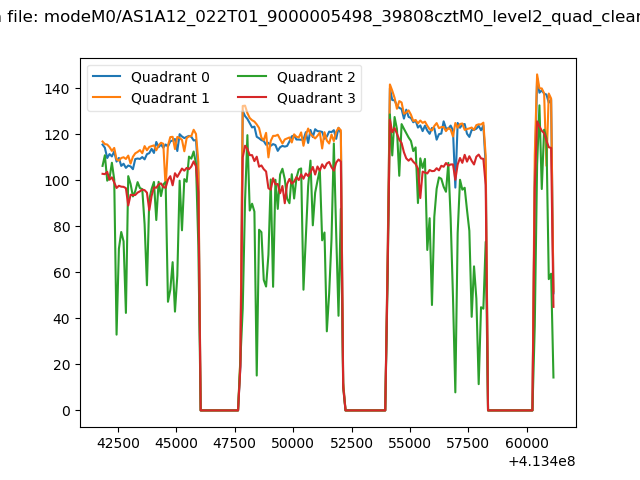
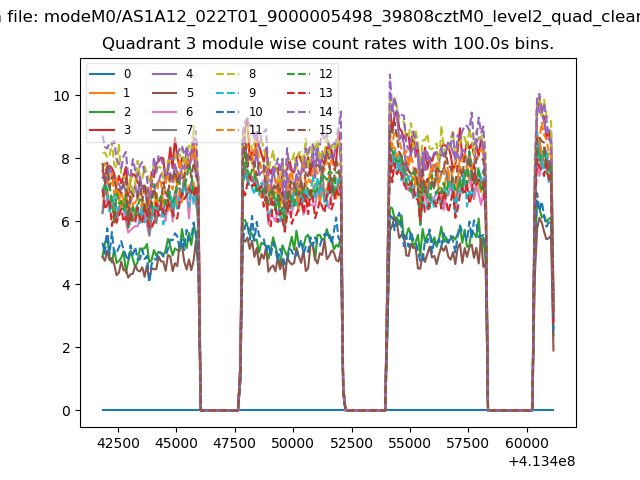
| Quadrant-wise count rates Data is divided into 100 sec bins |
 |
|
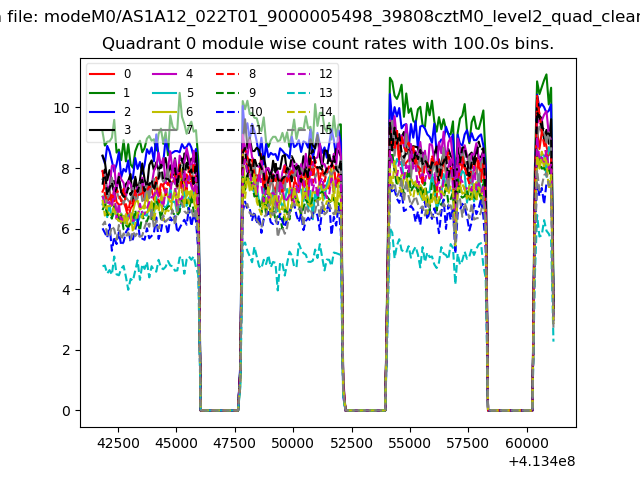
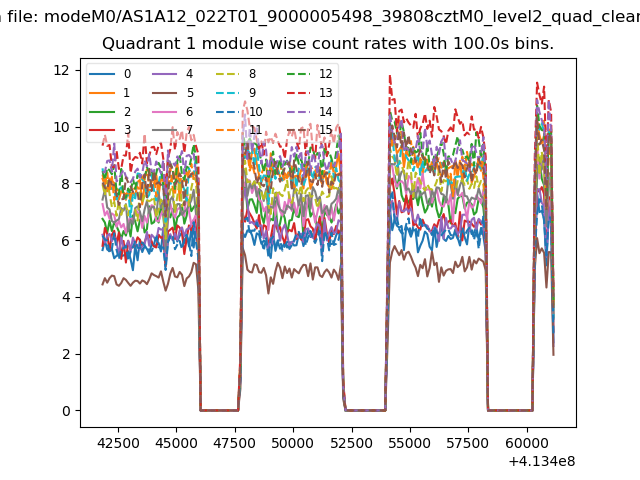
| Module-wise count rates for Quadrant A Data is divided into 100 sec bins |
 |
 |
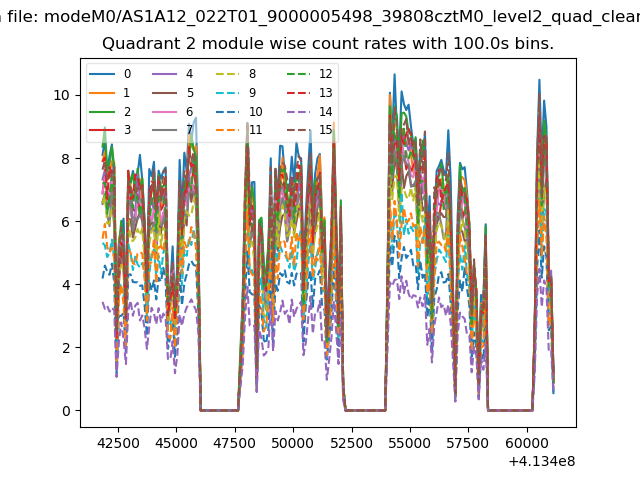
| Module-wise count rates for Quadrant B Data is divided into 100 sec bins |
 |
 |
| Module-wise count rates for Quadrant C Data is divided into 100 sec bins |
 |
 |
| Module-wise count rates for Quadrant D Data is divided into 100 sec bins |
 |
 |
| Parameter | Plot |
|---|---|
| CZT HV Monitor | 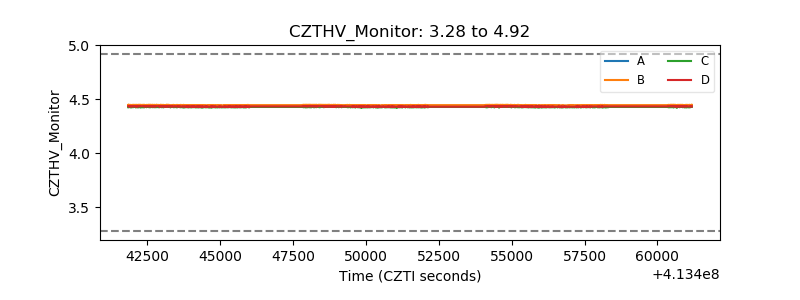 |
| D_VDD | 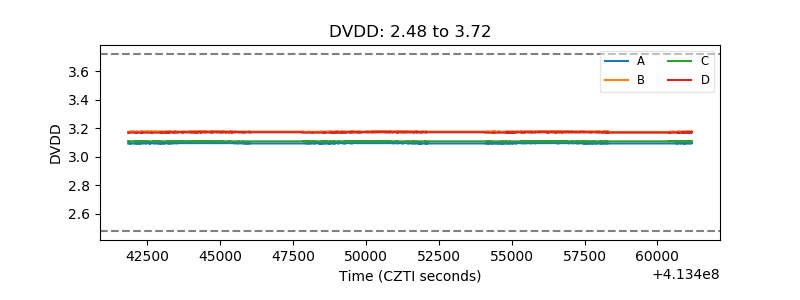 |
| Temperature 1 | 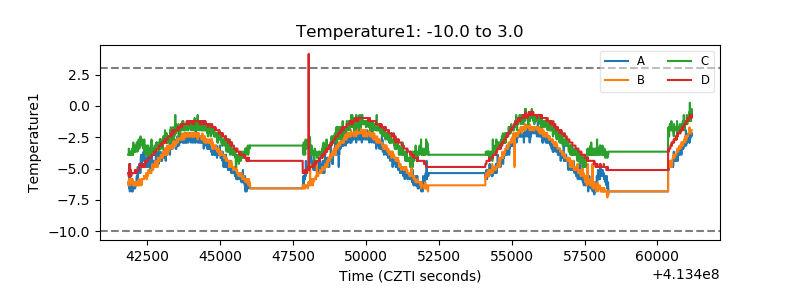 |
| Veto HV Monitor | 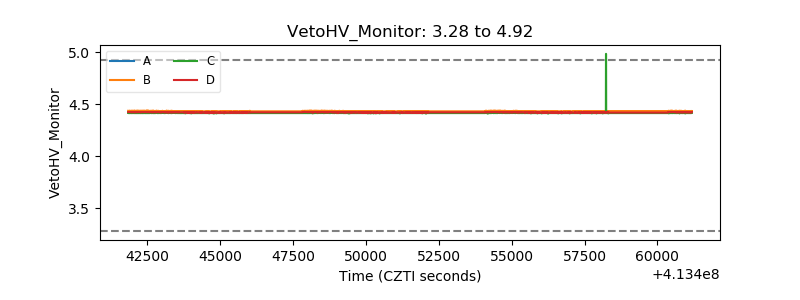 |
| Veto LLD | 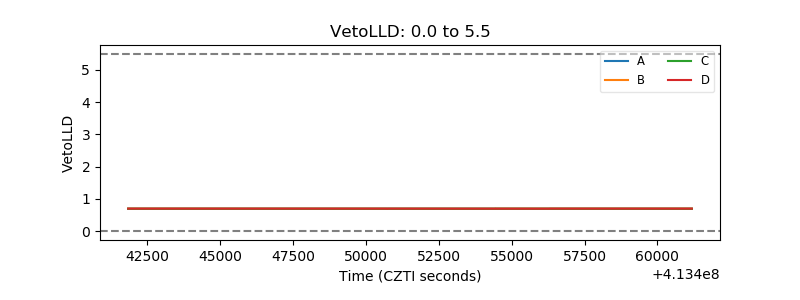 |
| Alpha Counter | 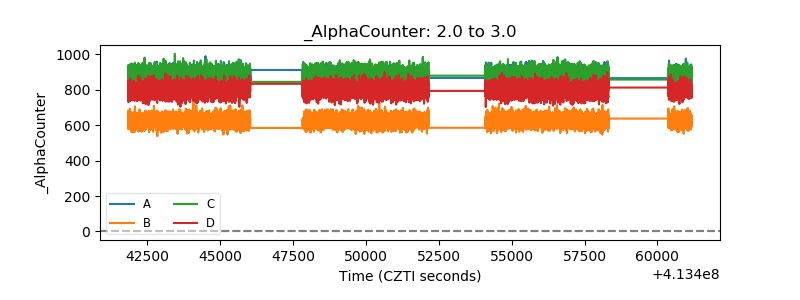 |
| _CPM_Rate | 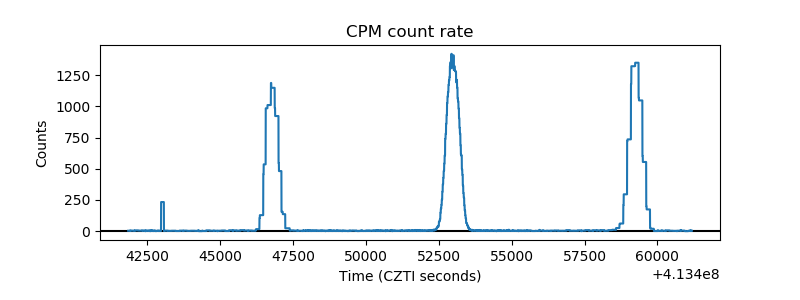 |
| CZT Counter | 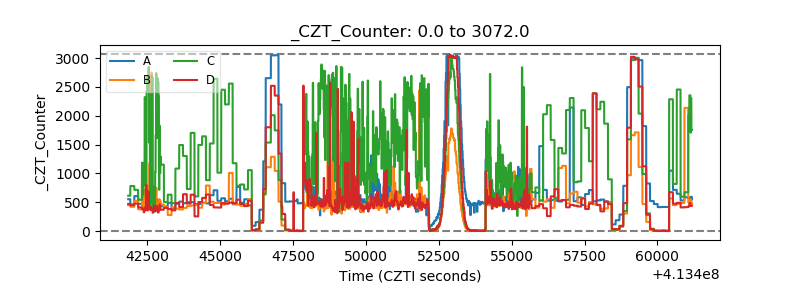 |
| +2.5 Volts monitor | 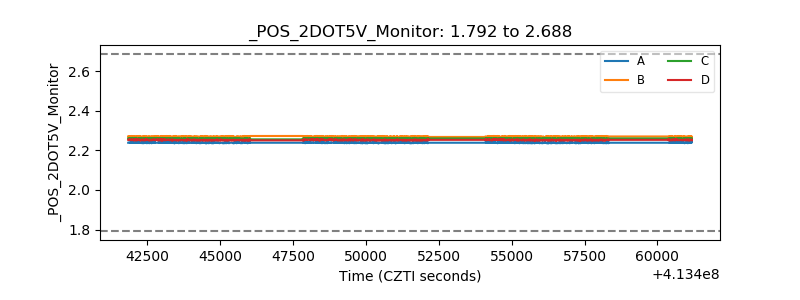 |
| +5 Volts monitor | 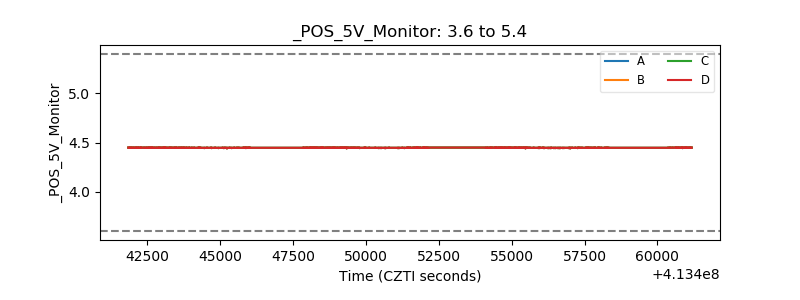 |
| _ROLL_ROT | 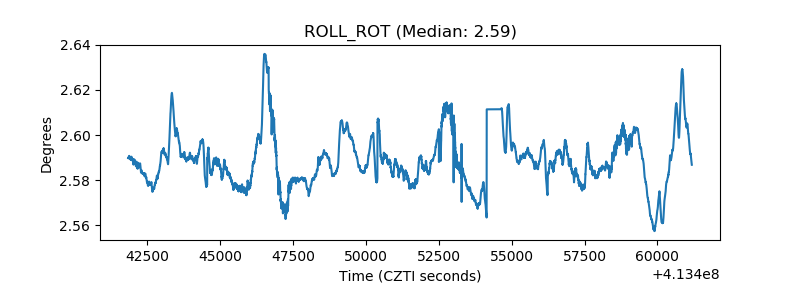 |
| _Roll_DEC | 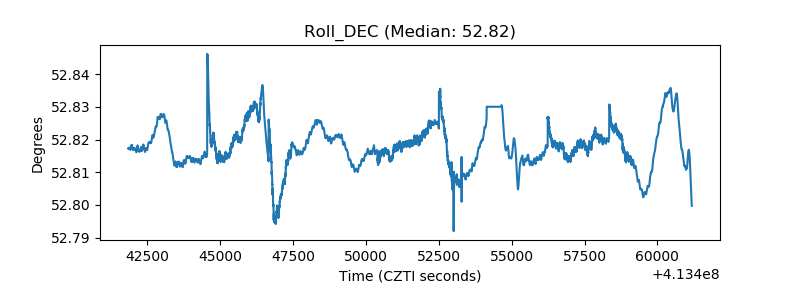 |
| _Roll_RA | 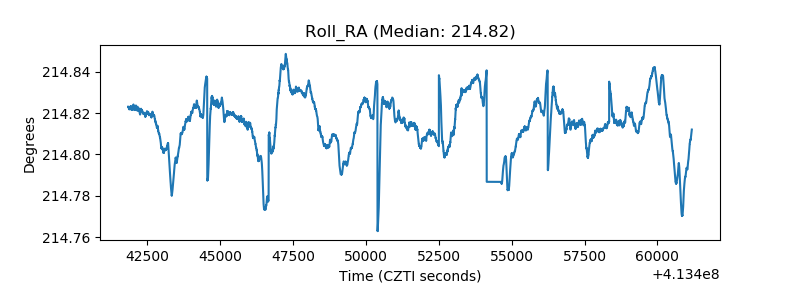 |
| Veto Counter | 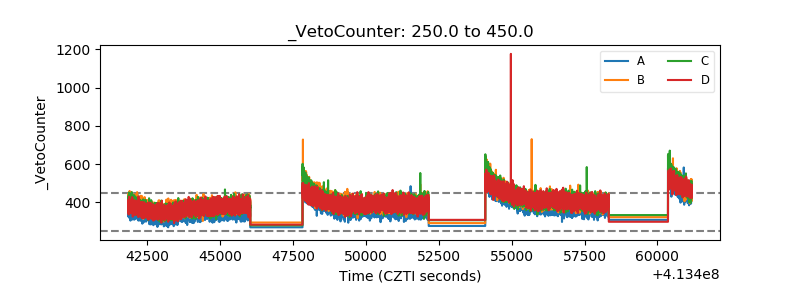 |