| Param | Original file | Final file |
|---|---|---|
| Filename | modeM0/AS1A12_022T01_9000005498_39809cztM0_level2.fits | modeM0/AS1A12_022T01_9000005498_39809cztM0_level2_quad_clean.evt |
| Size (bytes) | 1,990,261,440 | 368,686,080 |
| Size | 1.9 GB | 351.6 MB |
| Events in quadrant A | 13,414,810 | 2,700,131 |
| Events in quadrant B | 12,317,740 | 2,736,958 |
| Events in quadrant C | 33,404,426 | 1,805,663 |
| Events in quadrant D | 12,779,522 | 2,354,014 |
| Mode M0 | |||
|---|---|---|---|
| Quadrant | BADHDUFLAG | Total packets | Discarded packets |
| A | 0 | 53752 | 7 |
| B | 0 | 51497 | 6 |
| C | 0 | 115048 | 6 |
| D | 0 | 53637 | 6 |
| Mode M9 | |||
|---|---|---|---|
| Quadrant | BADHDUFLAG | Total packets | Discarded packets |
| A | 0 | 105 | 0 |
| B | 0 | 105 | 0 |
| C | 0 | 105 | 0 |
| D | 0 | 106 | 0 |
| Mode SS | |||
|---|---|---|---|
| Quadrant | BADHDUFLAG | Total packets | Discarded packets |
| A | 0 | 466 | 0 |
| B | 0 | 466 | 0 |
| C | 0 | 466 | 0 |
| D | 0 | 466 | 0 |
| Quadrant | Total seconds | Saturated seconds | Saturation percentage |
|---|---|---|---|
| A | 22754 | 290 | 1.274501% |
| B | 22754 | 363 | 1.595324% |
| C | 22754 | 6934 | 30.473763% |
| D | 22754 | 540 | 2.373209% |
Noise dominated data is calculated using 1-second bins in cleaned event files. If a bin has >2000 counts, and if more than 50% of those come from <1% of pixels, then it is considered to be noise-dominated and hence unusable.
| Quadrant | # 1 sec bins | Bins with >0 counts | Bins with >2000 counts | High rate bins dominated by noise | Noise dominated (total time) | Noise dominated (detector-on time) | Marked lightcurve |
|---|---|---|---|---|---|---|---|
| A | 32317 | 22758 | 196 | 196 | 0.61% | 0.86% | 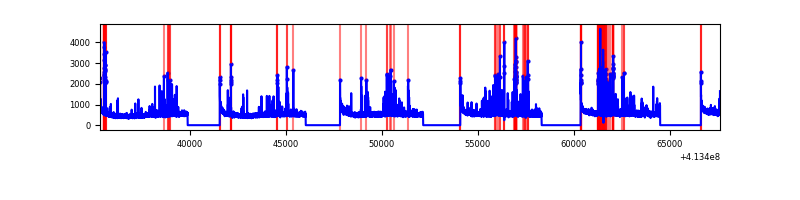 |
| B | 32317 | 22758 | 226 | 226 | 0.70% | 0.99% | 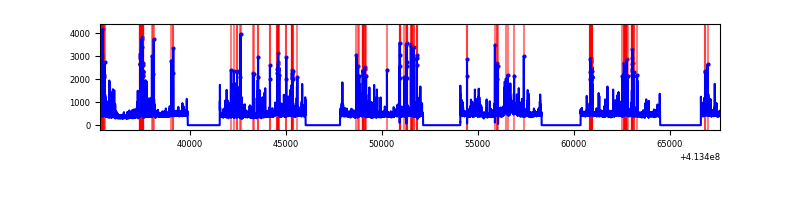 |
| C | 32317 | 22758 | 6188 | 6188 | 19.15% | 27.19% | 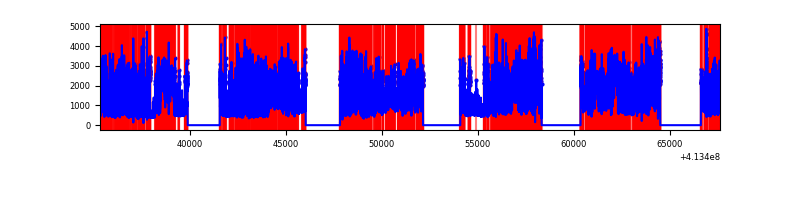 |
| D | 32317 | 22758 | 414 | 414 | 1.28% | 1.82% | 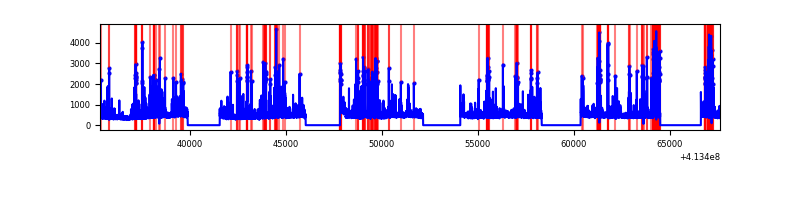 |
Top three noisy pixels from each quadrant. If the there are fewer than three noisy pixels in the level2.evt file, extra rows are filled as -1
| Pixel properties | Quadrant properties | ||||||
|---|---|---|---|---|---|---|---|
| Quadrant | DetID | PixID | Counts | Sigma | Mean | Median | Sigma |
| A | 10 | 83 | 1759021 | 3390.81 | 2584 | 2537 | 518.0 |
| A | 9 | 143 | 885830 | 1705.15 | 2584 | 2537 | 518.0 |
| A | 2 | 79 | 430735 | 826.62 | 2584 | 2537 | 518.0 |
| B | 4 | 171 | 857000 | 1787.93 | 2539 | 2471 | 477.9 |
| B | 5 | 172 | 546086 | 1137.41 | 2539 | 2471 | 477.9 |
| B | 5 | 255 | 424273 | 882.54 | 2539 | 2471 | 477.9 |
| C | 9 | 187 | 19476865 | 38727.3 | 2192 | 2207 | 502.9 |
| C | 15 | 208 | 4420379 | 8785.98 | 2192 | 2207 | 502.9 |
| C | 15 | 214 | 846956 | 1679.87 | 2192 | 2207 | 502.9 |
| D | 13 | 249 | 1335517 | 2191.78 | 2491 | 2417 | 608.2 |
| D | 2 | 249 | 732775 | 1200.8 | 2491 | 2417 | 608.2 |
| D | 12 | 227 | 648619 | 1062.43 | 2491 | 2417 | 608.2 |
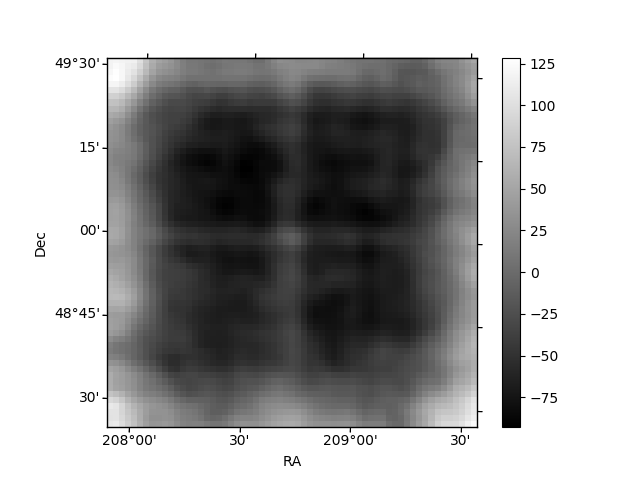
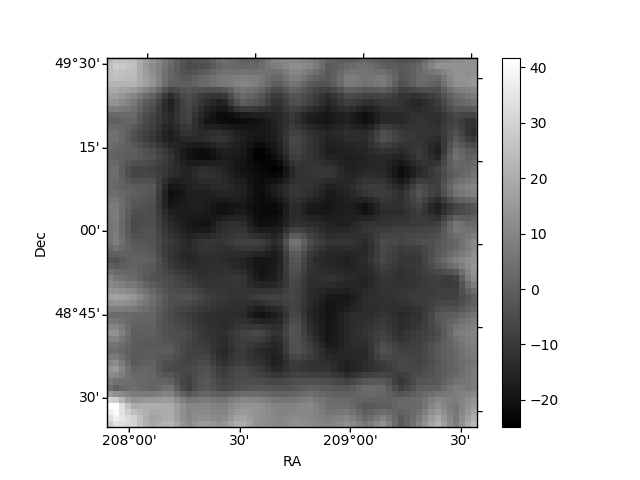
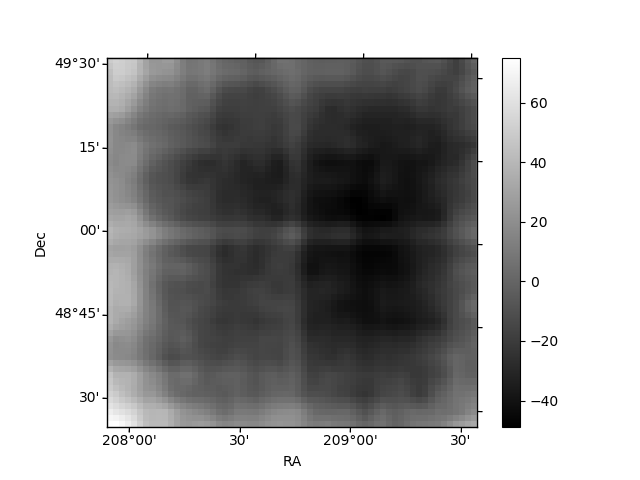
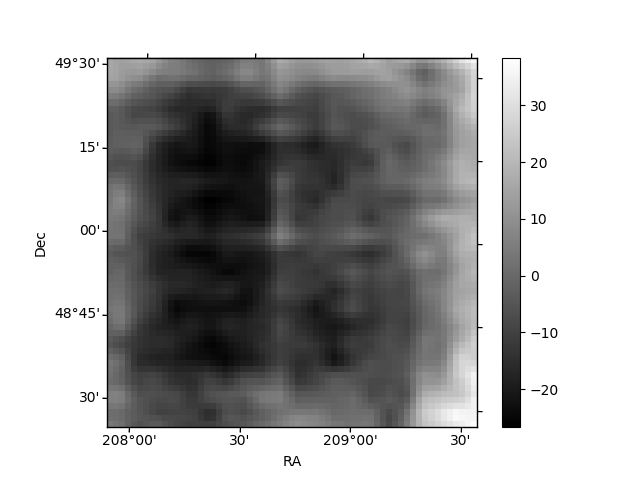
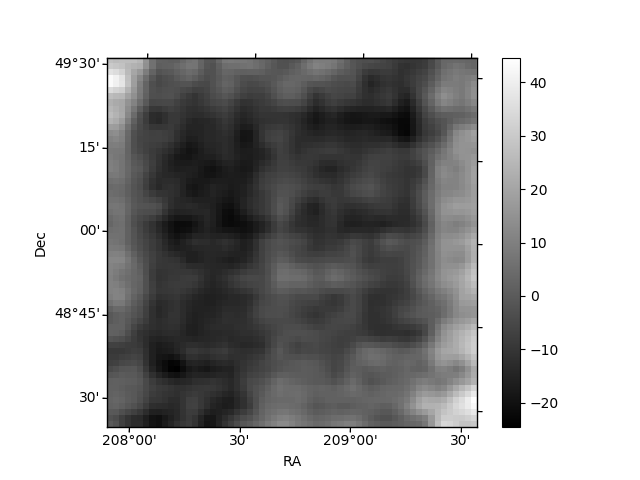
Histogram calculated using DETX and DETY for each event in the final _common_clean file
| Quadrant A | 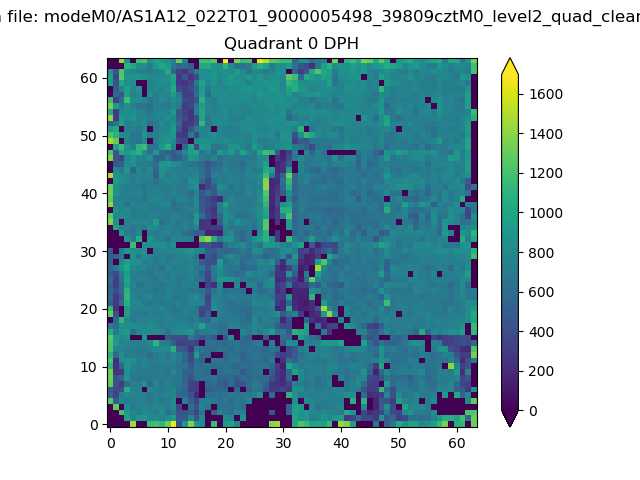 |
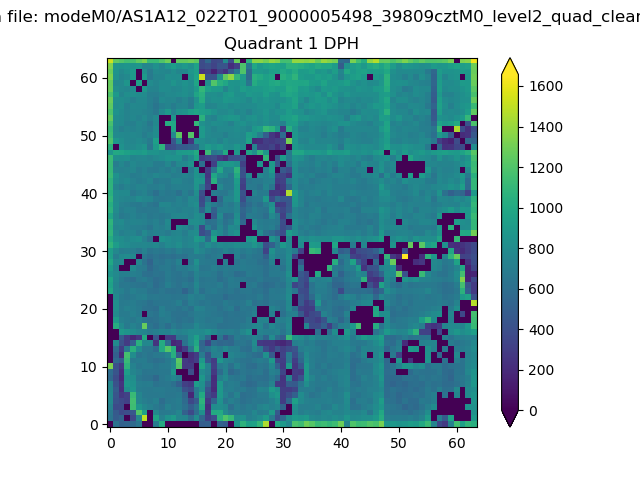 |
Quadrant B |
|---|---|---|---|
| Quadrant D | 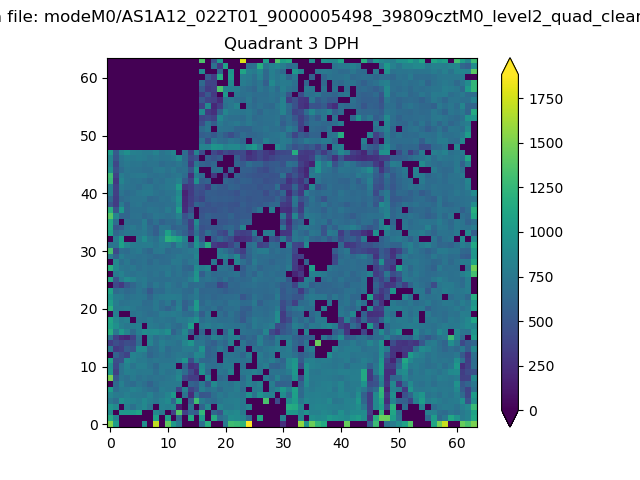 |
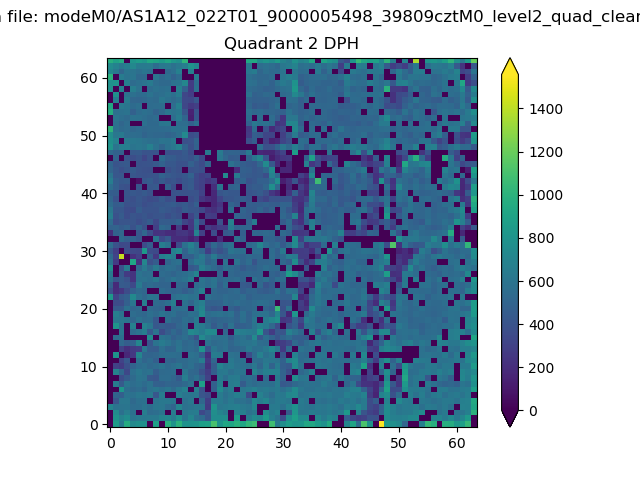 |
Quadrant C |
| Plot type | Count rate plots | Images |
|---|---|---|
| Comparison with Poisson distribution Blue bars denote a histogram of data divided into 1 sec bins. Red curve is a Poisson curve with rate = median count rate of data. |
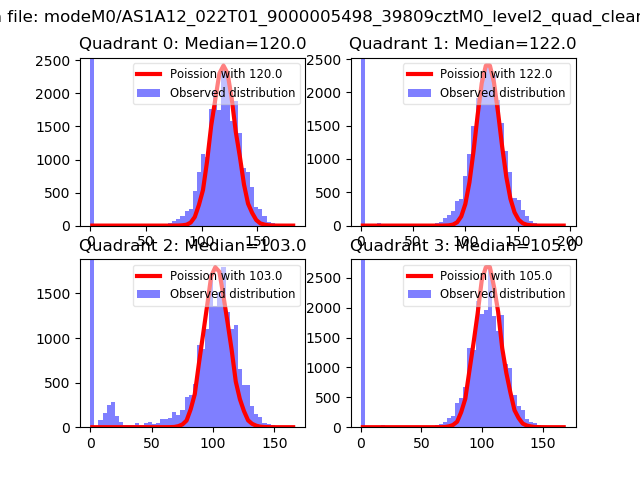 |
 |
| Quadrant-wise count rates Data is divided into 100 sec bins |
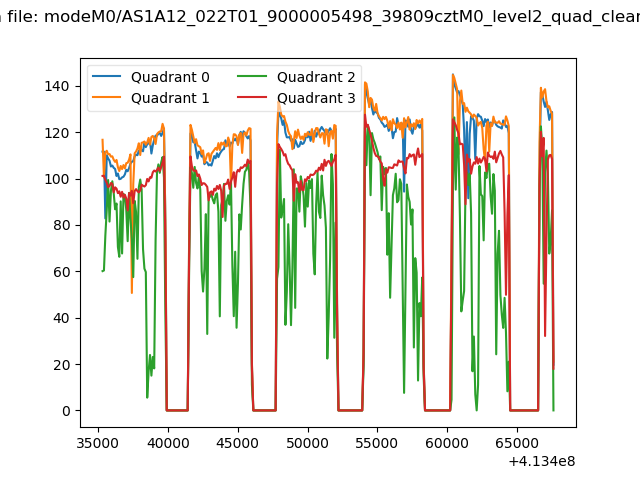 |
|
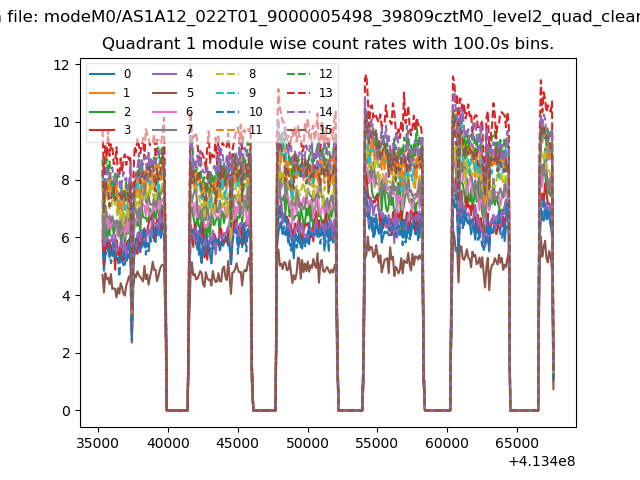
| Module-wise count rates for Quadrant A Data is divided into 100 sec bins |
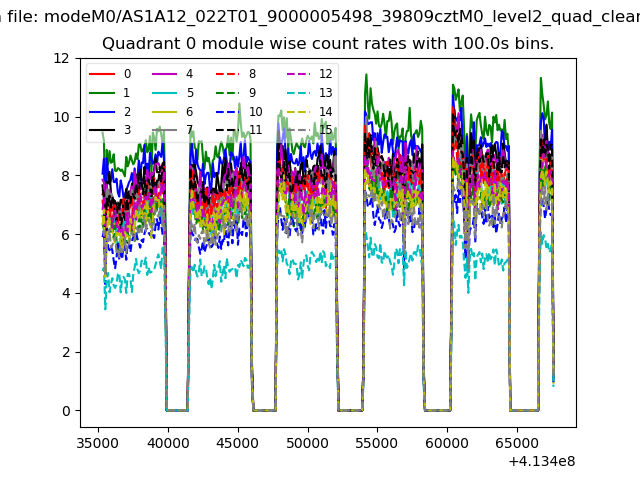 |
 |
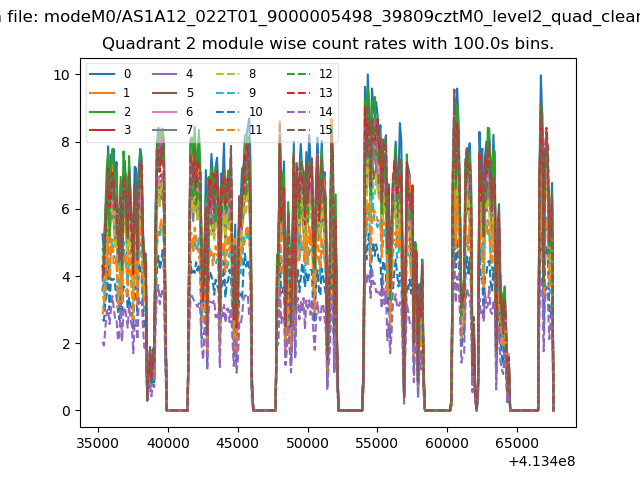
| Module-wise count rates for Quadrant B Data is divided into 100 sec bins |
 |
 |
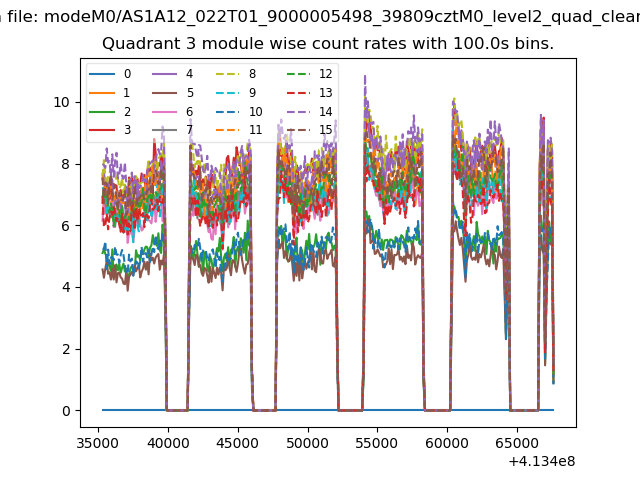
| Module-wise count rates for Quadrant C Data is divided into 100 sec bins |
 |
 |
| Module-wise count rates for Quadrant D Data is divided into 100 sec bins |
 |
 |
| Parameter | Plot |
|---|---|
| CZT HV Monitor | 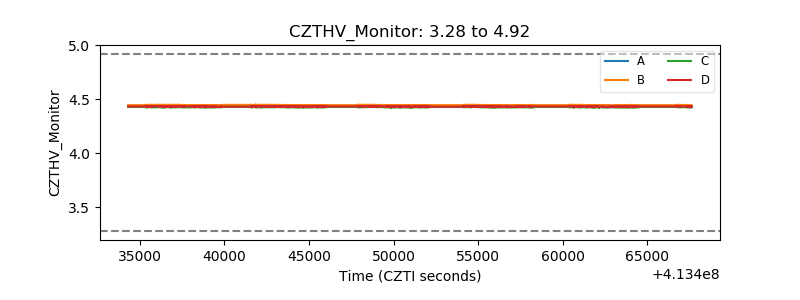 |
| D_VDD | 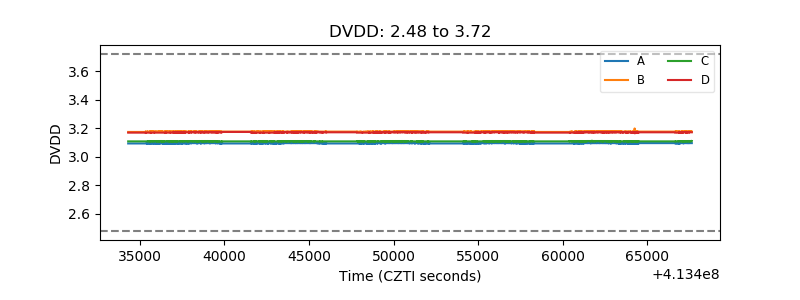 |
| Temperature 1 | 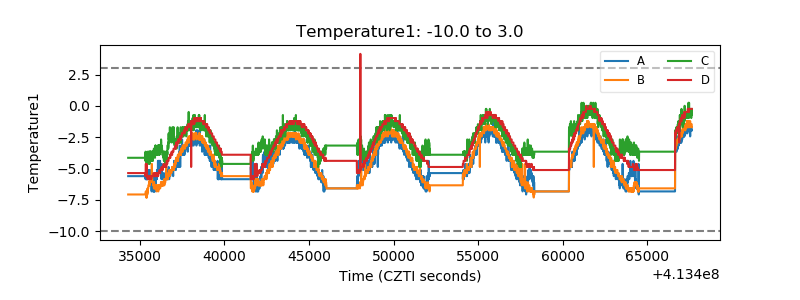 |
| Veto HV Monitor | 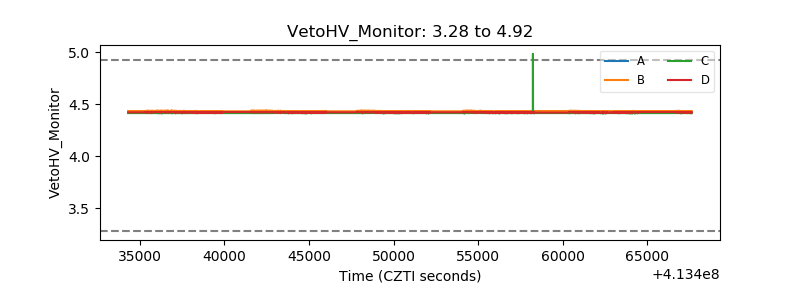 |
| Veto LLD | 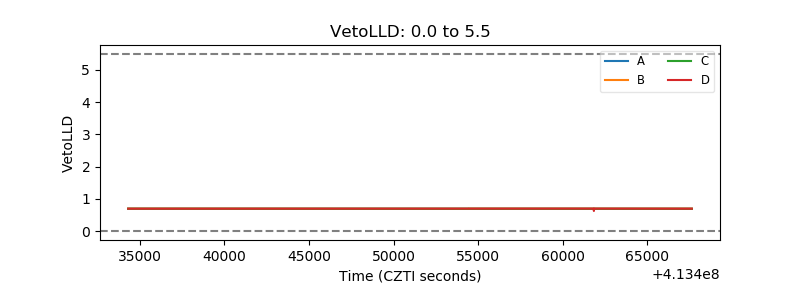 |
| Alpha Counter | 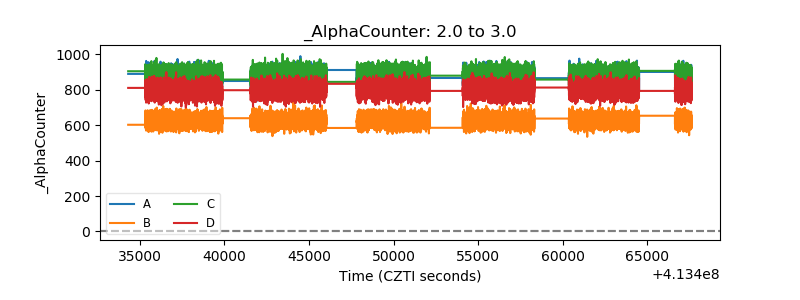 |
| _CPM_Rate | 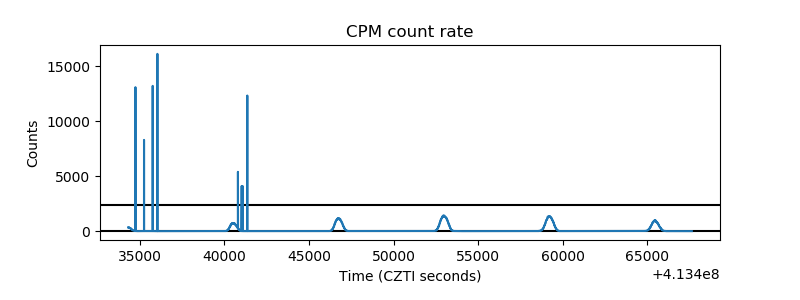 |
| CZT Counter | 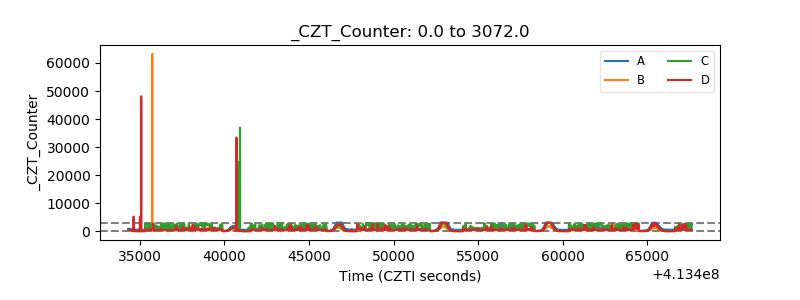 |
| +2.5 Volts monitor | 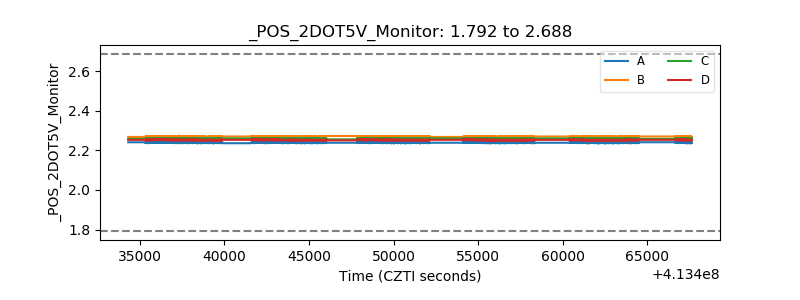 |
| +5 Volts monitor | 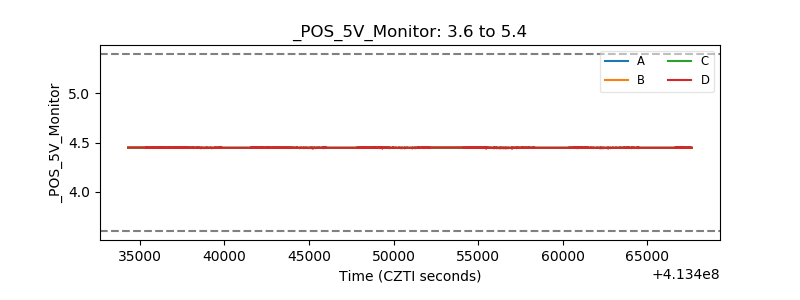 |
| _ROLL_ROT | 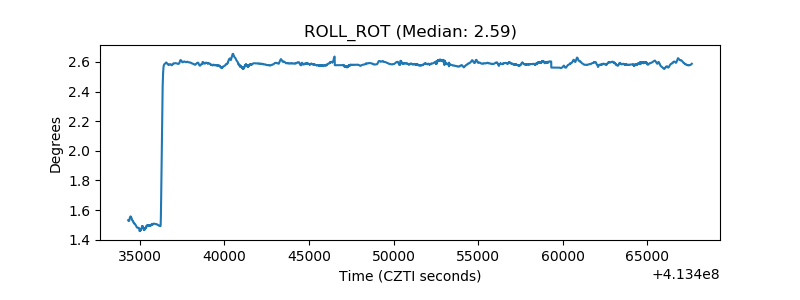 |
| _Roll_DEC | 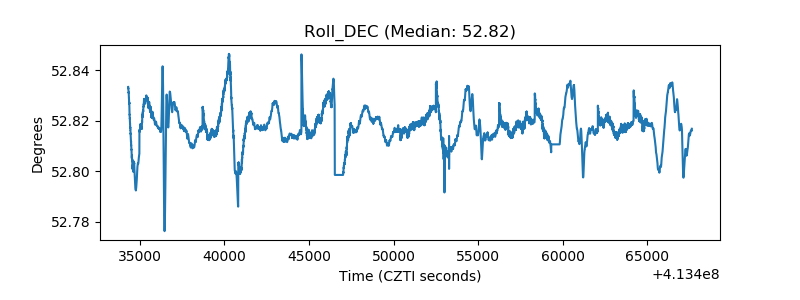 |
| _Roll_RA | 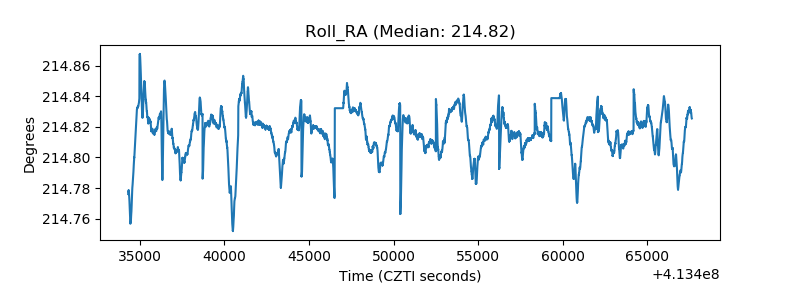 |
| Veto Counter | 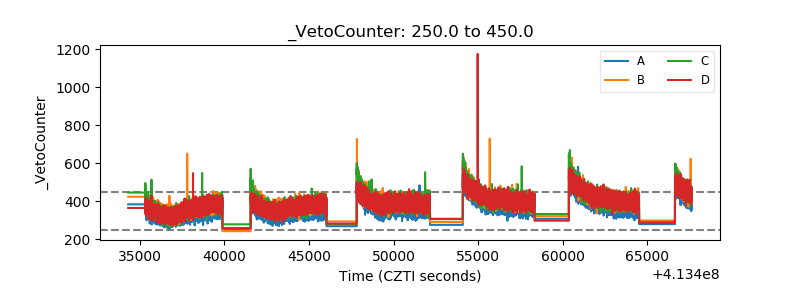 |