| Param | Original file | Final file |
|---|---|---|
| Filename | modeM0/AS1A12_022T01_9000005498_39810cztM0_level2.fits | modeM0/AS1A12_022T01_9000005498_39810cztM0_level2_quad_clean.evt |
| Size (bytes) | 460,408,320 | 86,808,960 |
| Size | 439.1 MB | 82.8 MB |
| Events in quadrant A | 3,398,698 | 632,590 |
| Events in quadrant B | 2,850,398 | 634,042 |
| Events in quadrant C | 7,589,192 | 458,852 |
| Events in quadrant D | 2,805,998 | 543,277 |
| Mode M0 | |||
|---|---|---|---|
| Quadrant | BADHDUFLAG | Total packets | Discarded packets |
| A | 0 | 13573 | 3 |
| B | 0 | 11742 | 2 |
| C | 0 | 26129 | 2 |
| D | 0 | 11830 | 2 |
| Mode M9 | |||
|---|---|---|---|
| Quadrant | BADHDUFLAG | Total packets | Discarded packets |
| A | 0 | 24 | 0 |
| B | 0 | 24 | 0 |
| C | 0 | 24 | 0 |
| D | 0 | 25 | 0 |
| Mode SS | |||
|---|---|---|---|
| Quadrant | BADHDUFLAG | Total packets | Discarded packets |
| A | 0 | 106 | 0 |
| B | 0 | 106 | 0 |
| C | 0 | 106 | 0 |
| D | 0 | 106 | 0 |
| Quadrant | Total seconds | Saturated seconds | Saturation percentage |
|---|---|---|---|
| A | 5129 | 54 | 1.052837% |
| B | 5129 | 82 | 1.598752% |
| C | 5129 | 1436 | 27.997660% |
| D | 5129 | 165 | 3.217001% |
Noise dominated data is calculated using 1-second bins in cleaned event files. If a bin has >2000 counts, and if more than 50% of those come from <1% of pixels, then it is considered to be noise-dominated and hence unusable.
| Quadrant | # 1 sec bins | Bins with >0 counts | Bins with >2000 counts | High rate bins dominated by noise | Noise dominated (total time) | Noise dominated (detector-on time) | Marked lightcurve |
|---|---|---|---|---|---|---|---|
| A | 7281 | 5130 | 35 | 35 | 0.48% | 0.68% | 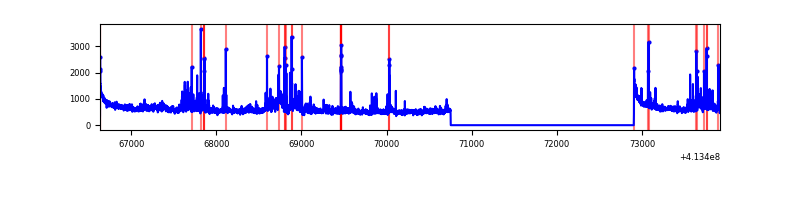 |
| B | 7281 | 5130 | 53 | 53 | 0.73% | 1.03% | 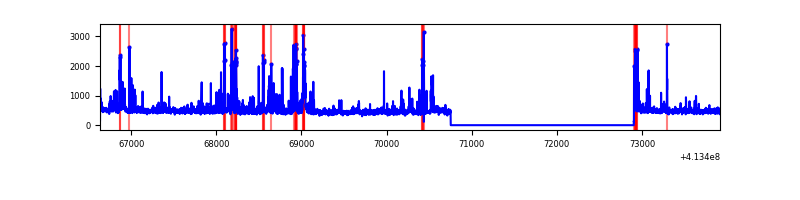 |
| C | 7281 | 5130 | 1285 | 1285 | 17.65% | 25.05% | 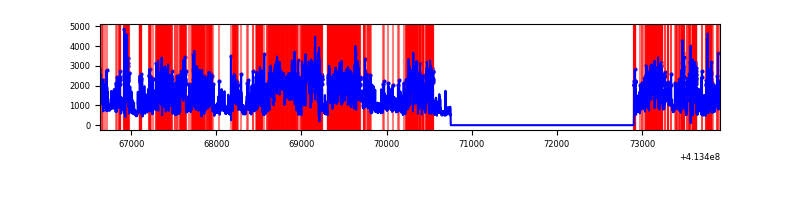 |
| D | 7281 | 5130 | 113 | 113 | 1.55% | 2.20% | 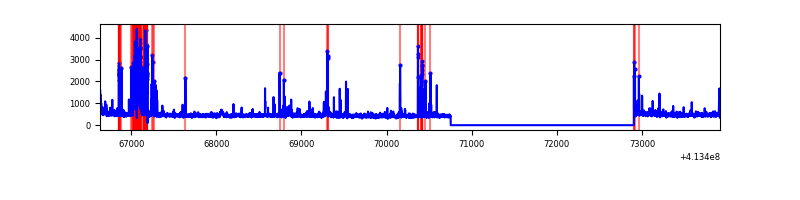 |
Top three noisy pixels from each quadrant. If the there are fewer than three noisy pixels in the level2.evt file, extra rows are filled as -1
| Pixel properties | Quadrant properties | ||||||
|---|---|---|---|---|---|---|---|
| Quadrant | DetID | PixID | Counts | Sigma | Mean | Median | Sigma |
| A | 10 | 83 | 468597 | 3905.03 | 593 | 583 | 119.8 |
| A | 2 | 79 | 328864 | 2739.12 | 593 | 583 | 119.8 |
| A | 9 | 143 | 189294 | 1574.57 | 593 | 583 | 119.8 |
| B | 5 | 172 | 189736 | 1688.43 | 584 | 569 | 112.0 |
| B | 5 | 32 | 167544 | 1490.35 | 584 | 569 | 112.0 |
| B | 4 | 171 | 111026 | 985.89 | 584 | 569 | 112.0 |
| C | 9 | 187 | 4105003 | 34596.97 | 513 | 517 | 118.6 |
| C | 15 | 208 | 1245345 | 10492.73 | 513 | 517 | 118.6 |
| C | 15 | 214 | 196176 | 1649.22 | 513 | 517 | 118.6 |
| D | 13 | 249 | 426696 | 3062.27 | 567 | 550 | 139.2 |
| D | 2 | 249 | 88736 | 633.7 | 567 | 550 | 139.2 |
| D | 12 | 227 | 44961 | 319.14 | 567 | 550 | 139.2 |
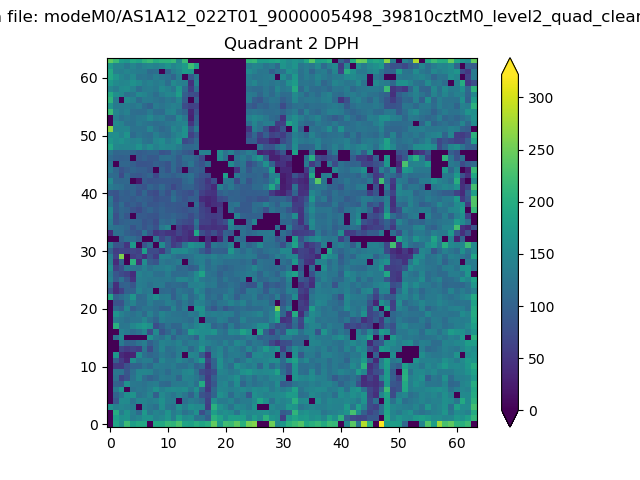
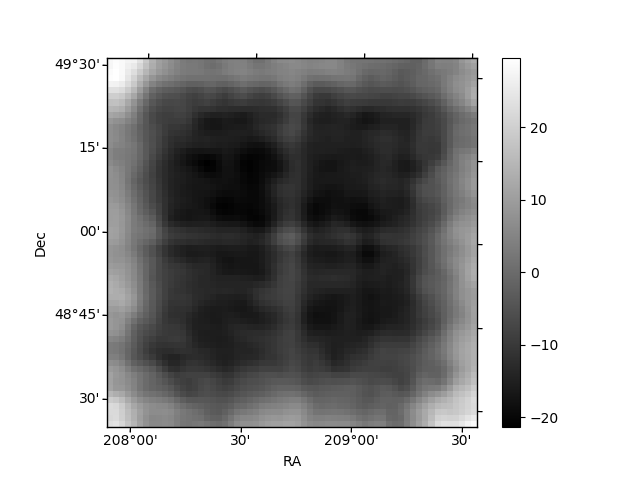
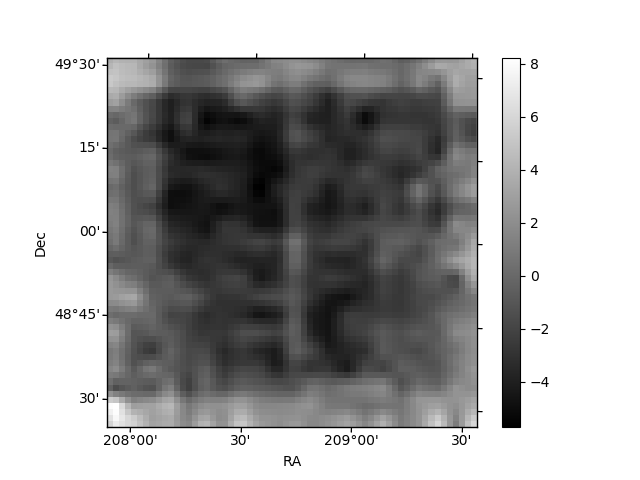
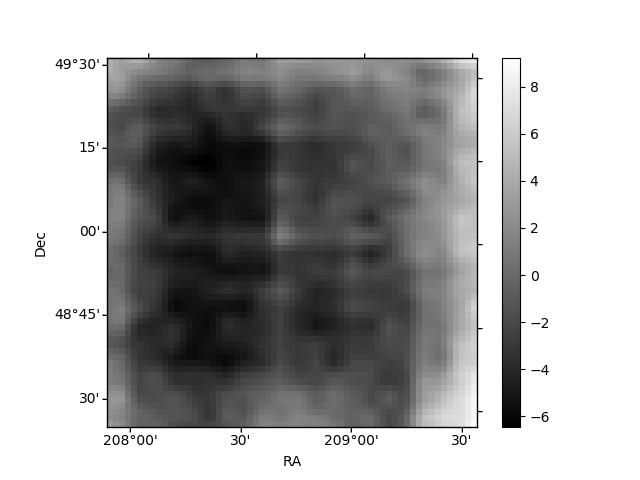
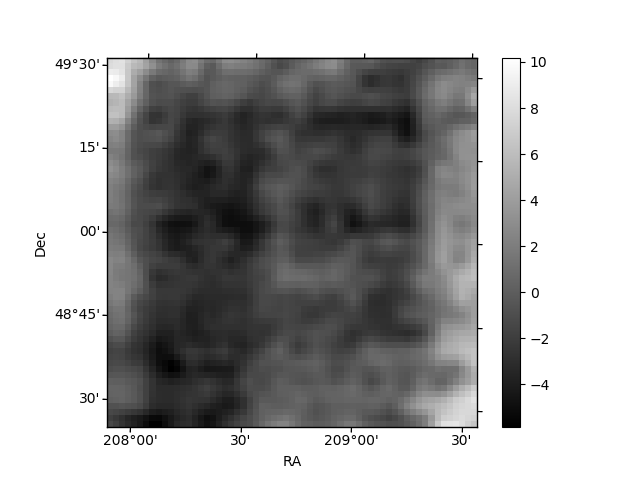
Histogram calculated using DETX and DETY for each event in the final _common_clean file
| Quadrant A | 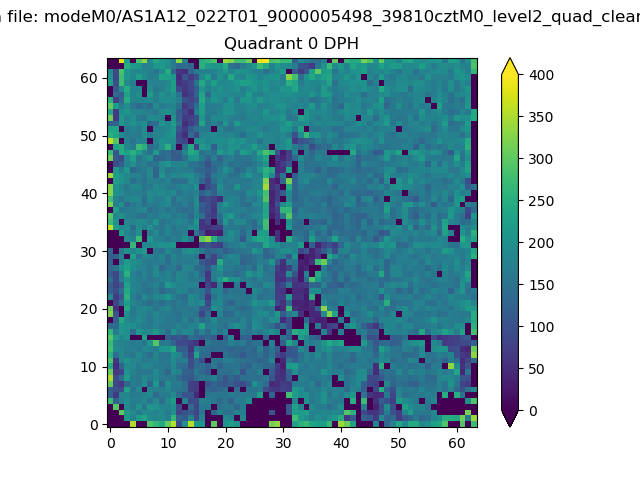 |
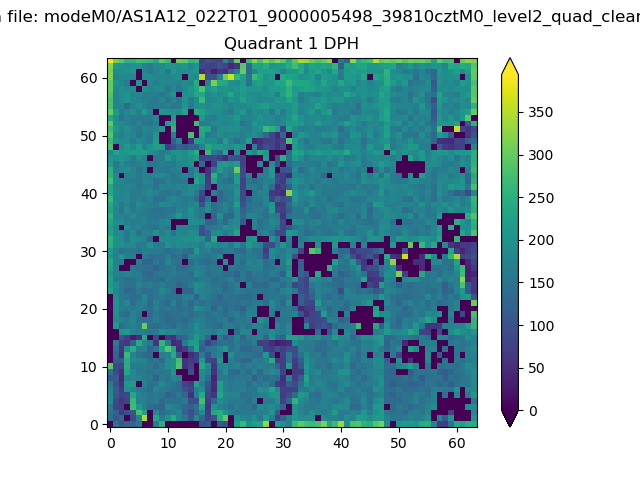 |
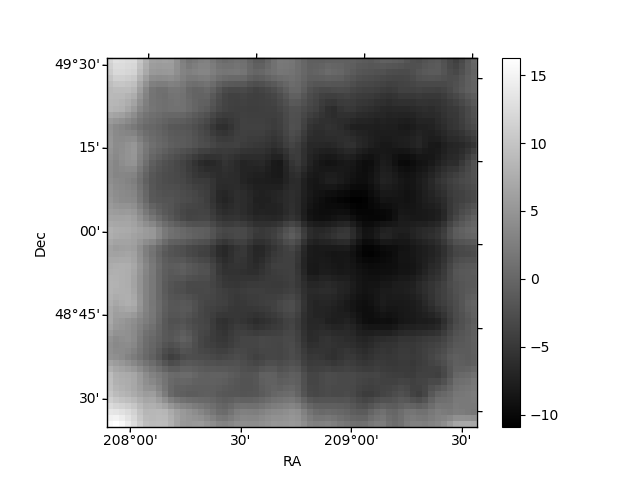
Quadrant B |
|---|---|---|---|
| Quadrant D | 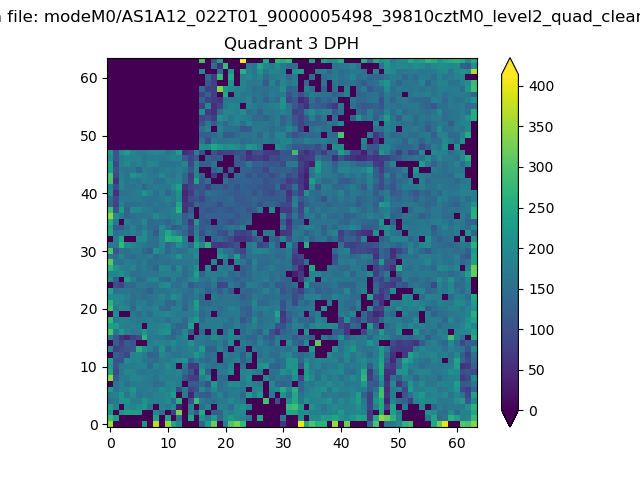 |
 |
Quadrant C |
| Plot type | Count rate plots | Images |
|---|---|---|
| Comparison with Poisson distribution Blue bars denote a histogram of data divided into 1 sec bins. Red curve is a Poisson curve with rate = median count rate of data. |
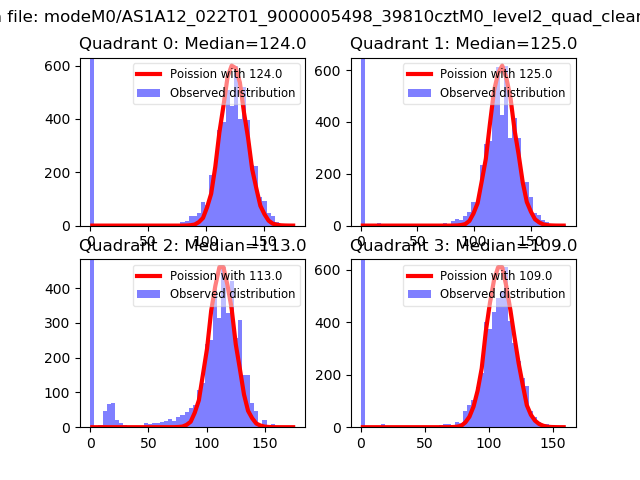 |
 |
| Quadrant-wise count rates Data is divided into 100 sec bins |
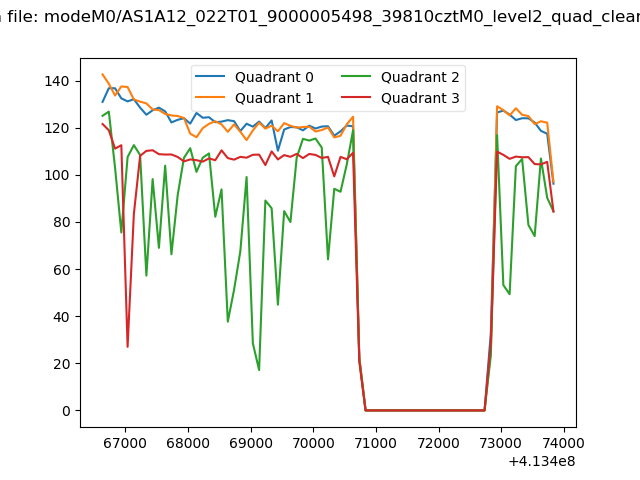 |
|
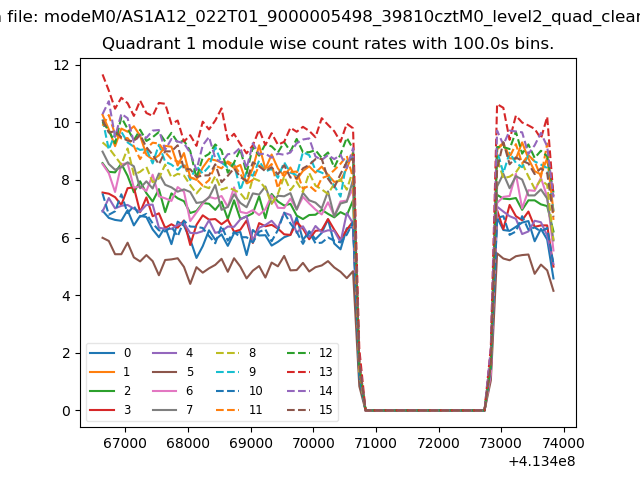
| Module-wise count rates for Quadrant A Data is divided into 100 sec bins |
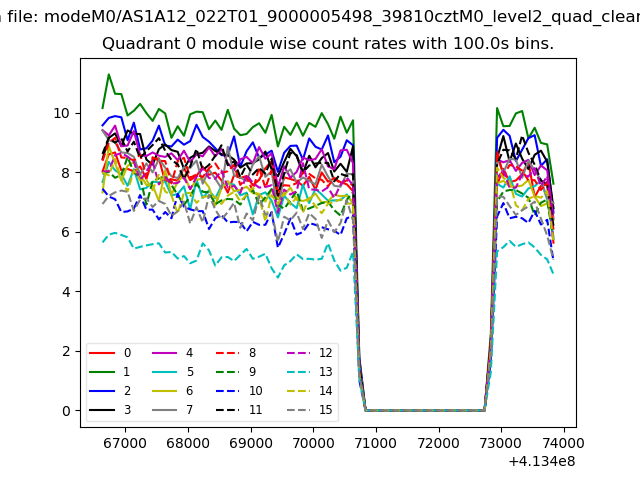 |
 |
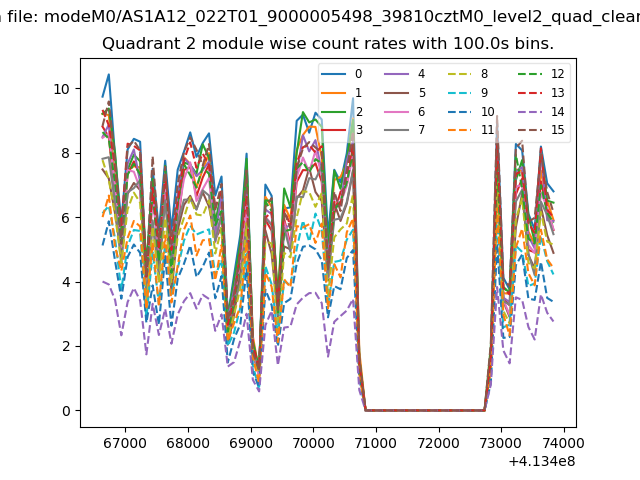
| Module-wise count rates for Quadrant B Data is divided into 100 sec bins |
 |
 |
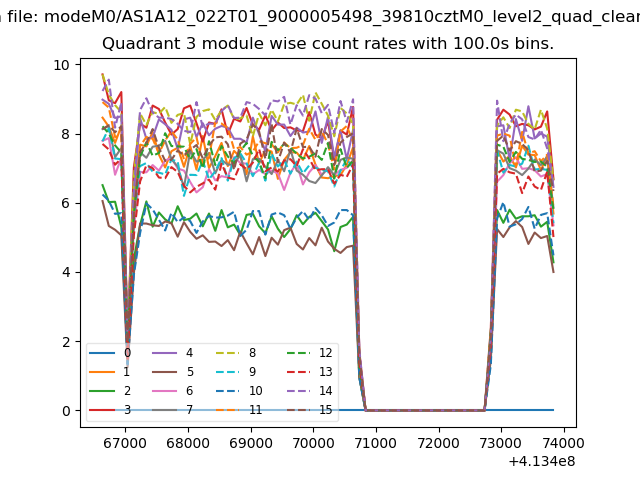
| Module-wise count rates for Quadrant C Data is divided into 100 sec bins |
 |
 |
| Module-wise count rates for Quadrant D Data is divided into 100 sec bins |
 |
 |
| Parameter | Plot |
|---|---|
| CZT HV Monitor | 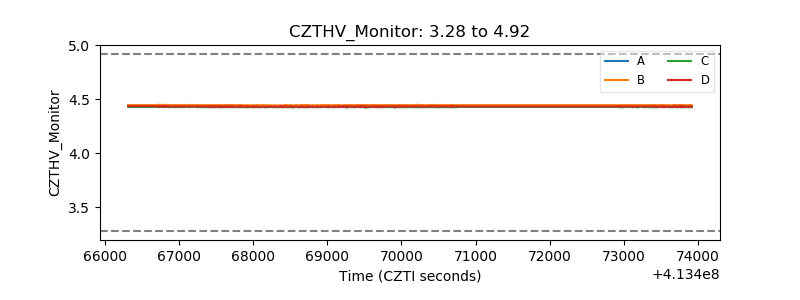 |
| D_VDD | 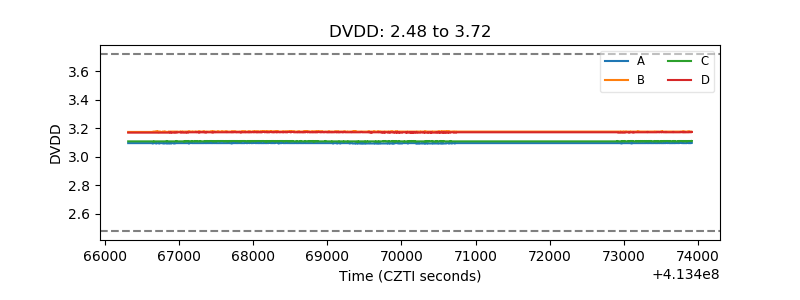 |
| Temperature 1 | 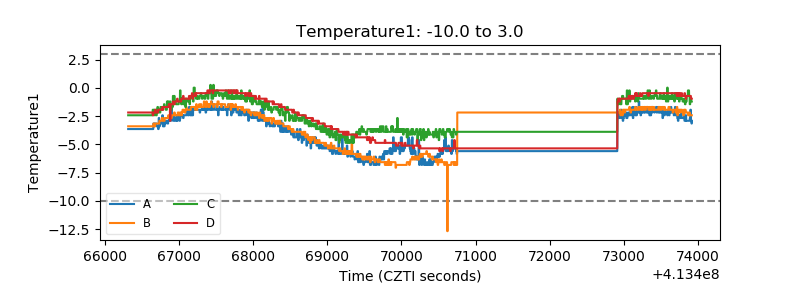 |
| Veto HV Monitor | 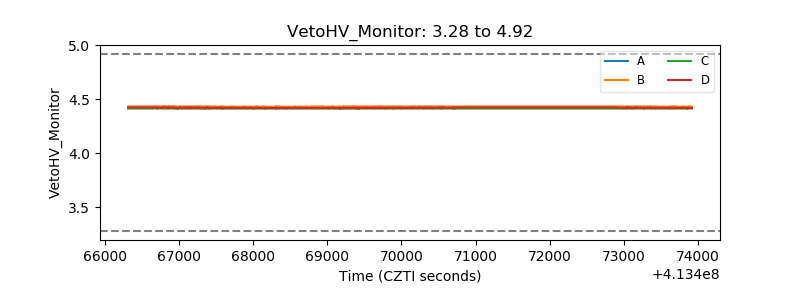 |
| Veto LLD | 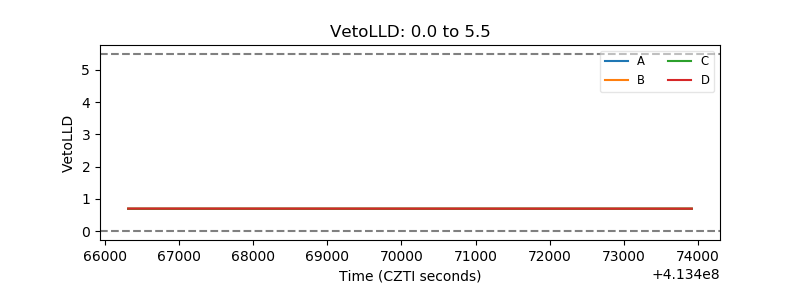 |
| Alpha Counter |  |
| _CPM_Rate | 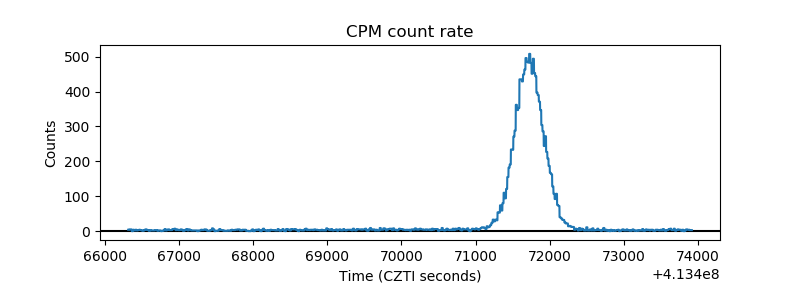 |
| CZT Counter | 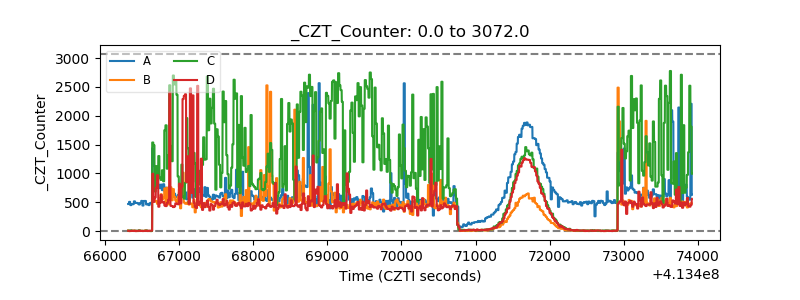 |
| +2.5 Volts monitor | 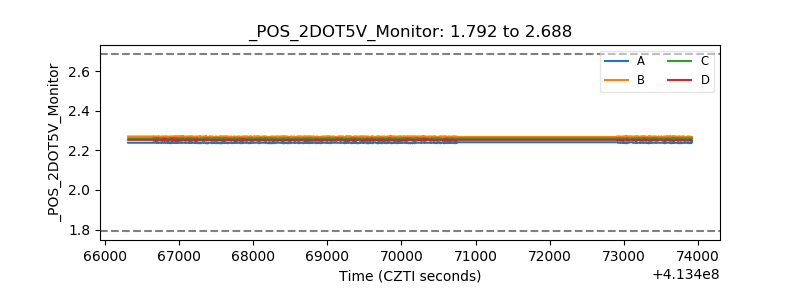 |
| +5 Volts monitor | 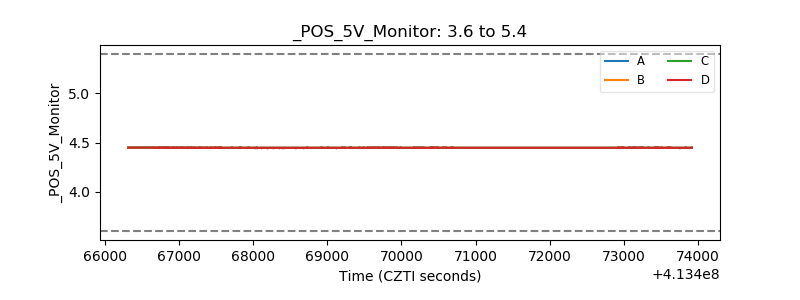 |
| _ROLL_ROT | 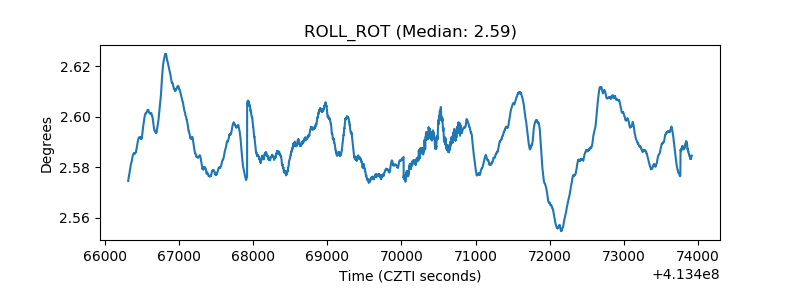 |
| _Roll_DEC | 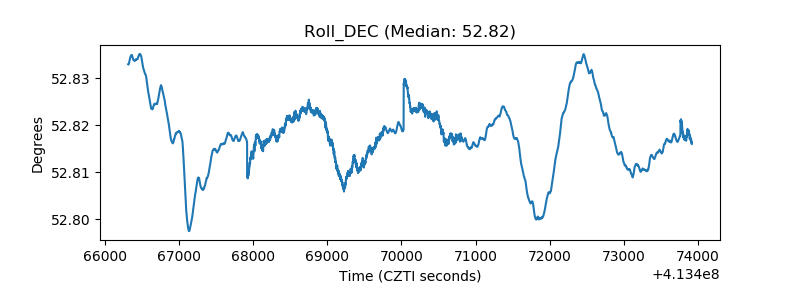 |
| _Roll_RA | 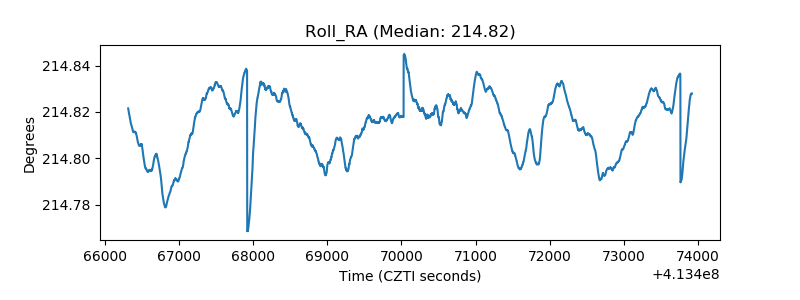 |
| Veto Counter | 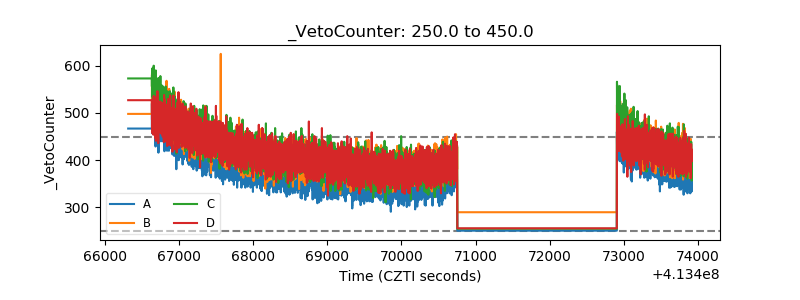 |