| Param | Original file | Final file |
|---|---|---|
| Filename | modeM0/AS1A12_022T01_9000005498_39811cztM0_level2.fits | modeM0/AS1A12_022T01_9000005498_39811cztM0_level2_quad_clean.evt |
| Size (bytes) | 507,193,920 | 79,525,440 |
| Size | 483.7 MB | 75.8 MB |
| Events in quadrant A | 3,372,485 | 604,110 |
| Events in quadrant B | 2,758,517 | 607,574 |
| Events in quadrant C | 9,772,544 | 300,231 |
| Events in quadrant D | 2,470,735 | 535,088 |
| Mode M0 | |||
|---|---|---|---|
| Quadrant | BADHDUFLAG | Total packets | Discarded packets |
| A | 0 | 13526 | 3 |
| B | 0 | 11625 | 2 |
| C | 0 | 32599 | 2 |
| D | 0 | 10959 | 2 |
| Mode M9 | |||
|---|---|---|---|
| Quadrant | BADHDUFLAG | Total packets | Discarded packets |
| A | 0 | 21 | 0 |
| B | 0 | 21 | 0 |
| C | 0 | 21 | 0 |
| D | 0 | 22 | 0 |
| Mode SS | |||
|---|---|---|---|
| Quadrant | BADHDUFLAG | Total packets | Discarded packets |
| A | 0 | 106 | 0 |
| B | 0 | 106 | 0 |
| C | 0 | 106 | 0 |
| D | 0 | 106 | 0 |
| Quadrant | Total seconds | Saturated seconds | Saturation percentage |
|---|---|---|---|
| A | 5146 | 62 | 1.204819% |
| B | 5146 | 98 | 1.904392% |
| C | 5146 | 2782 | 54.061407% |
| D | 5146 | 20 | 0.388651% |
Noise dominated data is calculated using 1-second bins in cleaned event files. If a bin has >2000 counts, and if more than 50% of those come from <1% of pixels, then it is considered to be noise-dominated and hence unusable.
| Quadrant | # 1 sec bins | Bins with >0 counts | Bins with >2000 counts | High rate bins dominated by noise | Noise dominated (total time) | Noise dominated (detector-on time) | Marked lightcurve |
|---|---|---|---|---|---|---|---|
| A | 7179 | 5147 | 48 | 48 | 0.67% | 0.93% | 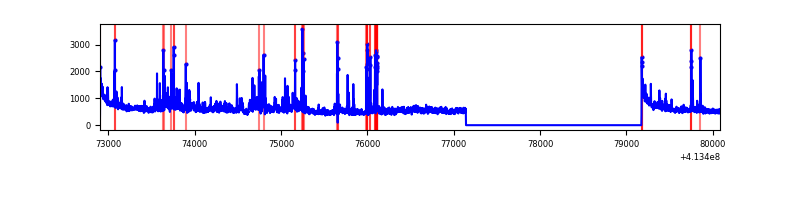 |
| B | 7179 | 5147 | 53 | 53 | 0.74% | 1.03% | 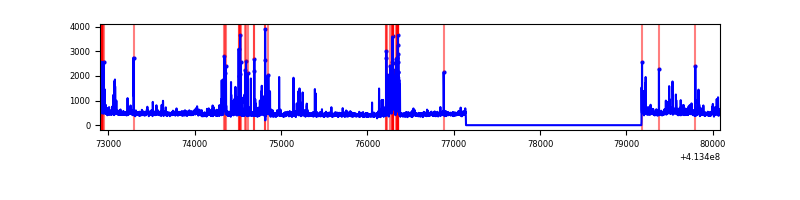 |
| C | 7179 | 5147 | 2575 | 2575 | 35.87% | 50.03% | 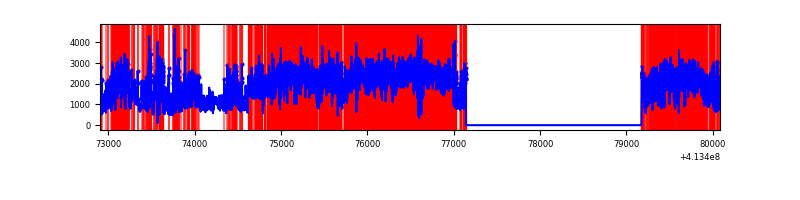 |
| D | 7179 | 5147 | 15 | 15 | 0.21% | 0.29% | 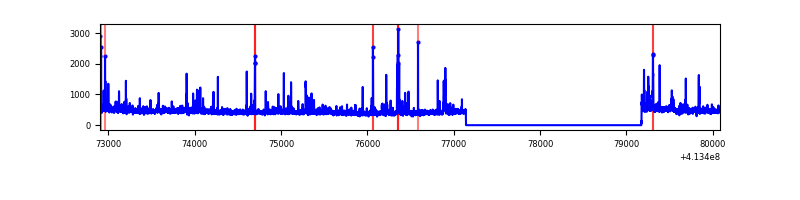 |
Top three noisy pixels from each quadrant. If the there are fewer than three noisy pixels in the level2.evt file, extra rows are filled as -1
| Pixel properties | Quadrant properties | ||||||
|---|---|---|---|---|---|---|---|
| Quadrant | DetID | PixID | Counts | Sigma | Mean | Median | Sigma |
| A | 10 | 83 | 467859 | 4012.75 | 572 | 561 | 116.5 |
| A | 2 | 79 | 322228 | 2762.2 | 572 | 561 | 116.5 |
| A | 9 | 143 | 282933 | 2424.77 | 572 | 561 | 116.5 |
| B | 5 | 172 | 198237 | 1816.96 | 567 | 552 | 108.8 |
| B | 4 | 171 | 194296 | 1780.74 | 567 | 552 | 108.8 |
| B | 5 | 255 | 97532 | 891.36 | 567 | 552 | 108.8 |
| C | 9 | 187 | 5214732 | 49901.22 | 447 | 450 | 104.5 |
| C | 15 | 208 | 2604512 | 24921.14 | 447 | 450 | 104.5 |
| C | 15 | 214 | 177299 | 1692.46 | 447 | 450 | 104.5 |
| D | 2 | 249 | 85783 | 623.46 | 561 | 545 | 136.7 |
| D | 12 | 227 | 61399 | 445.1 | 561 | 545 | 136.7 |
| D | 13 | 249 | 61312 | 444.47 | 561 | 545 | 136.7 |
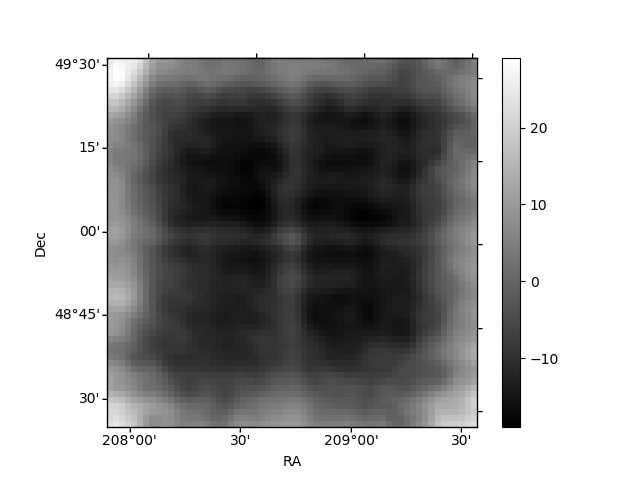
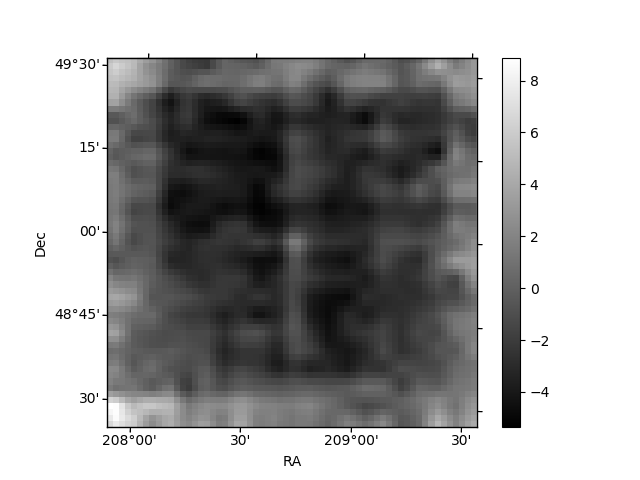
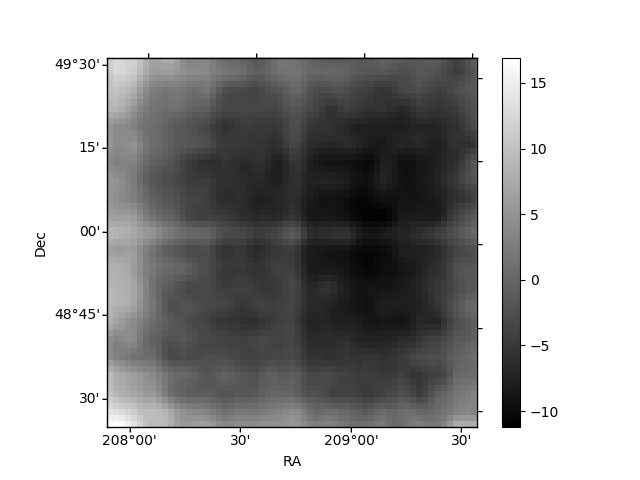
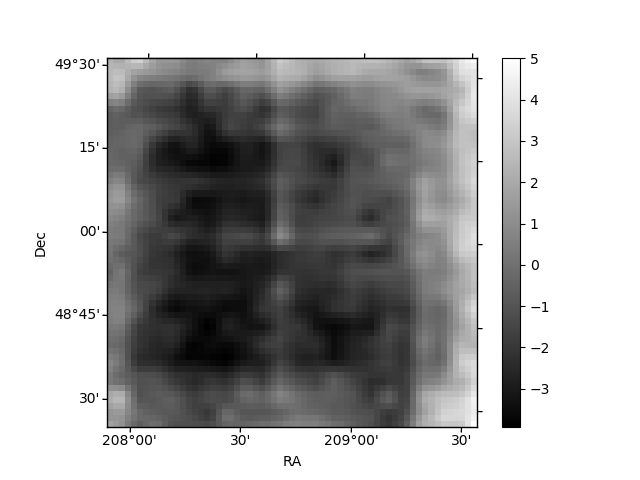
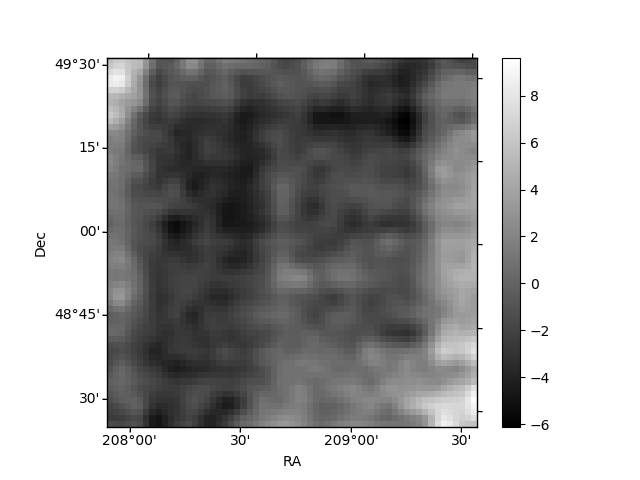
Histogram calculated using DETX and DETY for each event in the final _common_clean file
| Quadrant A | 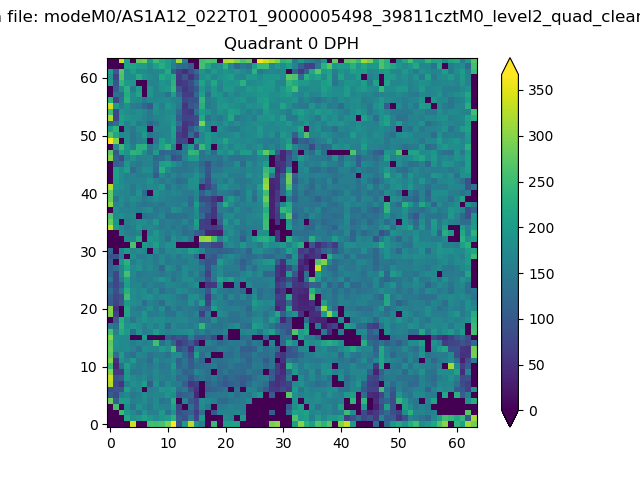 |
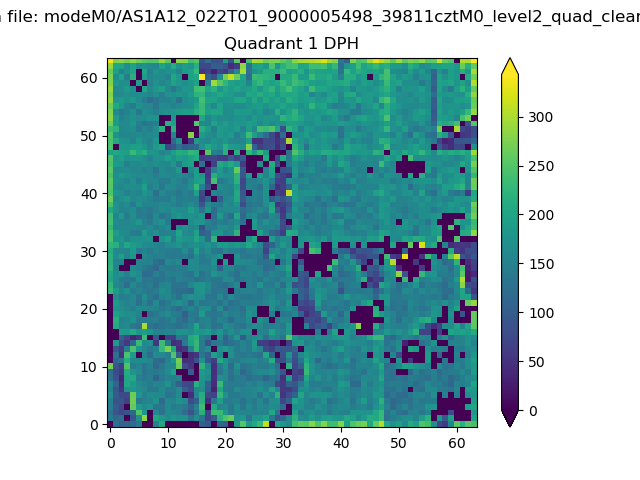 |
Quadrant B |
|---|---|---|---|
| Quadrant D | 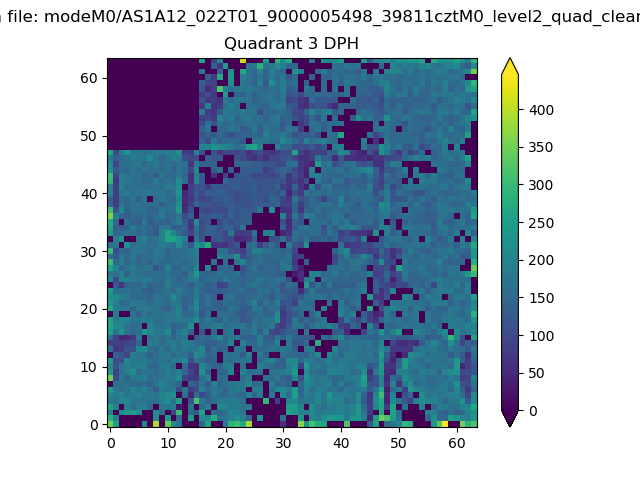 |
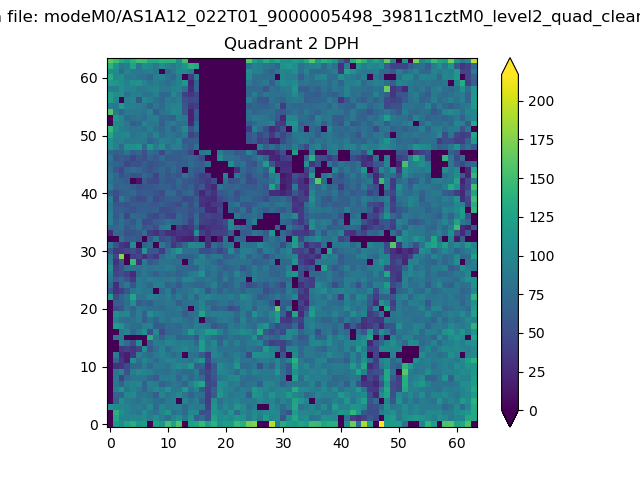 |
Quadrant C |
| Plot type | Count rate plots | Images |
|---|---|---|
| Comparison with Poisson distribution Blue bars denote a histogram of data divided into 1 sec bins. Red curve is a Poisson curve with rate = median count rate of data. |
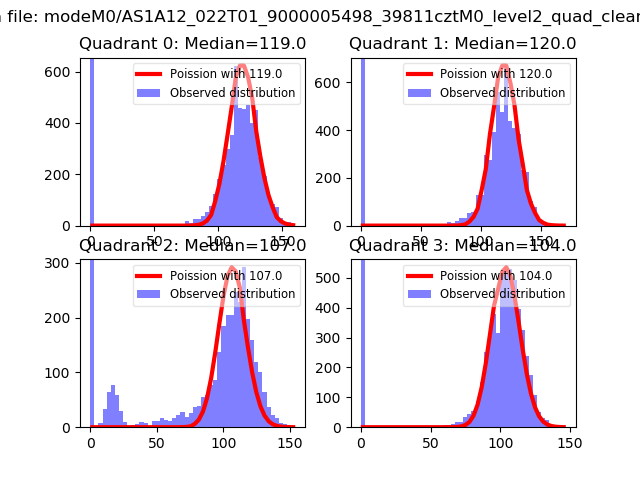 |
 |
| Quadrant-wise count rates Data is divided into 100 sec bins |
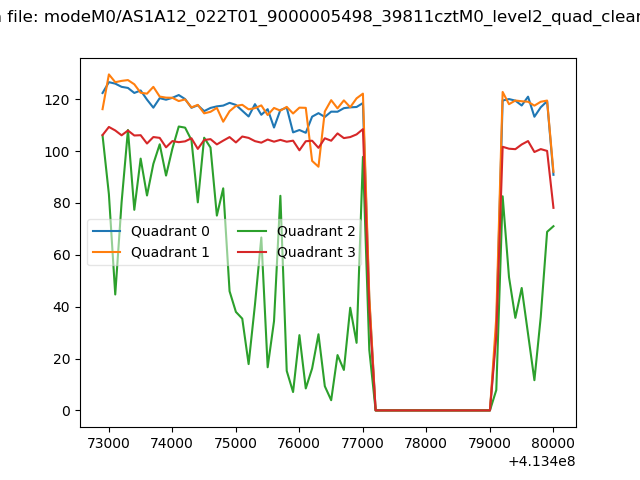 |
|
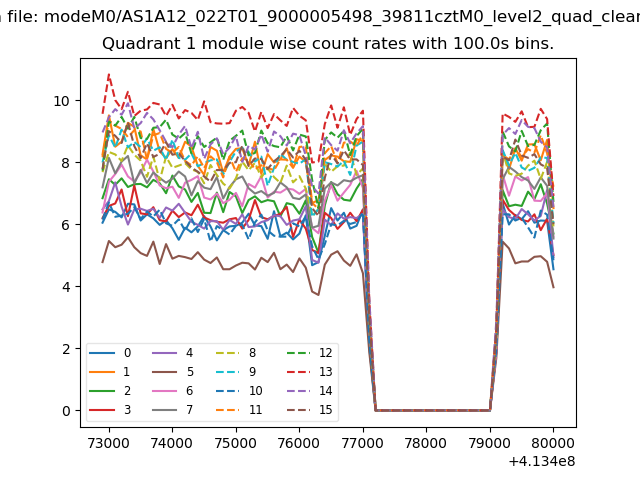
| Module-wise count rates for Quadrant A Data is divided into 100 sec bins |
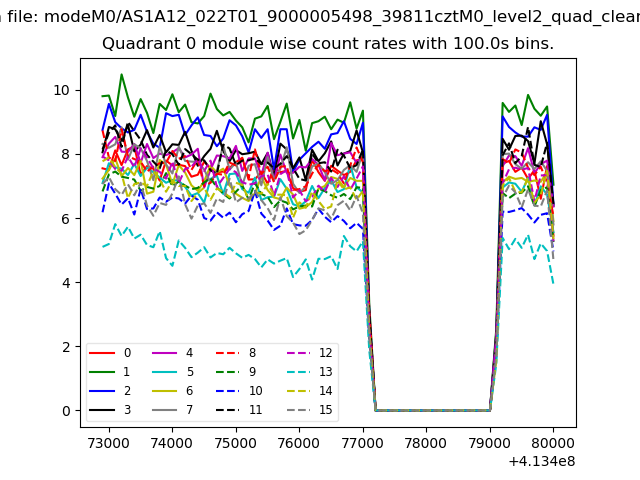 |
 |
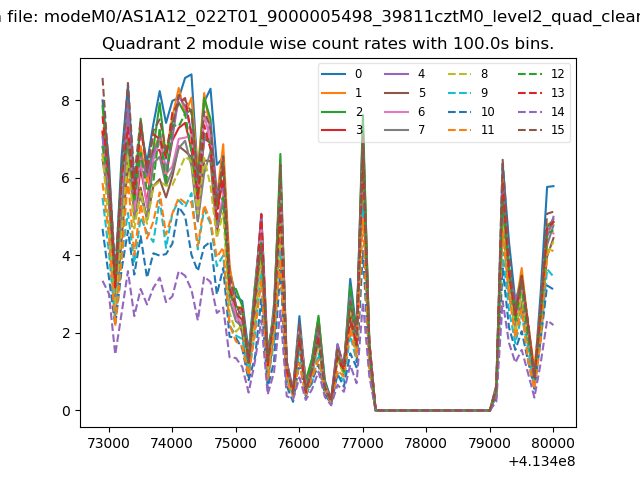
| Module-wise count rates for Quadrant B Data is divided into 100 sec bins |
 |
 |
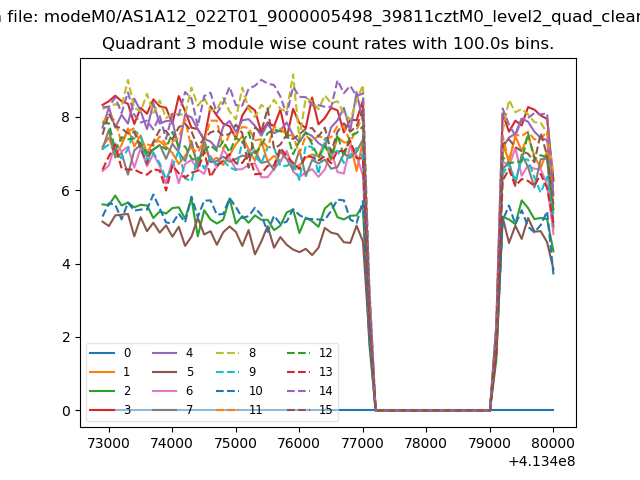
| Module-wise count rates for Quadrant C Data is divided into 100 sec bins |
 |
 |
| Module-wise count rates for Quadrant D Data is divided into 100 sec bins |
 |
 |
| Parameter | Plot |
|---|---|
| CZT HV Monitor | 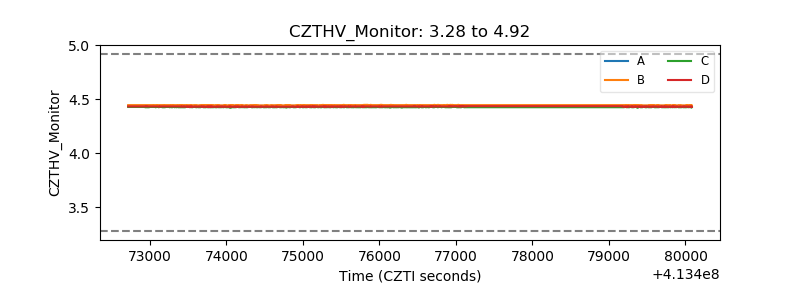 |
| D_VDD | 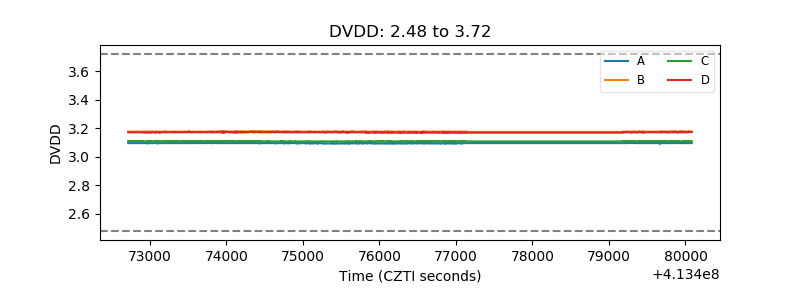 |
| Temperature 1 | 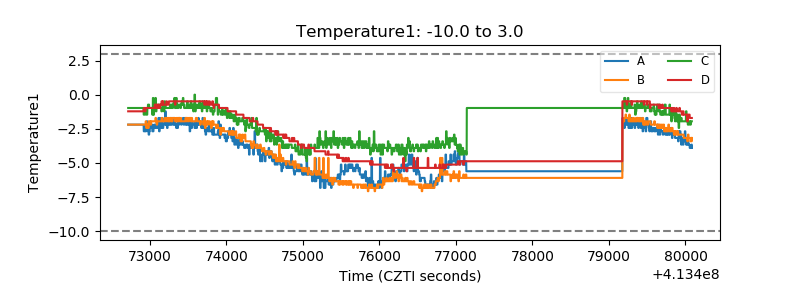 |
| Veto HV Monitor | 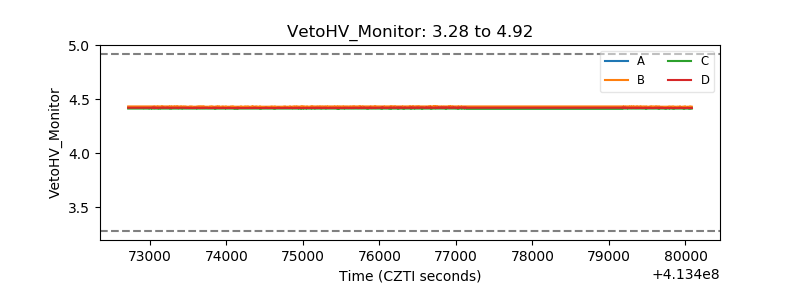 |
| Veto LLD | 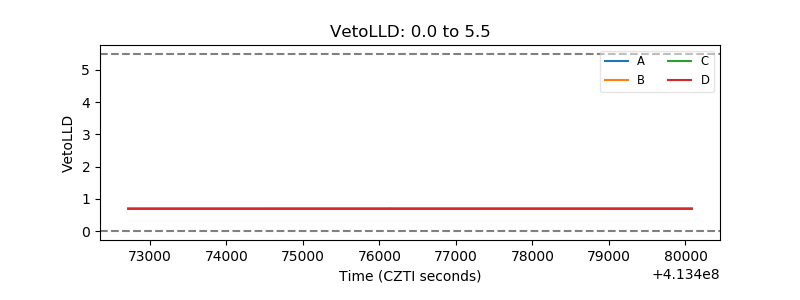 |
| Alpha Counter | 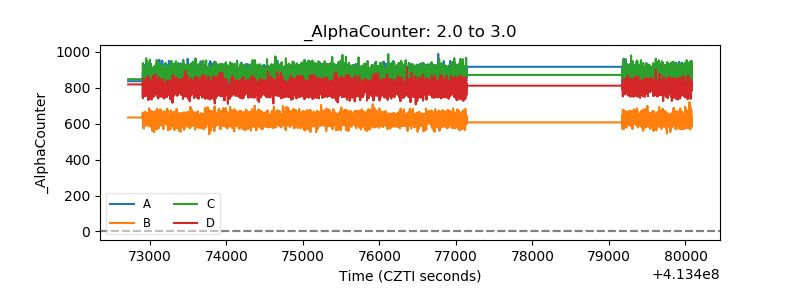 |
| _CPM_Rate | 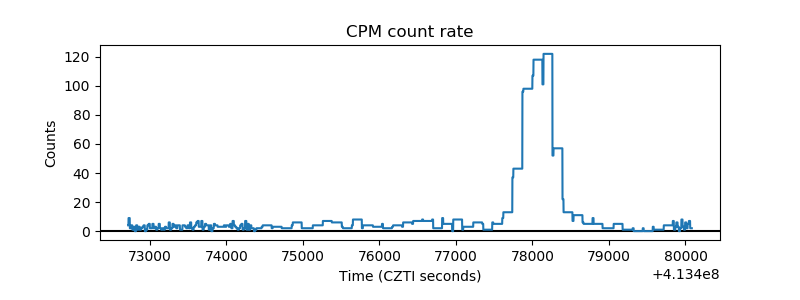 |
| CZT Counter | 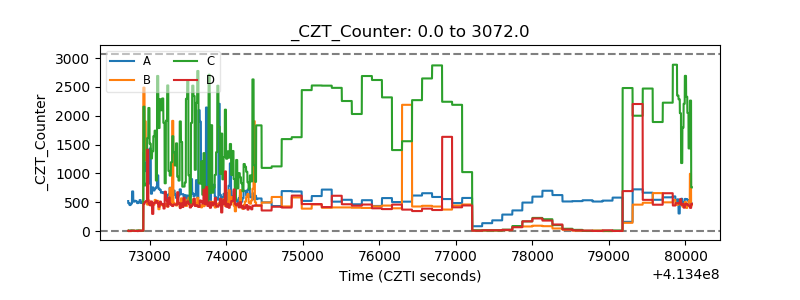 |
| +2.5 Volts monitor | 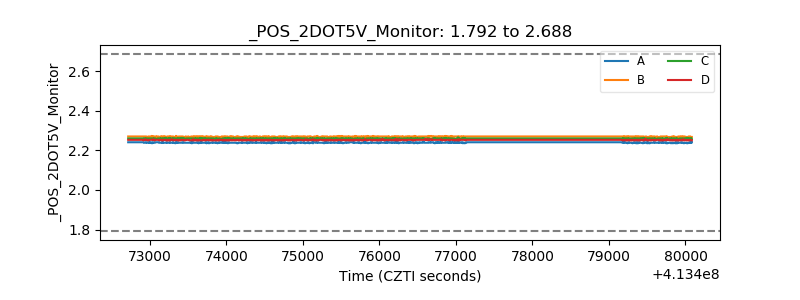 |
| +5 Volts monitor | 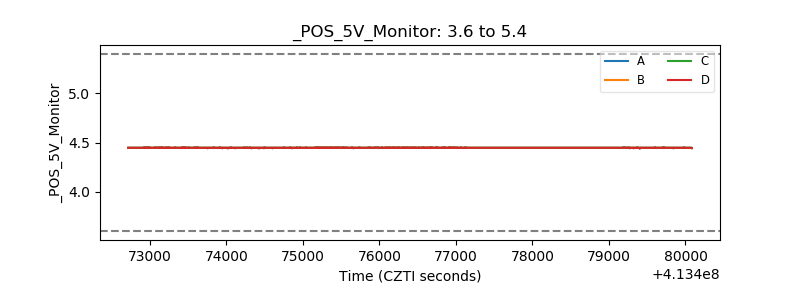 |
| _ROLL_ROT | 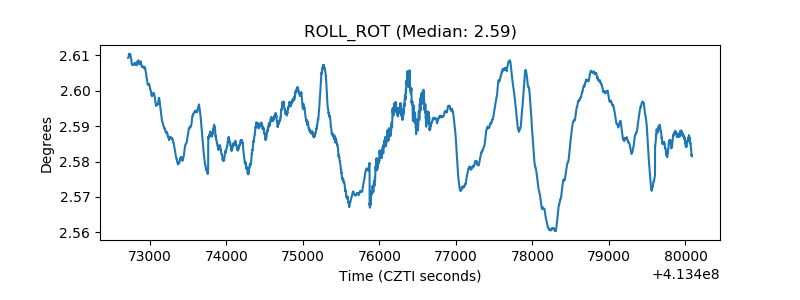 |
| _Roll_DEC | 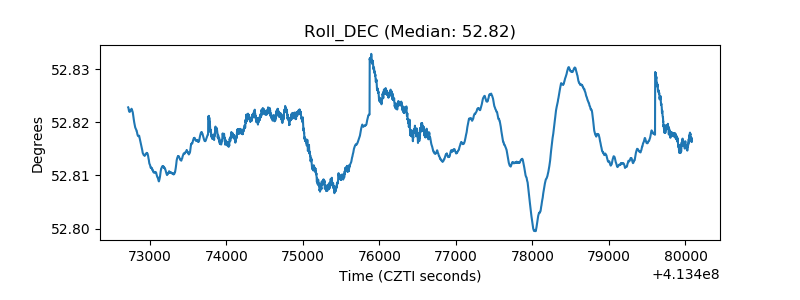 |
| _Roll_RA | 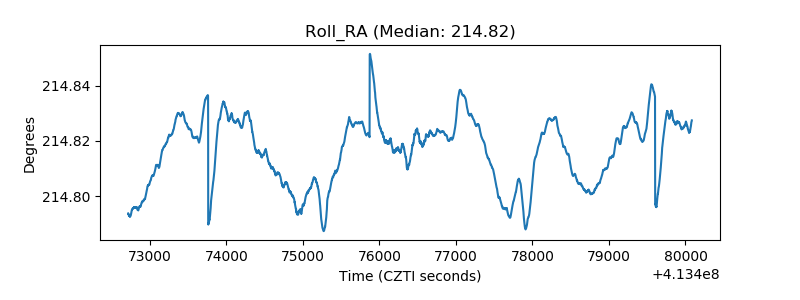 |
| Veto Counter | 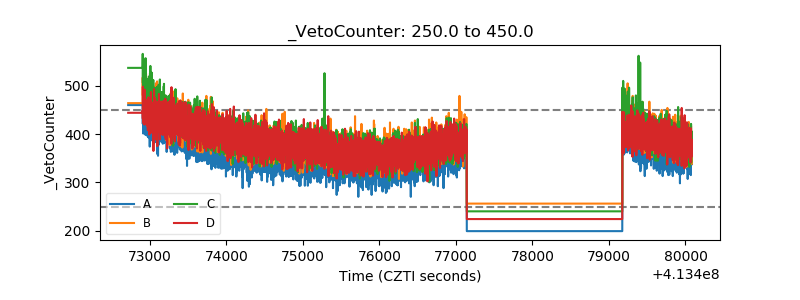 |