| Param | Original file | Final file |
|---|---|---|
| Filename | modeM0/AS1A12_022T01_9000005498_39812cztM0_level2.fits | modeM0/AS1A12_022T01_9000005498_39812cztM0_level2_quad_clean.evt |
| Size (bytes) | 442,143,360 | 83,145,600 |
| Size | 421.7 MB | 79.3 MB |
| Events in quadrant A | 3,465,993 | 583,458 |
| Events in quadrant B | 2,812,572 | 609,512 |
| Events in quadrant C | 7,049,256 | 415,049 |
| Events in quadrant D | 2,622,788 | 535,347 |
| Mode M0 | |||
|---|---|---|---|
| Quadrant | BADHDUFLAG | Total packets | Discarded packets |
| A | 0 | 13717 | 3 |
| B | 0 | 12067 | 2 |
| C | 0 | 24517 | 17 |
| D | 0 | 11663 | 2 |
| Mode M9 | |||
|---|---|---|---|
| Quadrant | BADHDUFLAG | Total packets | Discarded packets |
| A | 0 | 19 | 0 |
| B | 0 | 19 | 0 |
| C | 0 | 19 | 0 |
| D | 0 | 20 | 0 |
| Mode SS | |||
|---|---|---|---|
| Quadrant | BADHDUFLAG | Total packets | Discarded packets |
| A | 0 | 108 | 0 |
| B | 0 | 108 | 0 |
| C | 0 | 108 | 0 |
| D | 0 | 108 | 0 |
| Quadrant | Total seconds | Saturated seconds | Saturation percentage |
|---|---|---|---|
| A | 5347 | 241 | 4.507200% |
| B | 5347 | 66 | 1.234337% |
| C | 5345 | 1719 | 32.160898% |
| D | 5347 | 72 | 1.346549% |
Noise dominated data is calculated using 1-second bins in cleaned event files. If a bin has >2000 counts, and if more than 50% of those come from <1% of pixels, then it is considered to be noise-dominated and hence unusable.
| Quadrant | # 1 sec bins | Bins with >0 counts | Bins with >2000 counts | High rate bins dominated by noise | Noise dominated (total time) | Noise dominated (detector-on time) | Marked lightcurve |
|---|---|---|---|---|---|---|---|
| A | 7080 | 5348 | 207 | 207 | 2.92% | 3.87% | 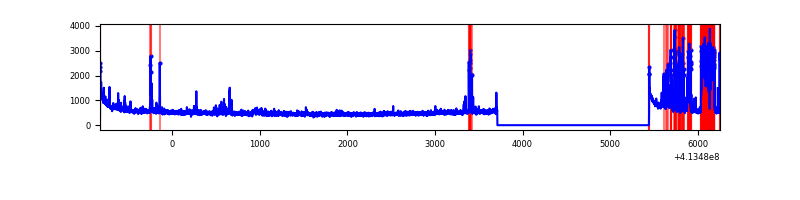 |
| B | 7080 | 5348 | 30 | 30 | 0.42% | 0.56% | 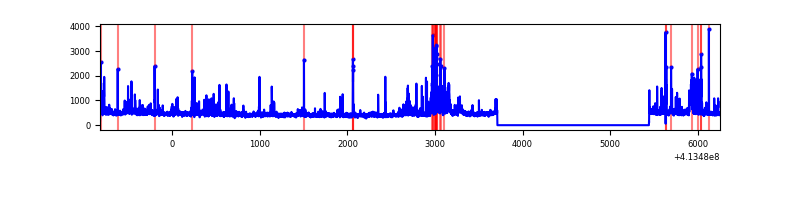 |
| C | 7080 | 5347 | 1414 | 1414 | 19.97% | 26.44% | 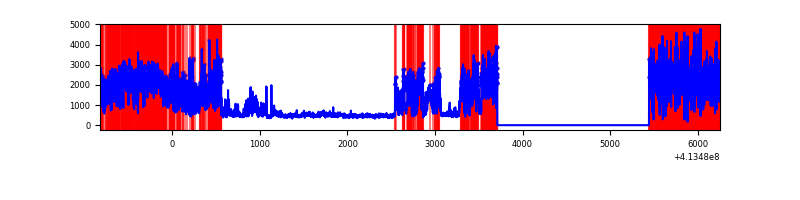 |
| D | 7080 | 5348 | 15 | 15 | 0.21% | 0.28% | 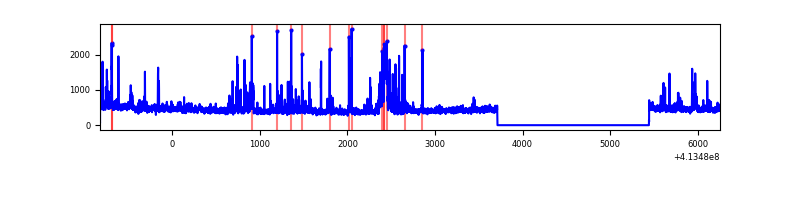 |
Top three noisy pixels from each quadrant. If the there are fewer than three noisy pixels in the level2.evt file, extra rows are filled as -1
| Pixel properties | Quadrant properties | ||||||
|---|---|---|---|---|---|---|---|
| Quadrant | DetID | PixID | Counts | Sigma | Mean | Median | Sigma |
| A | 6 | 10 | 661250 | 5682.09 | 570 | 559 | 116.3 |
| A | 10 | 83 | 466624 | 4008.27 | 570 | 559 | 116.3 |
| A | 2 | 79 | 50647 | 430.77 | 570 | 559 | 116.3 |
| B | 4 | 171 | 259286 | 2317.61 | 577 | 563 | 111.6 |
| B | 5 | 255 | 96083 | 855.66 | 577 | 563 | 111.6 |
| B | 5 | 172 | 72586 | 645.17 | 577 | 563 | 111.6 |
| C | 9 | 187 | 3456158 | 30047.88 | 488 | 491 | 115.0 |
| C | 15 | 208 | 1482680 | 12888.0 | 488 | 491 | 115.0 |
| C | 15 | 214 | 195193 | 1692.98 | 488 | 491 | 115.0 |
| D | 2 | 249 | 98464 | 702.01 | 566 | 549 | 139.5 |
| D | 12 | 227 | 97239 | 693.23 | 566 | 549 | 139.5 |
| D | 2 | 250 | 74950 | 533.43 | 566 | 549 | 139.5 |
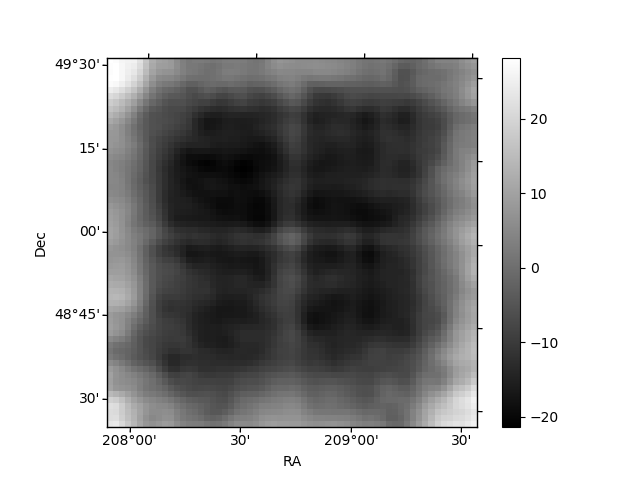
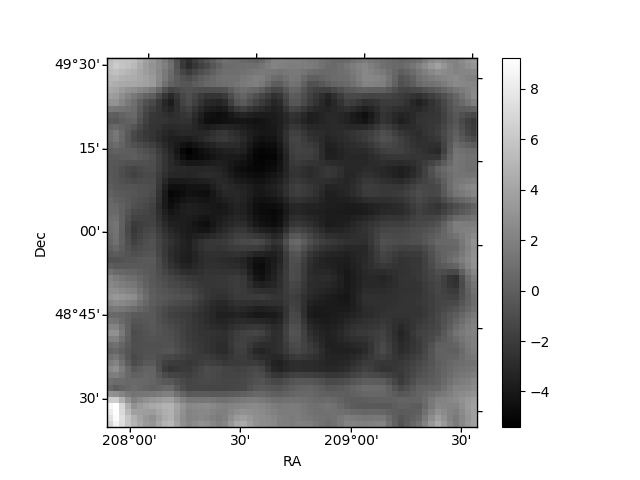
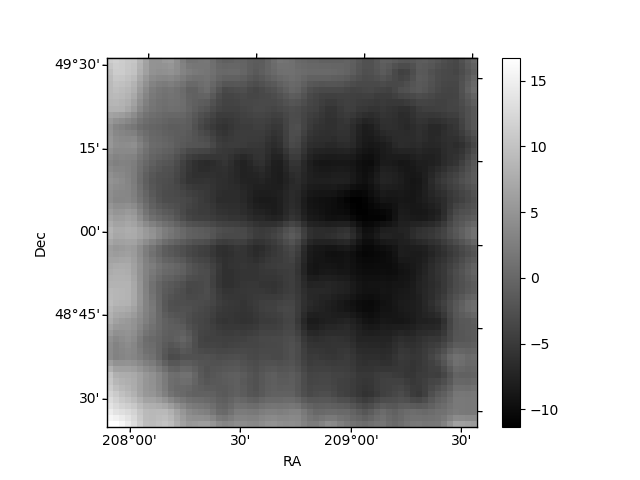
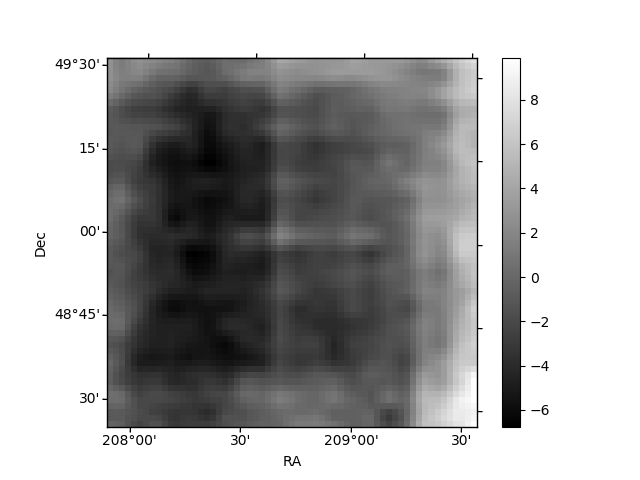
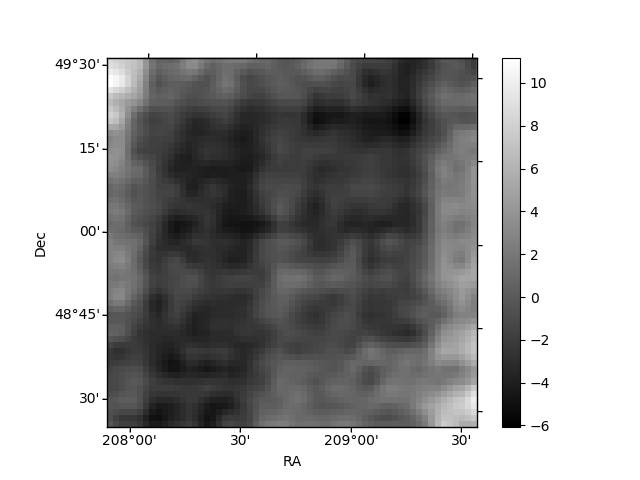
Histogram calculated using DETX and DETY for each event in the final _common_clean file
| Quadrant A | 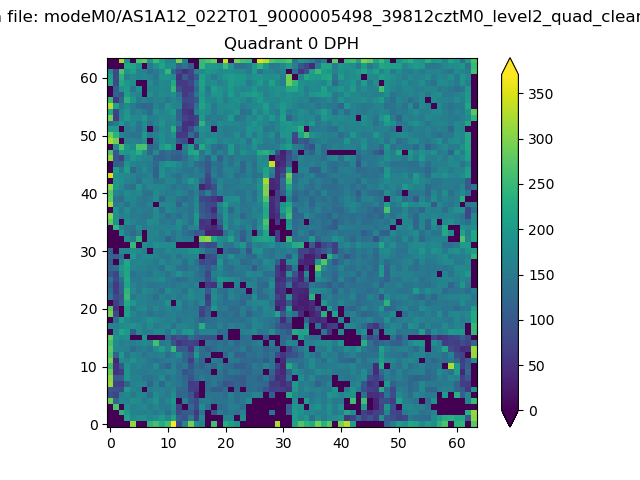 |
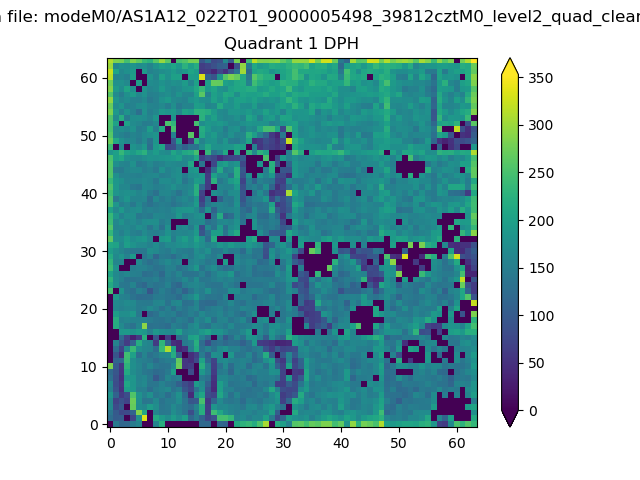 |
Quadrant B |
|---|---|---|---|
| Quadrant D | 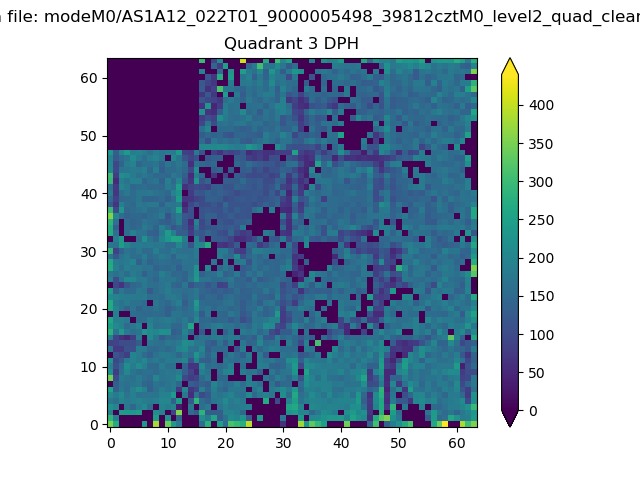 |
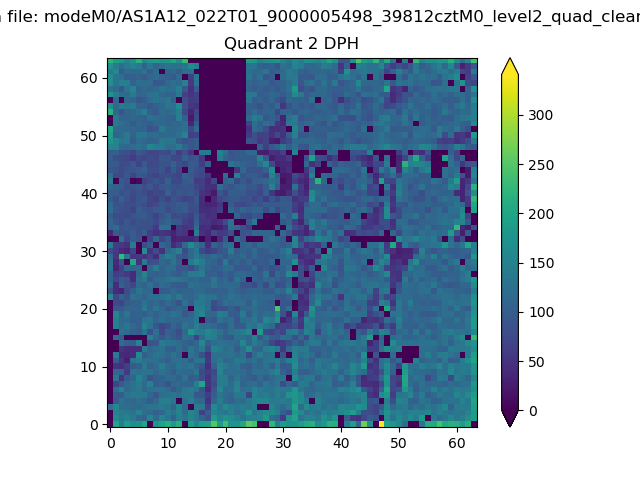 |
Quadrant C |
| Plot type | Count rate plots | Images |
|---|---|---|
| Comparison with Poisson distribution Blue bars denote a histogram of data divided into 1 sec bins. Red curve is a Poisson curve with rate = median count rate of data. |
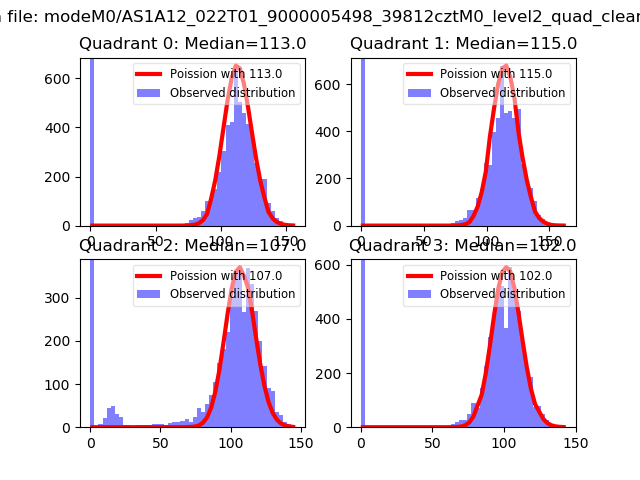 |
 |
| Quadrant-wise count rates Data is divided into 100 sec bins |
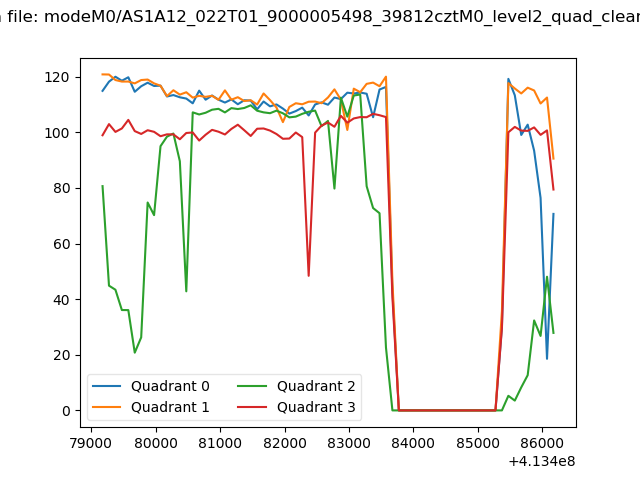 |
|
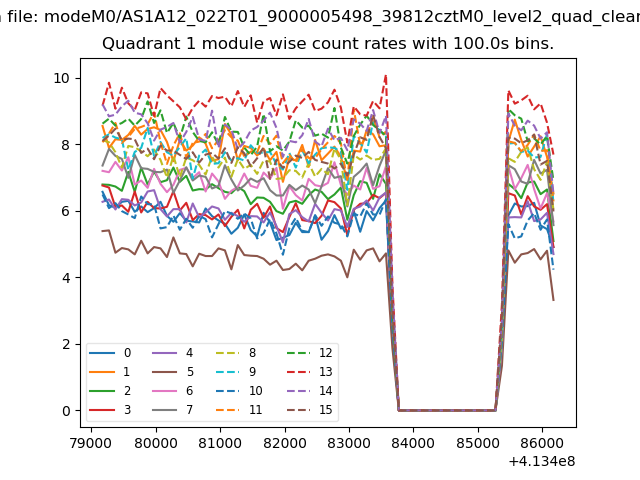
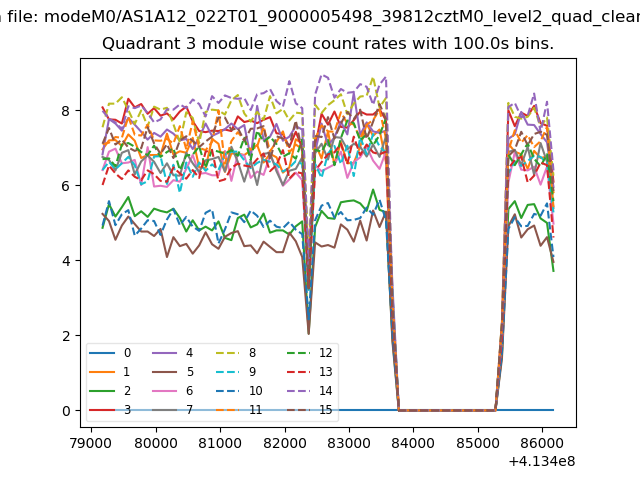
| Module-wise count rates for Quadrant A Data is divided into 100 sec bins |
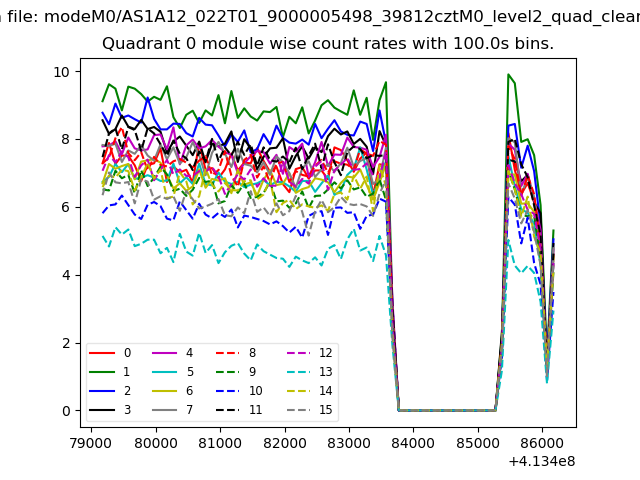 |
 |
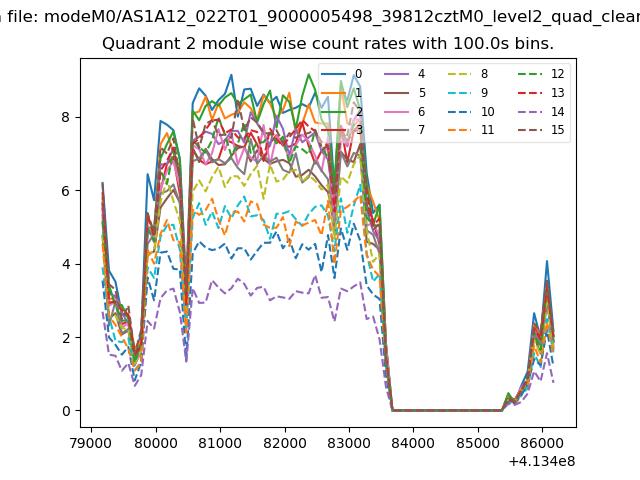
| Module-wise count rates for Quadrant B Data is divided into 100 sec bins |
 |
 |
| Module-wise count rates for Quadrant C Data is divided into 100 sec bins |
 |
 |
| Module-wise count rates for Quadrant D Data is divided into 100 sec bins |
 |
 |
| Parameter | Plot |
|---|---|
| CZT HV Monitor | 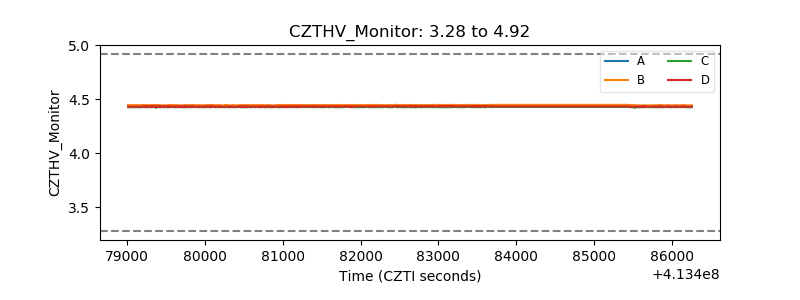 |
| D_VDD | 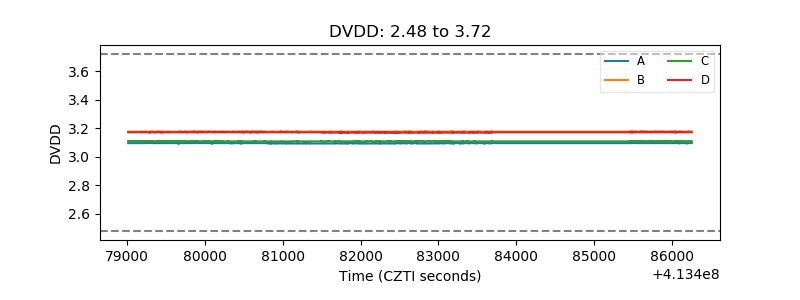 |
| Temperature 1 | 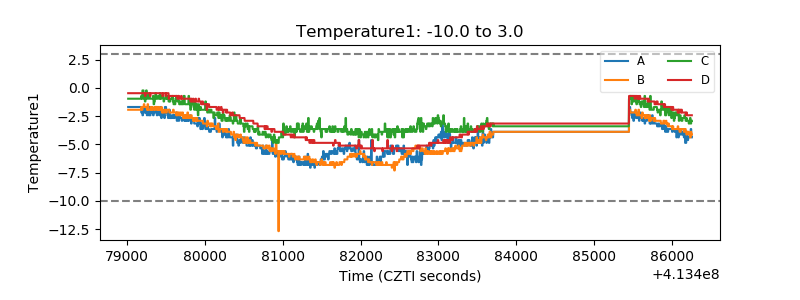 |
| Veto HV Monitor | 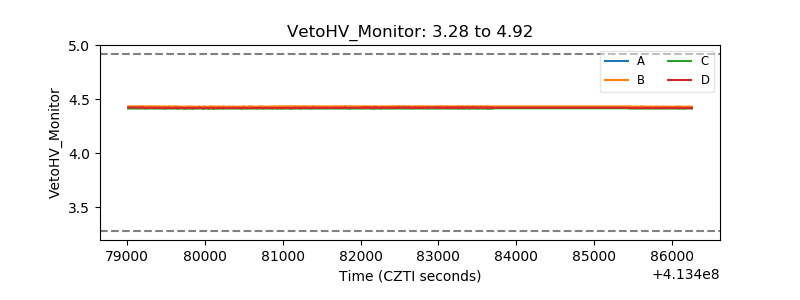 |
| Veto LLD | 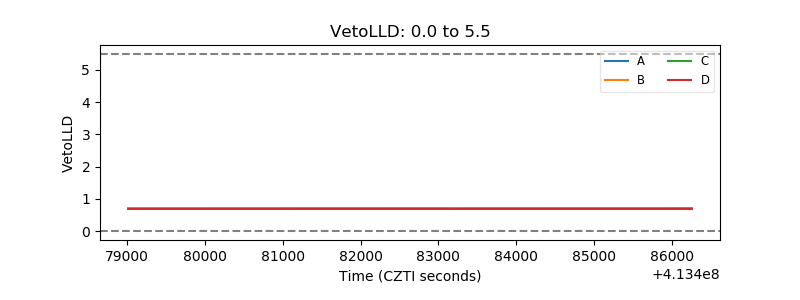 |
| Alpha Counter | 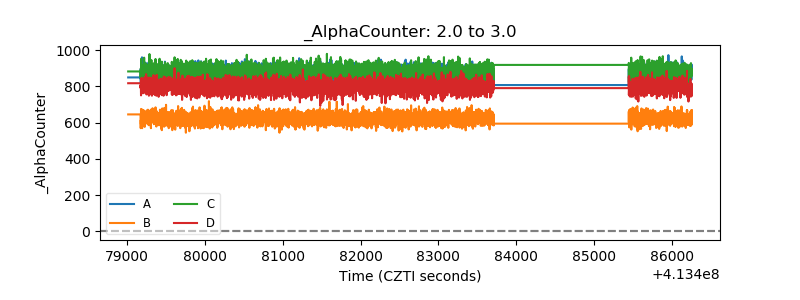 |
| _CPM_Rate | 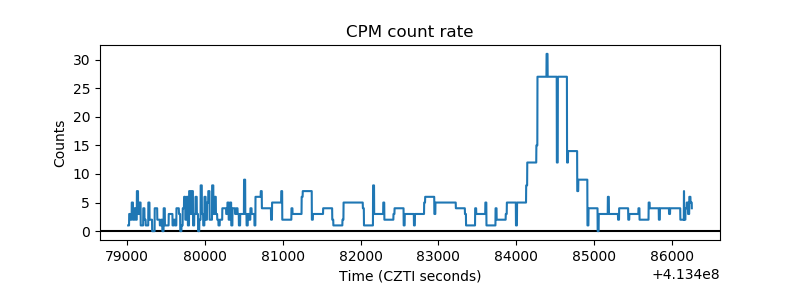 |
| CZT Counter | 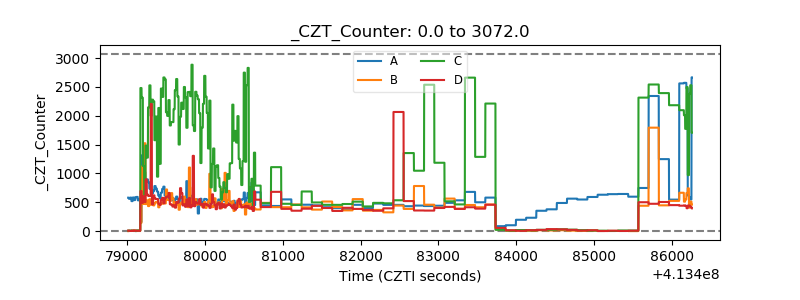 |
| +2.5 Volts monitor | 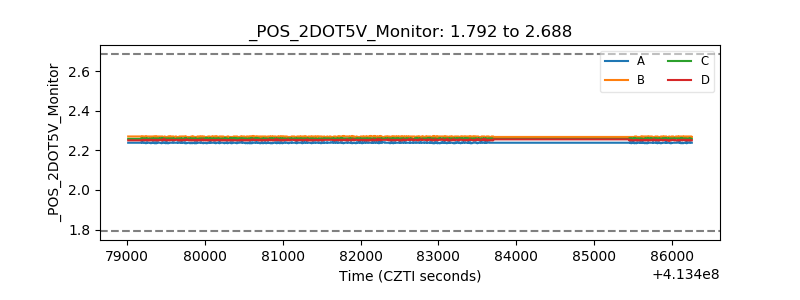 |
| +5 Volts monitor | 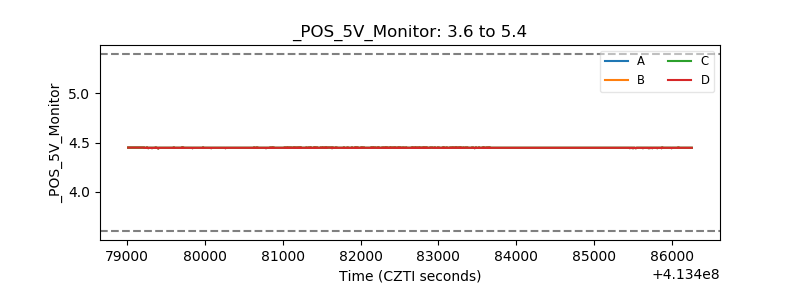 |
| _ROLL_ROT | 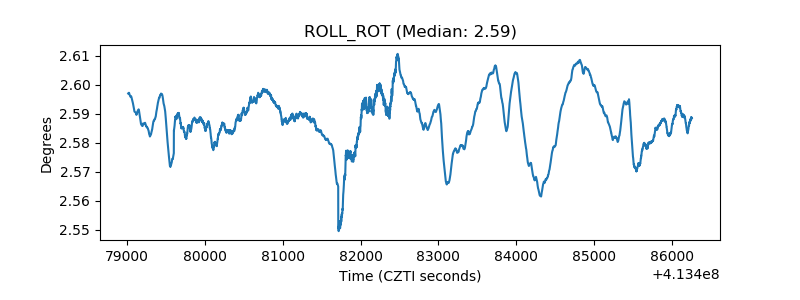 |
| _Roll_DEC |  |
| _Roll_RA | 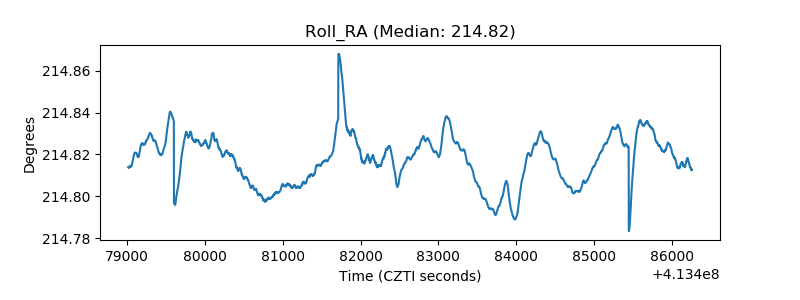 |
| Veto Counter | 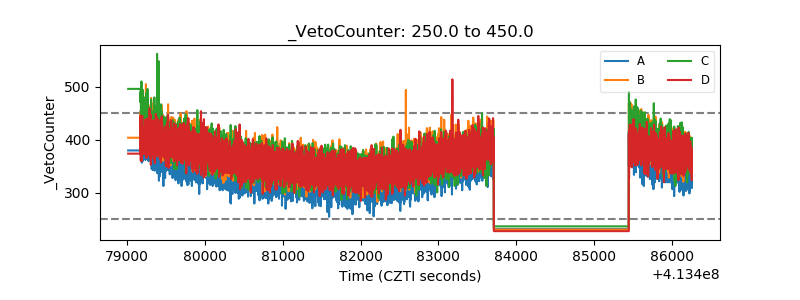 |