| Param | Original file | Final file |
|---|---|---|
| Filename | modeM0/AS1A12_022T01_9000005498_39813cztM0_level2.fits | modeM0/AS1A12_022T01_9000005498_39813cztM0_level2_quad_clean.evt |
| Size (bytes) | 878,463,360 | 141,022,080 |
| Size | 837.8 MB | 134.5 MB |
| Events in quadrant A | 6,196,285 | 1,010,409 |
| Events in quadrant B | 5,300,376 | 1,053,159 |
| Events in quadrant C | 15,702,768 | 599,729 |
| Events in quadrant D | 4,581,454 | 947,340 |
| Mode M0 | |||
|---|---|---|---|
| Quadrant | BADHDUFLAG | Total packets | Discarded packets |
| A | 0 | 24485 | 3 |
| B | 0 | 22478 | 2 |
| C | 0 | 53036 | 2 |
| D | 0 | 20759 | 2 |
| Mode M9 | |||
|---|---|---|---|
| Quadrant | BADHDUFLAG | Total packets | Discarded packets |
| A | 0 | 32 | 0 |
| B | 0 | 32 | 0 |
| C | 0 | 32 | 0 |
| D | 0 | 32 | 0 |
| Mode SS | |||
|---|---|---|---|
| Quadrant | BADHDUFLAG | Total packets | Discarded packets |
| A | 0 | 194 | 0 |
| B | 0 | 194 | 0 |
| C | 0 | 194 | 0 |
| D | 0 | 194 | 0 |
| Quadrant | Total seconds | Saturated seconds | Saturation percentage |
|---|---|---|---|
| A | 9504 | 483 | 5.082071% |
| B | 9504 | 250 | 2.630471% |
| C | 9504 | 4408 | 46.380471% |
| D | 9504 | 128 | 1.346801% |
Noise dominated data is calculated using 1-second bins in cleaned event files. If a bin has >2000 counts, and if more than 50% of those come from <1% of pixels, then it is considered to be noise-dominated and hence unusable.
| Quadrant | # 1 sec bins | Bins with >0 counts | Bins with >2000 counts | High rate bins dominated by noise | Noise dominated (total time) | Noise dominated (detector-on time) | Marked lightcurve |
|---|---|---|---|---|---|---|---|
| A | 12640 | 9506 | 446 | 446 | 3.53% | 4.69% | 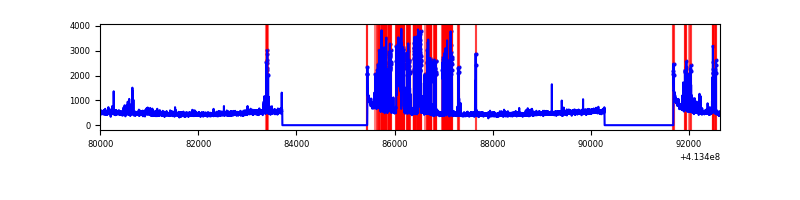 |
| B | 12640 | 9506 | 174 | 174 | 1.38% | 1.83% | 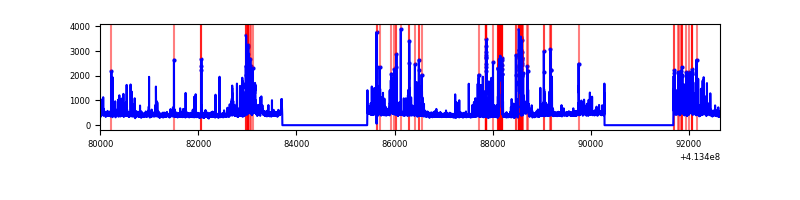 |
| C | 12640 | 9505 | 3875 | 3875 | 30.66% | 40.77% | 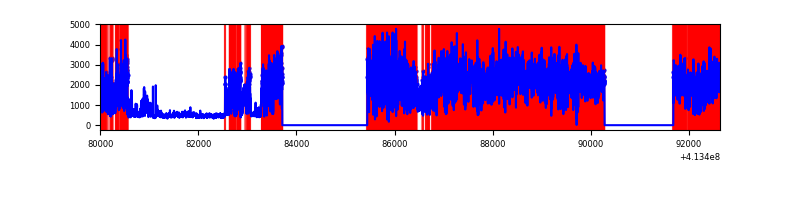 |
| D | 12640 | 9506 | 50 | 50 | 0.40% | 0.53% | 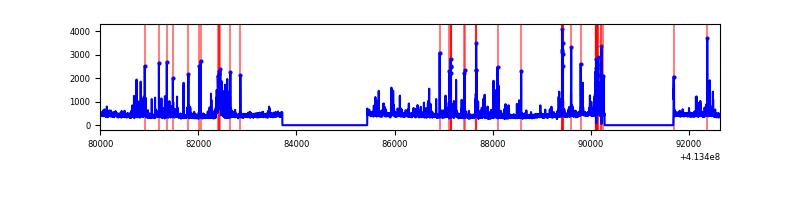 |
Top three noisy pixels from each quadrant. If the there are fewer than three noisy pixels in the level2.evt file, extra rows are filled as -1
| Pixel properties | Quadrant properties | ||||||
|---|---|---|---|---|---|---|---|
| Quadrant | DetID | PixID | Counts | Sigma | Mean | Median | Sigma |
| A | 6 | 10 | 1328914 | 6526.04 | 998 | 977 | 203.5 |
| A | 10 | 83 | 670403 | 3289.84 | 998 | 977 | 203.5 |
| A | 13 | 248 | 224314 | 1097.57 | 998 | 977 | 203.5 |
| B | 4 | 171 | 535296 | 2783.73 | 1005 | 979 | 191.9 |
| B | 5 | 255 | 341052 | 1771.74 | 1005 | 979 | 191.9 |
| B | 0 | 229 | 240470 | 1247.72 | 1005 | 979 | 191.9 |
| C | 9 | 187 | 9092804 | 48720.44 | 801 | 805 | 186.6 |
| C | 15 | 208 | 3150926 | 16880.26 | 801 | 805 | 186.6 |
| C | 15 | 214 | 316998 | 1694.35 | 801 | 805 | 186.6 |
| D | 2 | 249 | 200722 | 828.16 | 990 | 964 | 241.2 |
| D | 13 | 249 | 168640 | 695.15 | 990 | 964 | 241.2 |
| D | 2 | 250 | 116035 | 477.06 | 990 | 964 | 241.2 |
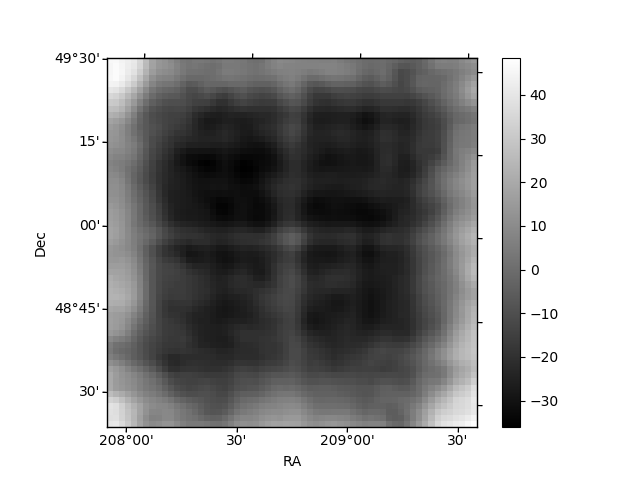
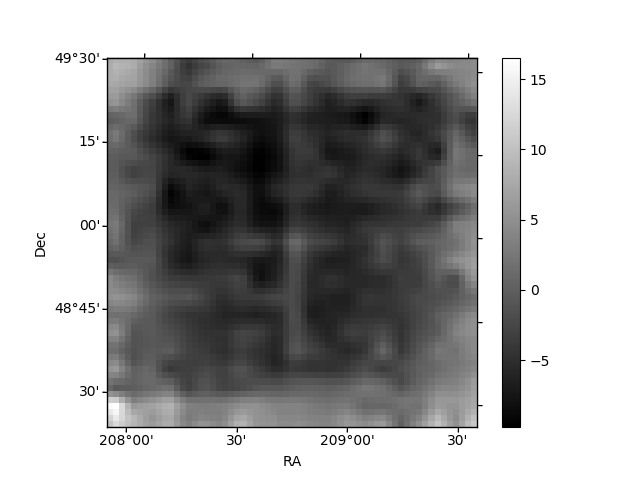
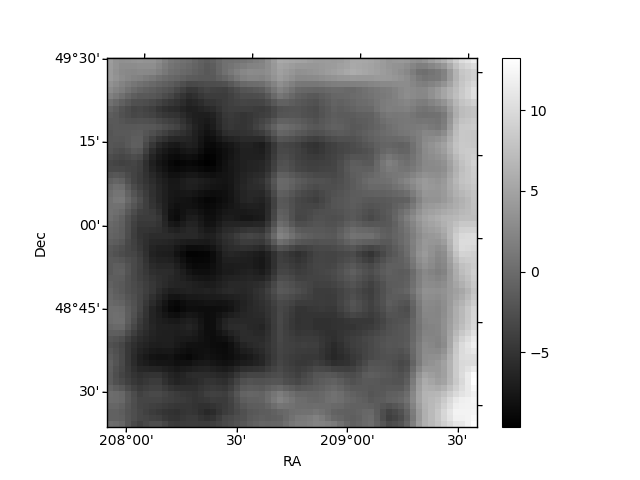
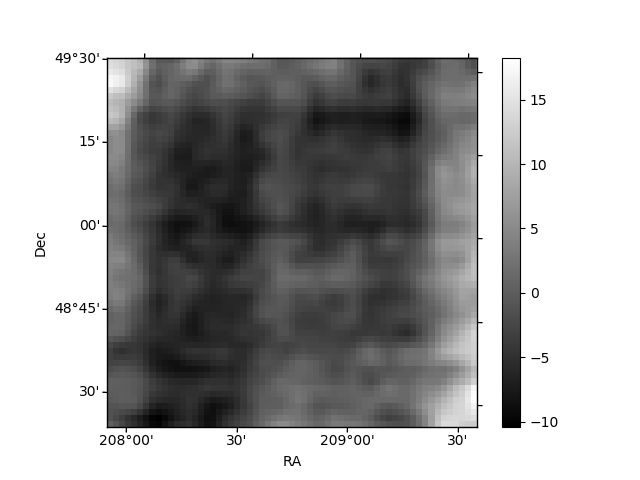
Histogram calculated using DETX and DETY for each event in the final _common_clean file
| Quadrant A | 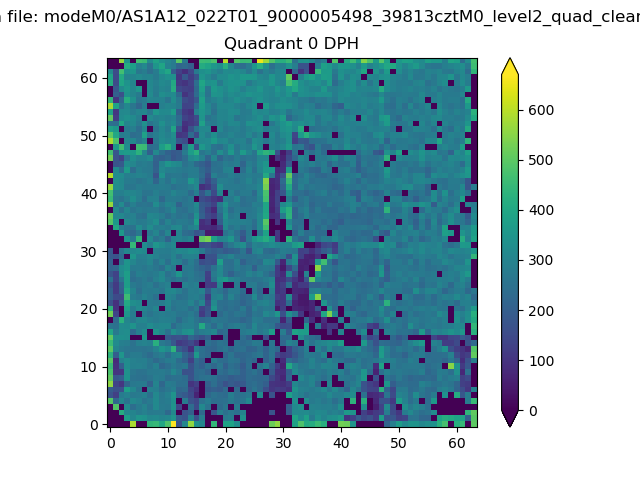 |
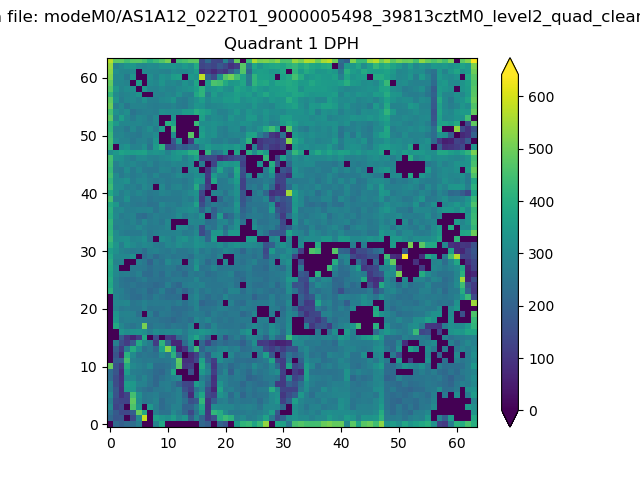 |
Quadrant B |
|---|---|---|---|
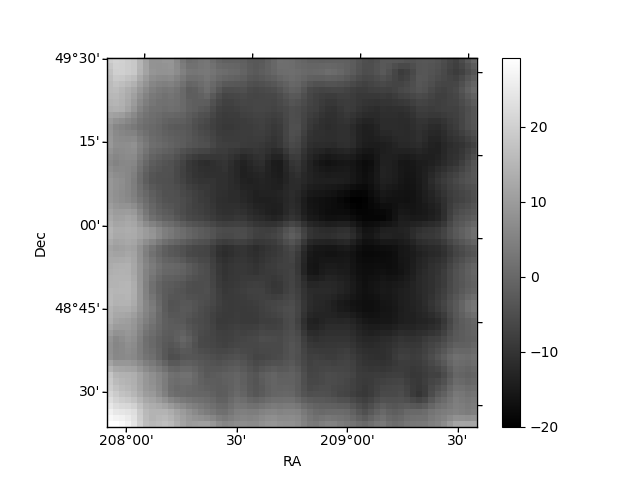
| Quadrant D | 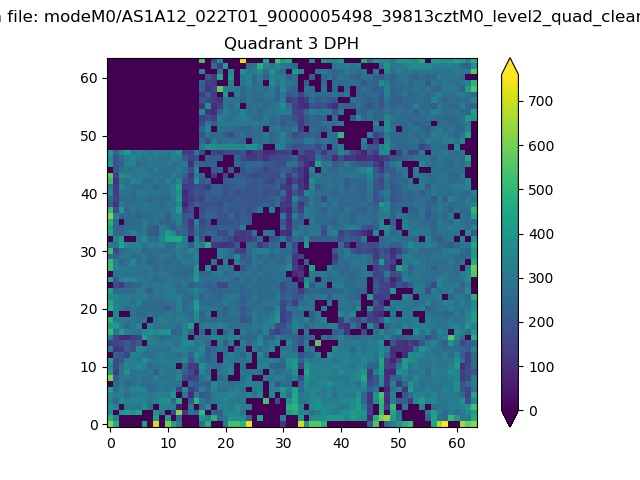 |
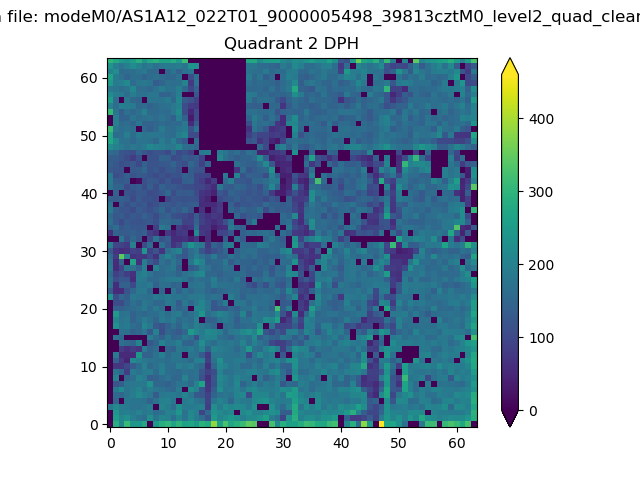 |
Quadrant C |
| Plot type | Count rate plots | Images |
|---|---|---|
| Comparison with Poisson distribution Blue bars denote a histogram of data divided into 1 sec bins. Red curve is a Poisson curve with rate = median count rate of data. |
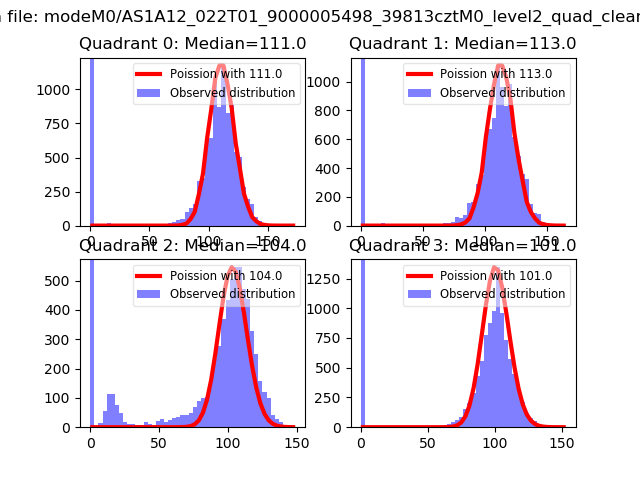 |
 |
| Quadrant-wise count rates Data is divided into 100 sec bins |
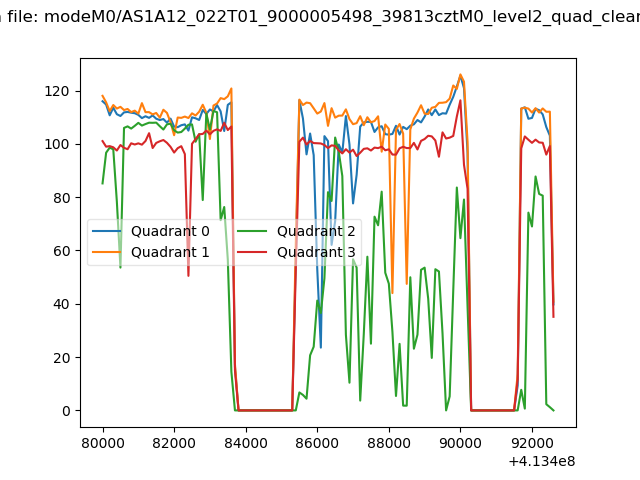 |
|
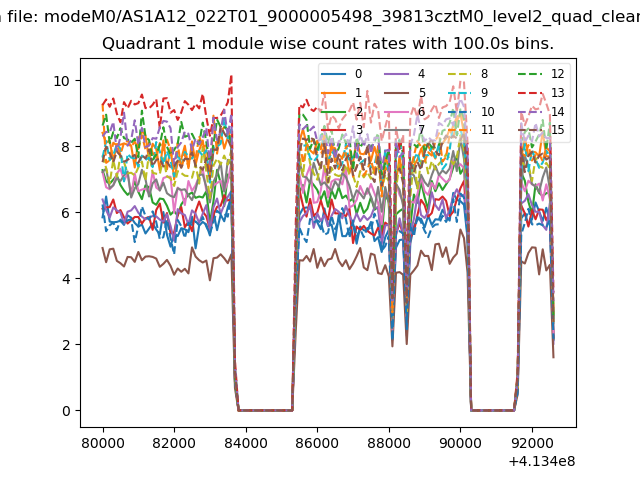
| Module-wise count rates for Quadrant A Data is divided into 100 sec bins |
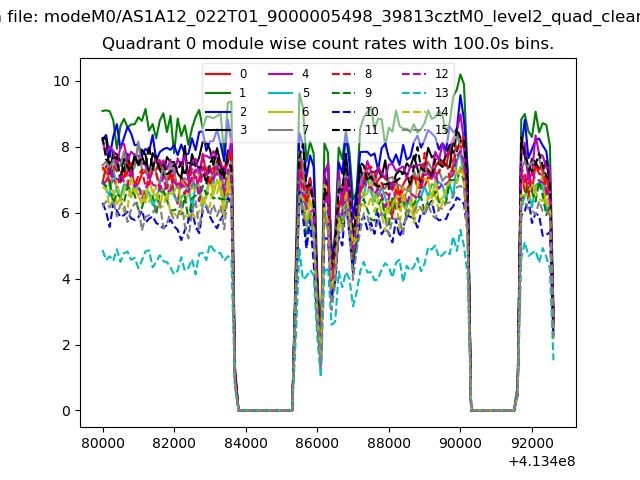 |
 |
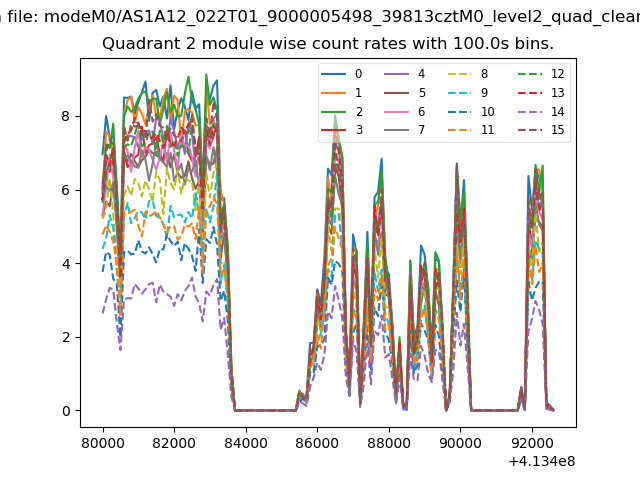
| Module-wise count rates for Quadrant B Data is divided into 100 sec bins |
 |
 |
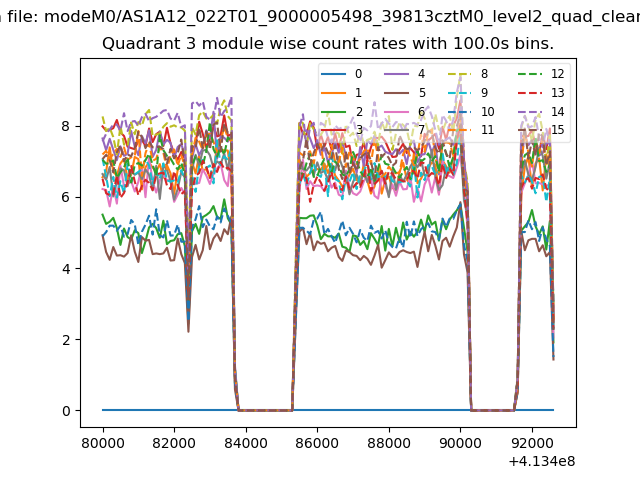
| Module-wise count rates for Quadrant C Data is divided into 100 sec bins |
 |
 |
| Module-wise count rates for Quadrant D Data is divided into 100 sec bins |
 |
 |
| Parameter | Plot |
|---|---|
| CZT HV Monitor | 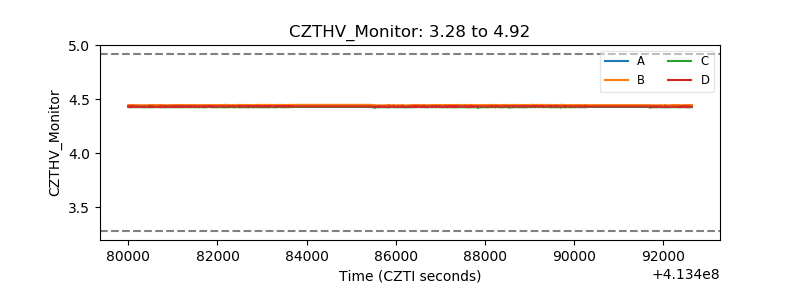 |
| D_VDD | 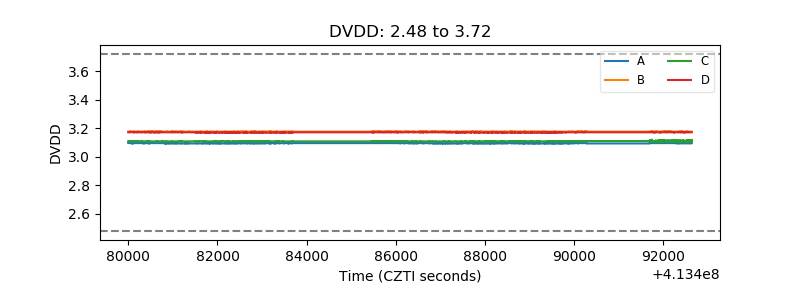 |
| Temperature 1 | 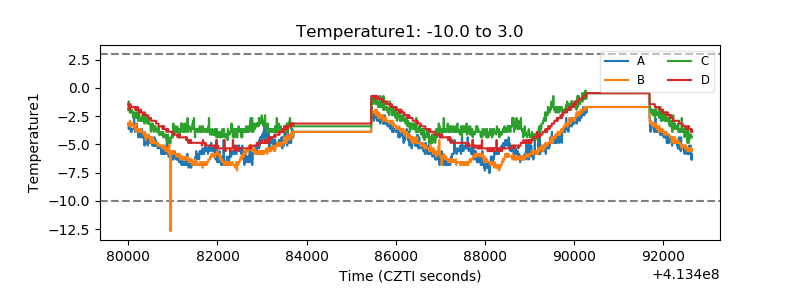 |
| Veto HV Monitor | 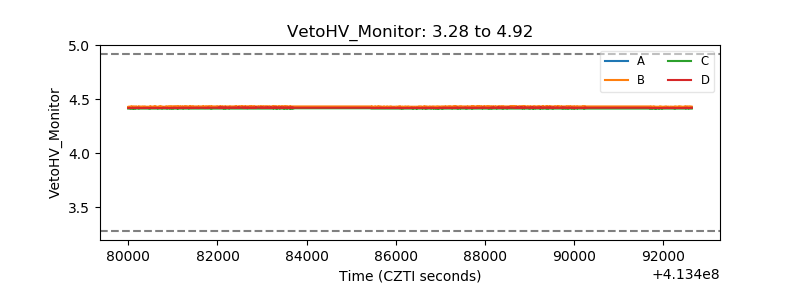 |
| Veto LLD | 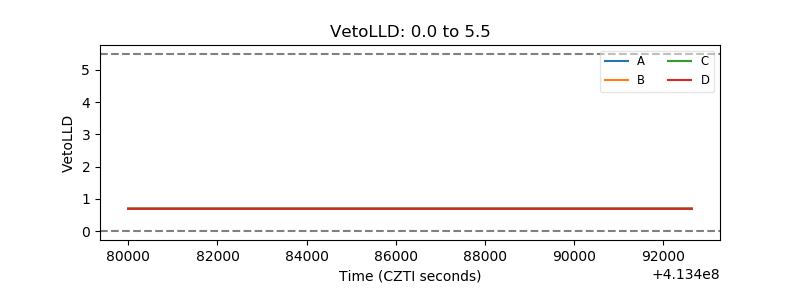 |
| Alpha Counter | 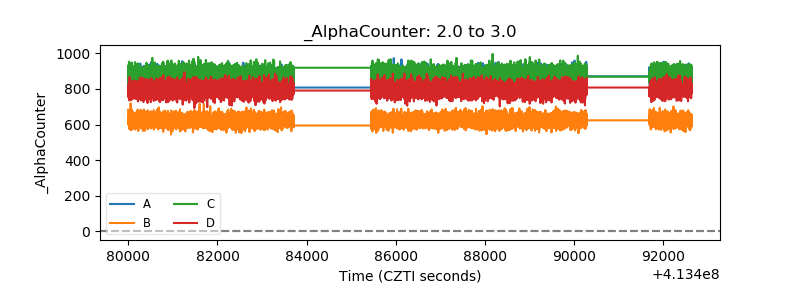 |
| _CPM_Rate | 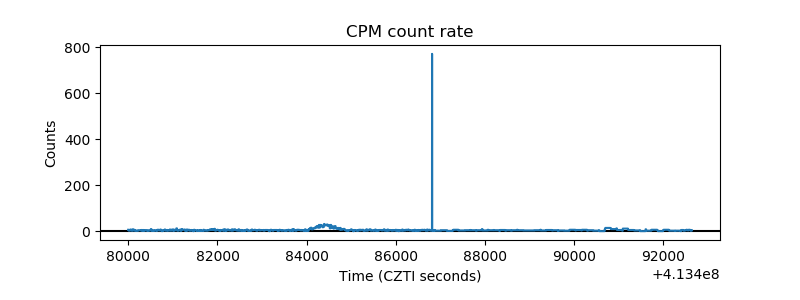 |
| CZT Counter | 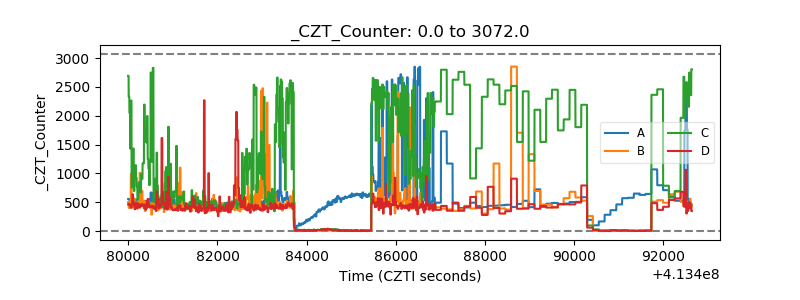 |
| +2.5 Volts monitor | 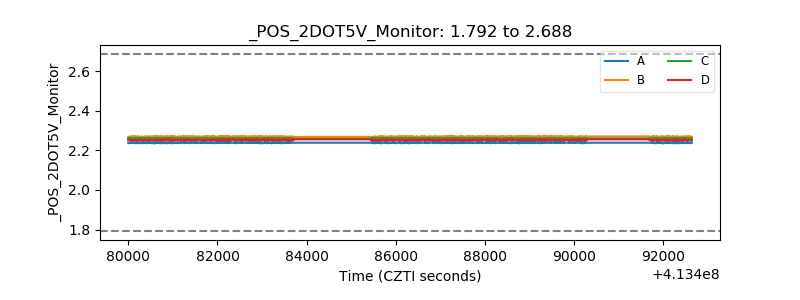 |
| +5 Volts monitor | 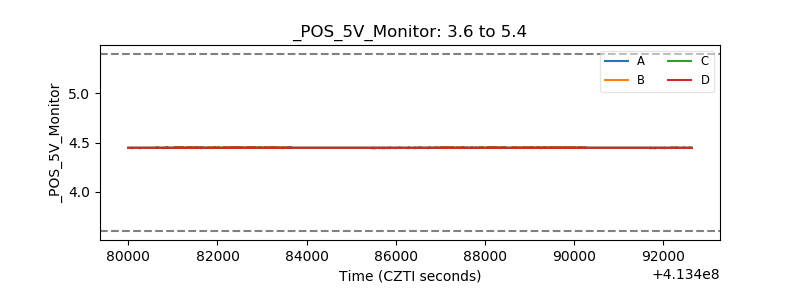 |
| _ROLL_ROT | 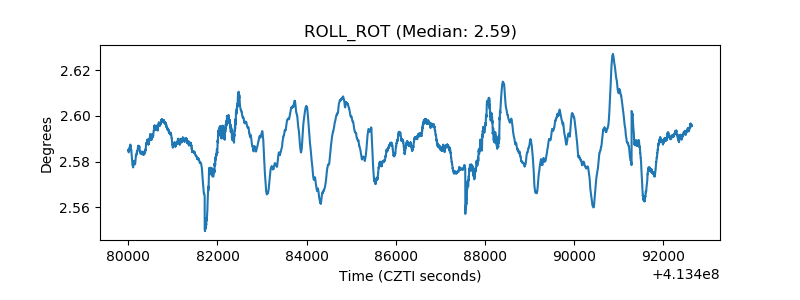 |
| _Roll_DEC | 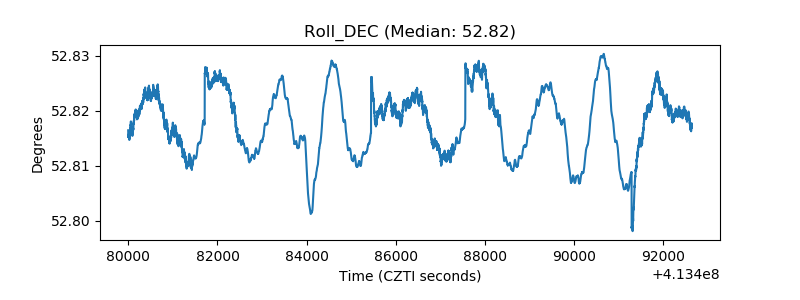 |
| _Roll_RA | 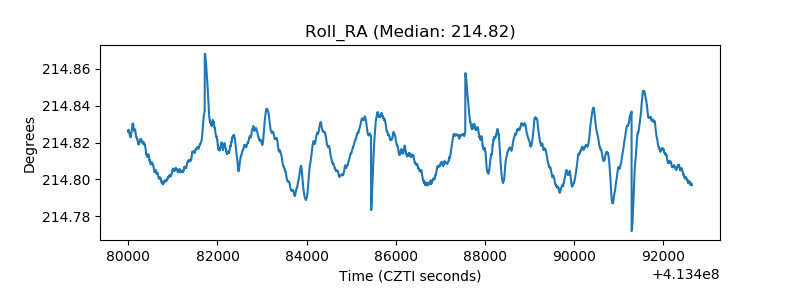 |
| Veto Counter | 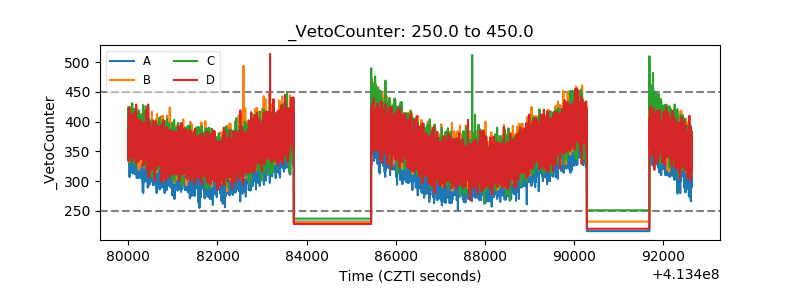 |