| Param | Original file | Final file |
|---|---|---|
| Filename | modeM0/AS1A12_022T01_9000005498_39814cztM0_level2.fits | modeM0/AS1A12_022T01_9000005498_39814cztM0_level2_quad_clean.evt |
| Size (bytes) | 636,007,680 | 80,023,680 |
| Size | 606.5 MB | 76.3 MB |
| Events in quadrant A | 3,173,486 | 649,713 |
| Events in quadrant B | 3,611,856 | 644,021 |
| Events in quadrant C | 13,371,247 | 137,793 |
| Events in quadrant D | 2,927,052 | 579,078 |
| Mode M0 | |||
|---|---|---|---|
| Quadrant | BADHDUFLAG | Total packets | Discarded packets |
| A | 0 | 13292 | 3 |
| B | 0 | 14861 | 2 |
| C | 0 | 43766 | 2 |
| D | 0 | 13117 | 2 |
| Mode M9 | |||
|---|---|---|---|
| Quadrant | BADHDUFLAG | Total packets | Discarded packets |
| A | 0 | 14 | 0 |
| B | 0 | 14 | 0 |
| C | 0 | 14 | 0 |
| D | 0 | 15 | 0 |
| Mode SS | |||
|---|---|---|---|
| Quadrant | BADHDUFLAG | Total packets | Discarded packets |
| A | 0 | 120 | 0 |
| B | 0 | 120 | 0 |
| C | 0 | 120 | 0 |
| D | 0 | 120 | 0 |
| Quadrant | Total seconds | Saturated seconds | Saturation percentage |
|---|---|---|---|
| A | 5900 | 37 | 0.627119% |
| B | 5900 | 198 | 3.355932% |
| C | 5900 | 4848 | 82.169492% |
| D | 5900 | 107 | 1.813559% |
Noise dominated data is calculated using 1-second bins in cleaned event files. If a bin has >2000 counts, and if more than 50% of those come from <1% of pixels, then it is considered to be noise-dominated and hence unusable.
| Quadrant | # 1 sec bins | Bins with >0 counts | Bins with >2000 counts | High rate bins dominated by noise | Noise dominated (total time) | Noise dominated (detector-on time) | Marked lightcurve |
|---|---|---|---|---|---|---|---|
| A | 7183 | 5901 | 29 | 29 | 0.40% | 0.49% | 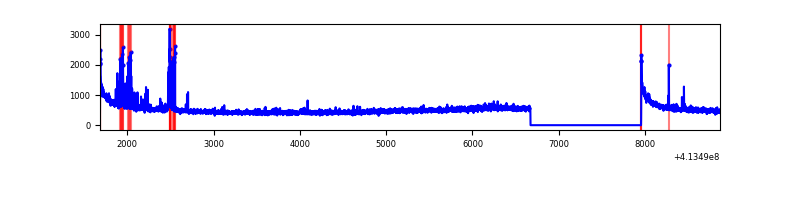 |
| B | 7183 | 5901 | 125 | 125 | 1.74% | 2.12% | 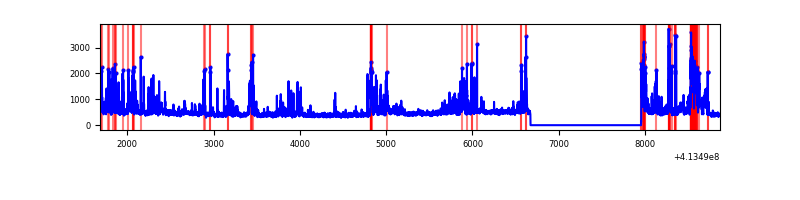 |
| C | 7183 | 5901 | 4231 | 4231 | 58.90% | 71.70% | 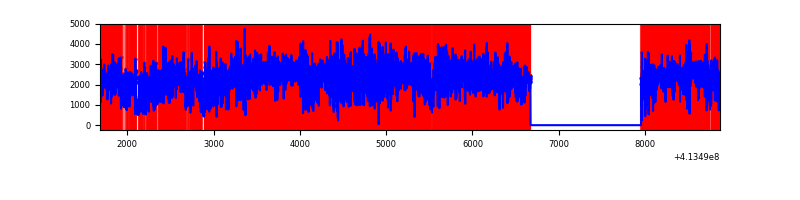 |
| D | 7183 | 5901 | 73 | 73 | 1.02% | 1.24% | 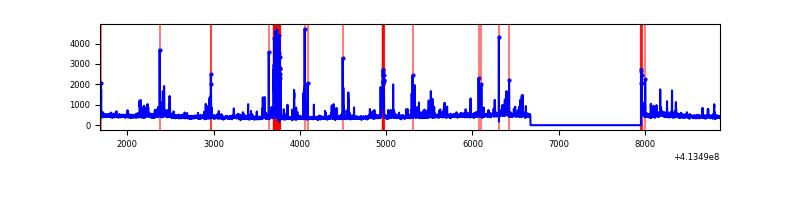 |
Top three noisy pixels from each quadrant. If the there are fewer than three noisy pixels in the level2.evt file, extra rows are filled as -1
| Pixel properties | Quadrant properties | ||||||
|---|---|---|---|---|---|---|---|
| Quadrant | DetID | PixID | Counts | Sigma | Mean | Median | Sigma |
| A | 10 | 83 | 493521 | 3790.61 | 638 | 624 | 130.0 |
| A | 13 | 248 | 174112 | 1334.2 | 638 | 624 | 130.0 |
| A | 13 | 6 | 9626 | 69.23 | 638 | 624 | 130.0 |
| B | 4 | 171 | 561582 | 4586.56 | 628 | 610 | 122.3 |
| B | 0 | 229 | 297815 | 2429.98 | 628 | 610 | 122.3 |
| B | 5 | 32 | 134145 | 1091.8 | 628 | 610 | 122.3 |
| C | 9 | 187 | 10935677 | 127101.73 | 364 | 365 | 86.0 |
| C | 15 | 208 | 801096 | 9306.94 | 364 | 365 | 86.0 |
| C | 15 | 214 | 149958 | 1738.73 | 364 | 365 | 86.0 |
| D | 13 | 249 | 230016 | 1500.53 | 618 | 600 | 152.9 |
| D | 2 | 249 | 148353 | 966.4 | 618 | 600 | 152.9 |
| D | 2 | 153 | 55091 | 356.41 | 618 | 600 | 152.9 |
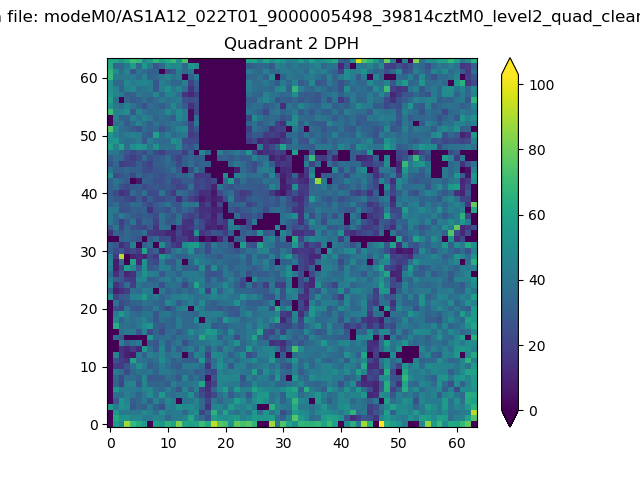
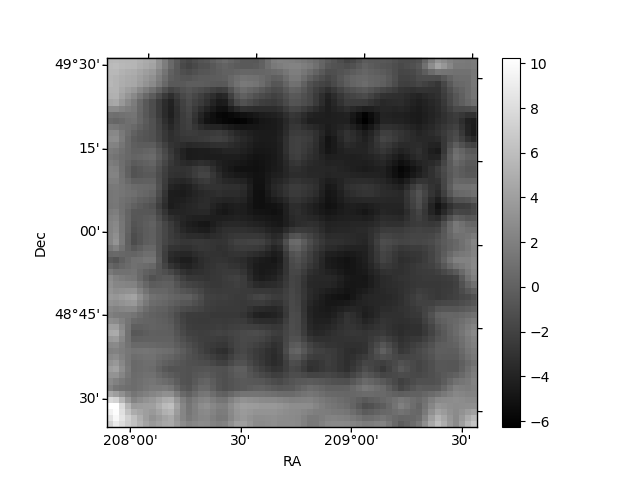
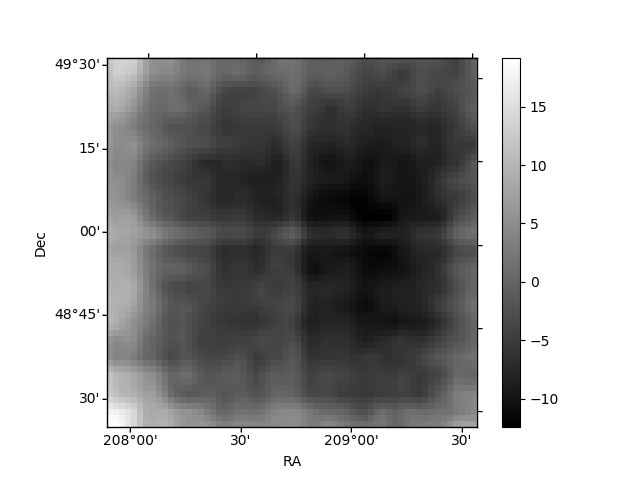
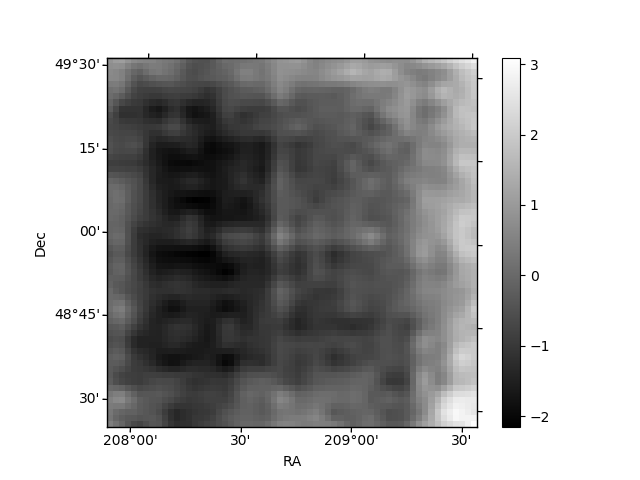
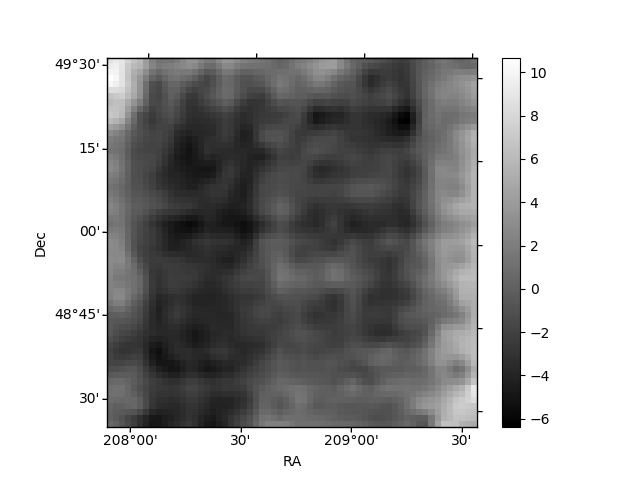
Histogram calculated using DETX and DETY for each event in the final _common_clean file
| Quadrant A | 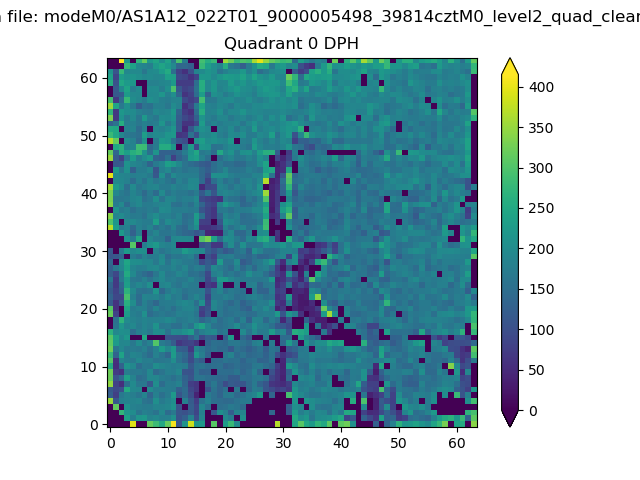 |
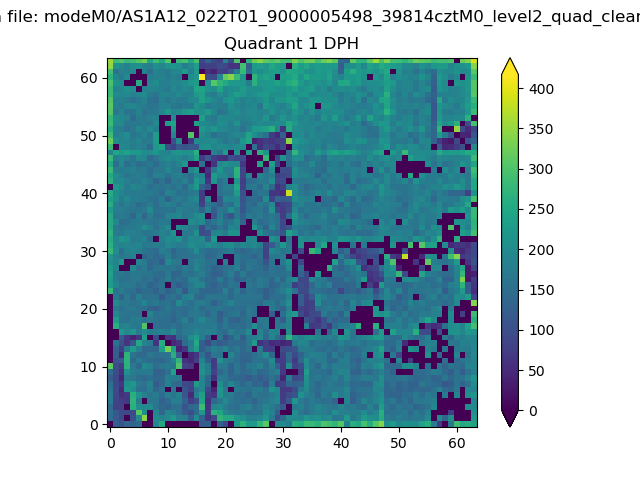 |
Quadrant B |
|---|---|---|---|
| Quadrant D | 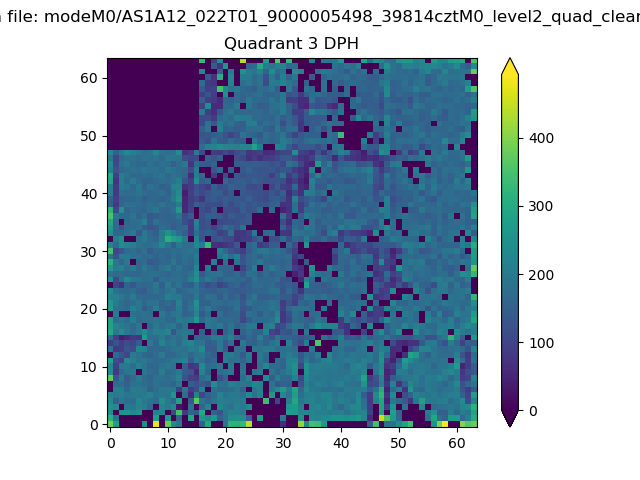 |
 |
Quadrant C |
| Plot type | Count rate plots | Images |
|---|---|---|
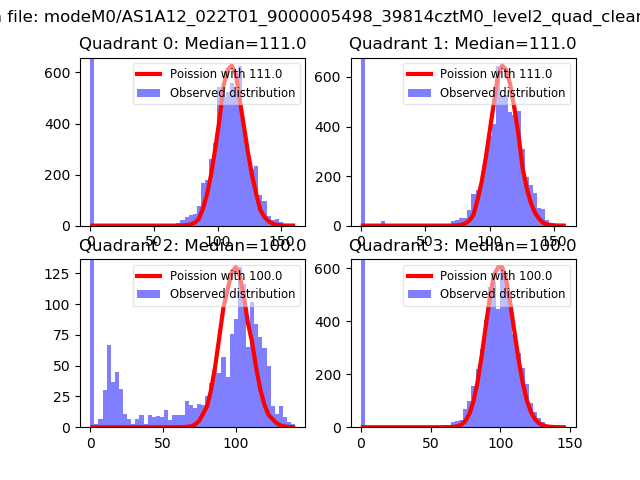
| Comparison with Poisson distribution Blue bars denote a histogram of data divided into 1 sec bins. Red curve is a Poisson curve with rate = median count rate of data. |
 |
 |
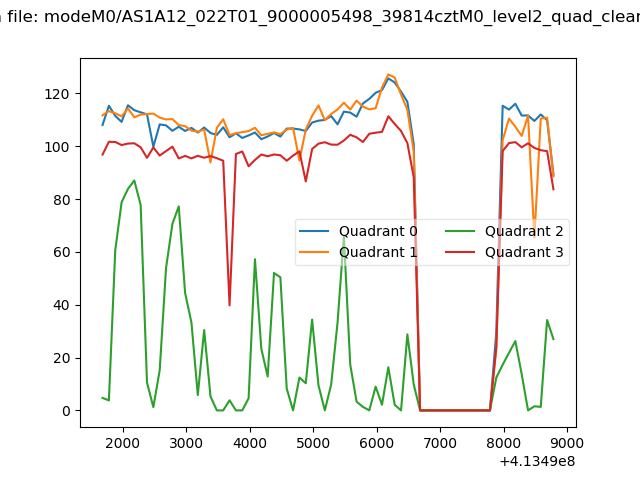
| Quadrant-wise count rates Data is divided into 100 sec bins |
 |
|
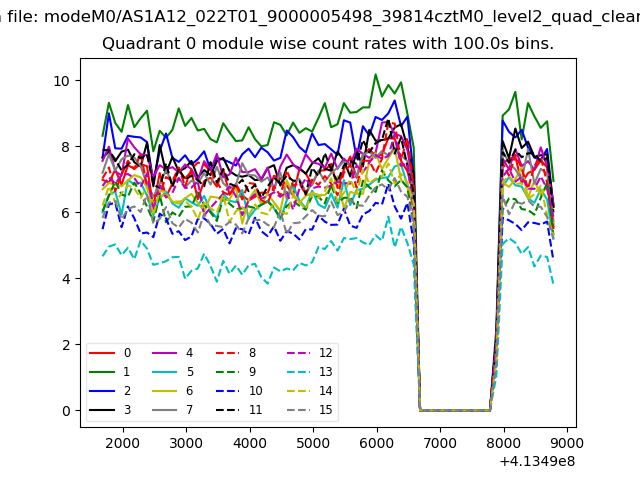
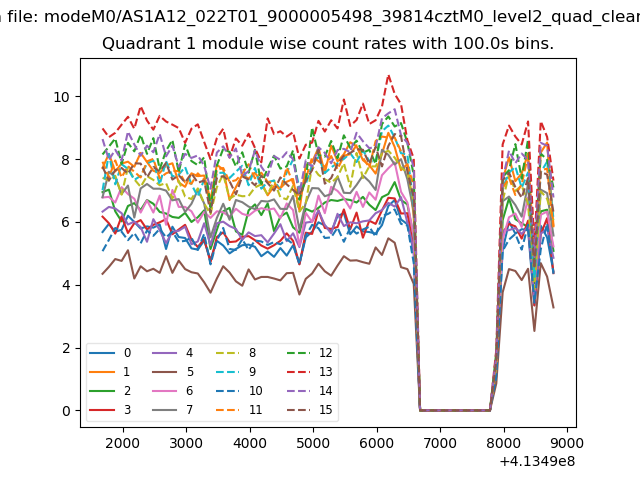
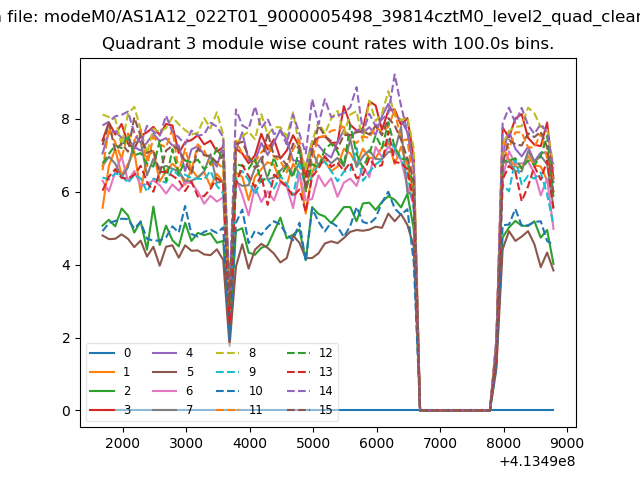
| Module-wise count rates for Quadrant A Data is divided into 100 sec bins |
 |
 |
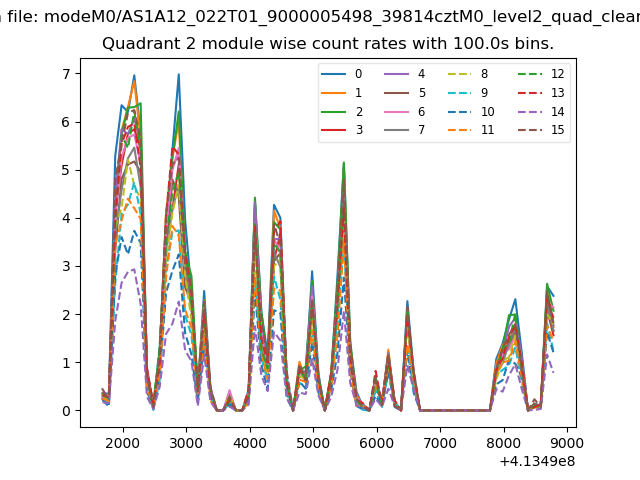
| Module-wise count rates for Quadrant B Data is divided into 100 sec bins |
 |
 |
| Module-wise count rates for Quadrant C Data is divided into 100 sec bins |
 |
 |
| Module-wise count rates for Quadrant D Data is divided into 100 sec bins |
 |
 |
| Parameter | Plot |
|---|---|
| CZT HV Monitor | 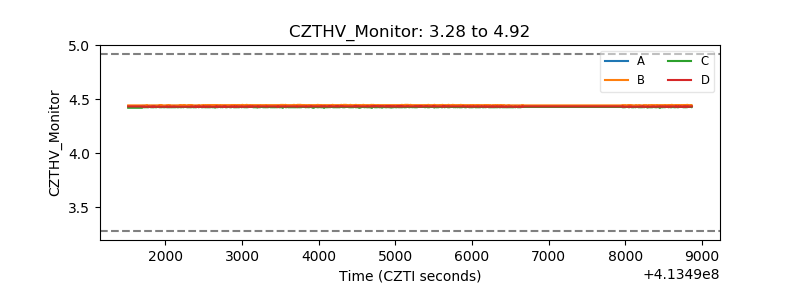 |
| D_VDD |  |
| Temperature 1 | 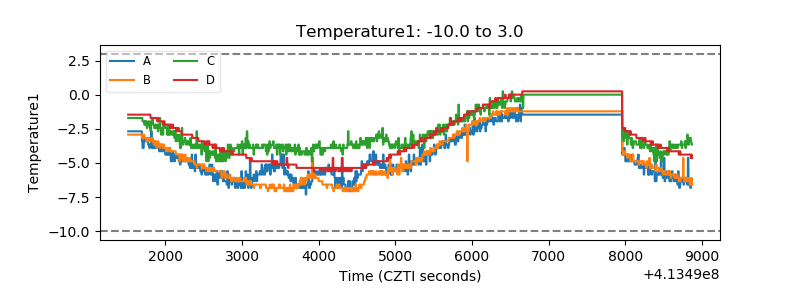 |
| Veto HV Monitor | 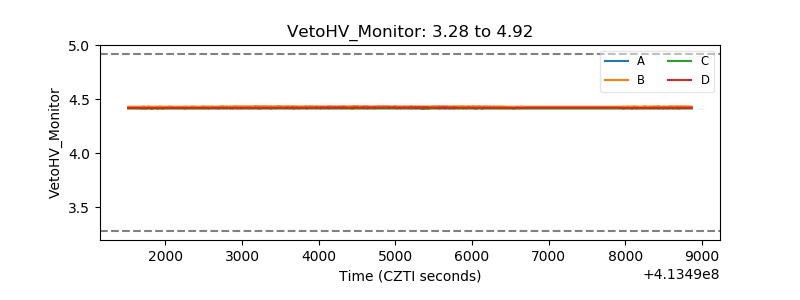 |
| Veto LLD | 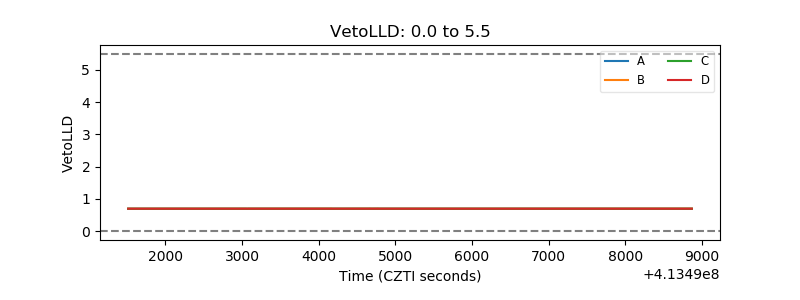 |
| Alpha Counter | 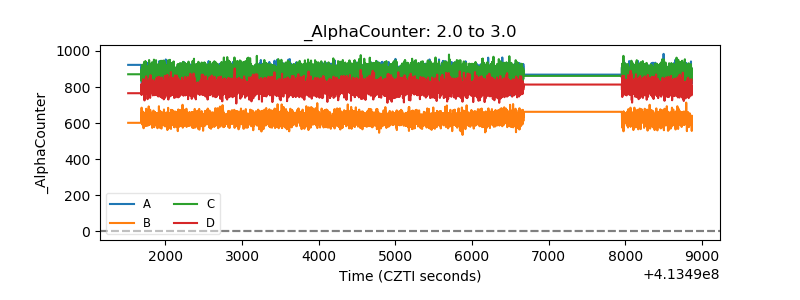 |
| _CPM_Rate | 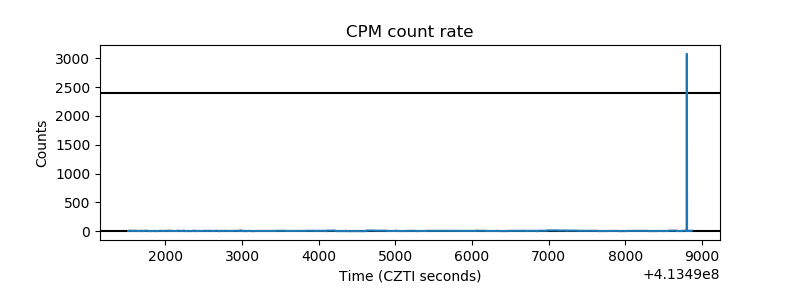 |
| CZT Counter | 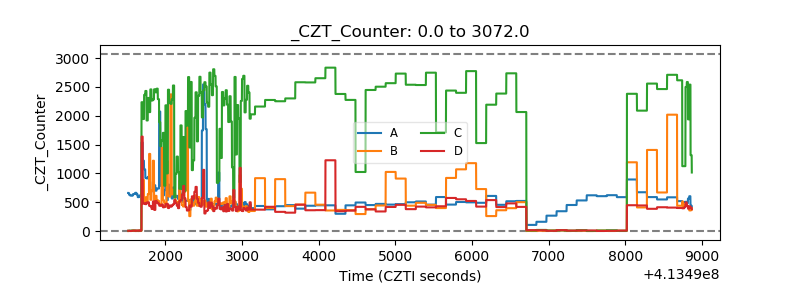 |
| +2.5 Volts monitor | 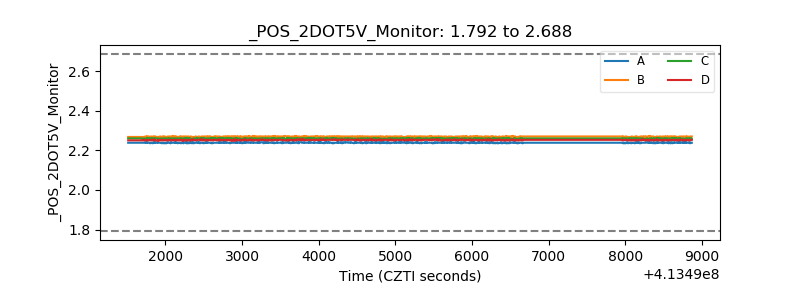 |
| +5 Volts monitor | 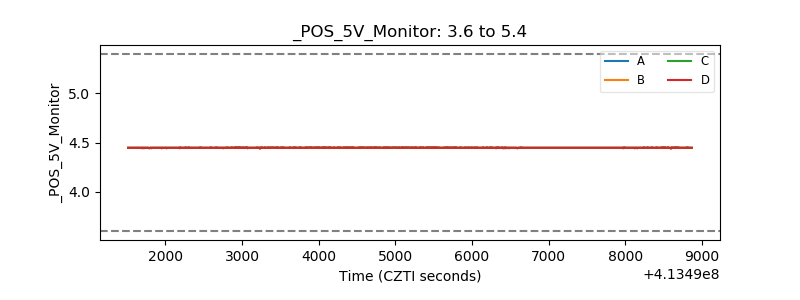 |
| _ROLL_ROT | 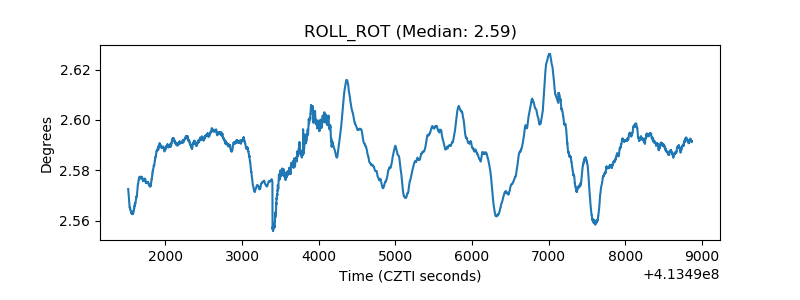 |
| _Roll_DEC | 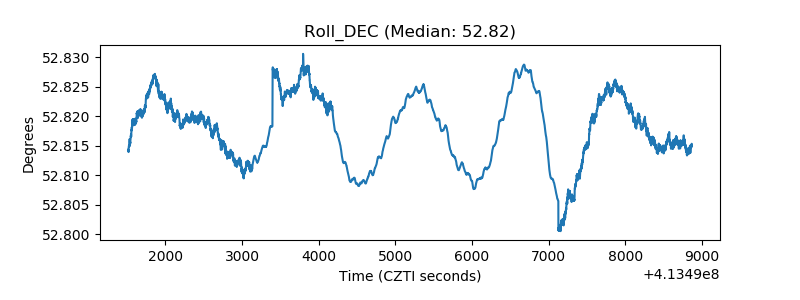 |
| _Roll_RA | 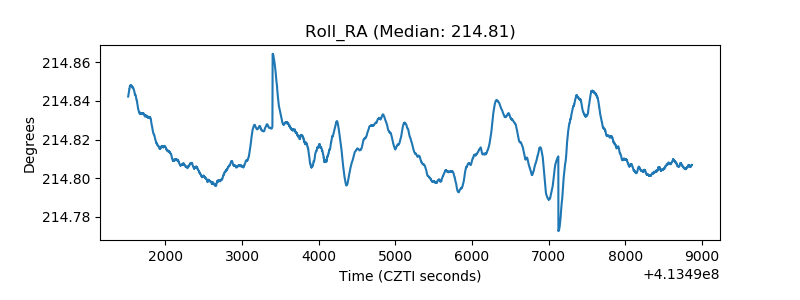 |
| Veto Counter | 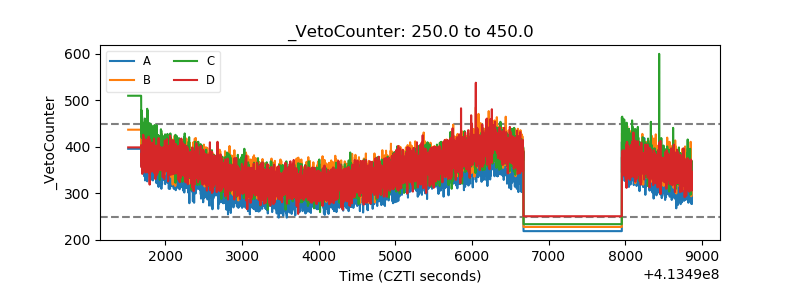 |