| Param | Original file | Final file |
|---|---|---|
| Filename | modeM0/AS1A12_022T01_9000005498_39817cztM0_level2.fits | modeM0/AS1A12_022T01_9000005498_39817cztM0_level2_quad_clean.evt |
| Size (bytes) | 227,908,800 | 34,485,120 |
| Size | 217.4 MB | 32.9 MB |
| Events in quadrant A | 1,646,712 | 283,042 |
| Events in quadrant B | 1,672,992 | 280,916 |
| Events in quadrant C | 3,281,068 | 16,089 |
| Events in quadrant D | 1,616,287 | 262,309 |
| Mode M0 | |||
|---|---|---|---|
| Quadrant | BADHDUFLAG | Total packets | Discarded packets |
| A | 0 | 25764 | 18707 |
| B | 0 | 27363 | 20094 |
| C | 0 | 84318 | 73652 |
| D | 0 | 24709 | 17300 |
| Mode M9 | |||
|---|---|---|---|
| Quadrant | BADHDUFLAG | Total packets | Discarded packets |
| A | 0 | 12 | 0 |
| B | 0 | 14 | 0 |
| C | 0 | 15 | 0 |
| D | 0 | 16 | 0 |
| Mode SS | |||
|---|---|---|---|
| Quadrant | BADHDUFLAG | Total packets | Discarded packets |
| A | 0 | 76 | 0 |
| B | 0 | 74 | 0 |
| C | 0 | 70 | 0 |
| D | 0 | 70 | 0 |
| Quadrant | Total seconds | Saturated seconds | Saturation percentage |
|---|---|---|---|
| A | 3231 | 9 | 0.278552% |
| B | 3165 | 49 | 1.548183% |
| C | 1364 | 1173 | 85.997067% |
| D | 3319 | 32 | 0.964146% |
Noise dominated data is calculated using 1-second bins in cleaned event files. If a bin has >2000 counts, and if more than 50% of those come from <1% of pixels, then it is considered to be noise-dominated and hence unusable.
| Quadrant | # 1 sec bins | Bins with >0 counts | Bins with >2000 counts | High rate bins dominated by noise | Noise dominated (total time) | Noise dominated (detector-on time) | Marked lightcurve |
|---|---|---|---|---|---|---|---|
| A | 13403 | 4352 | 5 | 5 | 0.04% | 0.11% | 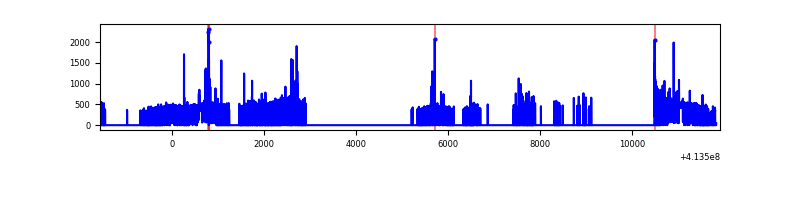 |
| B | 13455 | 4256 | 19 | 19 | 0.14% | 0.45% | 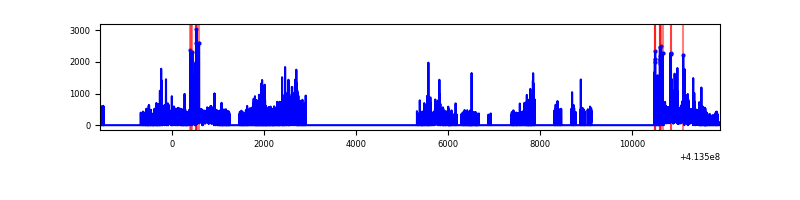 |
| C | 11792 | 1960 | 712 | 712 | 6.04% | 36.33% | 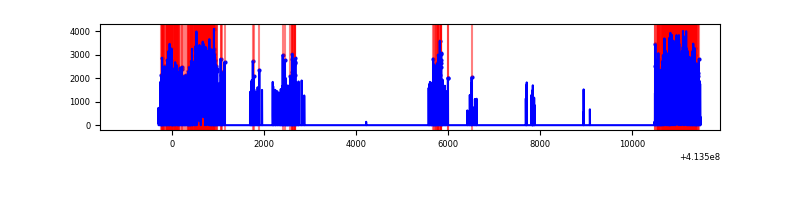 |
| D | 13430 | 4477 | 29 | 29 | 0.22% | 0.65% | 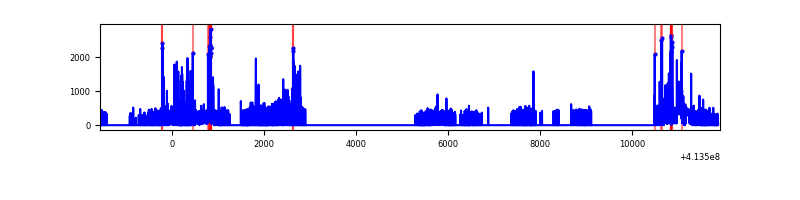 |
Top three noisy pixels from each quadrant. If the there are fewer than three noisy pixels in the level2.evt file, extra rows are filled as -1
| Pixel properties | Quadrant properties | ||||||
|---|---|---|---|---|---|---|---|
| Quadrant | DetID | PixID | Counts | Sigma | Mean | Median | Sigma |
| A | 10 | 83 | 233164 | 3321.5 | 336 | 328 | 70.1 |
| A | 14 | 235 | 40409 | 571.77 | 336 | 328 | 70.1 |
| A | 9 | 143 | 29450 | 415.44 | 336 | 328 | 70.1 |
| B | 4 | 171 | 197016 | 3048.43 | 326 | 318 | 64.5 |
| B | 5 | 255 | 43637 | 671.36 | 326 | 318 | 64.5 |
| B | 5 | 172 | 33271 | 510.71 | 326 | 318 | 64.5 |
| C | 9 | 187 | 2775322 | 160716.22 | 66 | 66 | 17.3 |
| C | 15 | 208 | 212279 | 12289.34 | 66 | 66 | 17.3 |
| C | 15 | 214 | 28579 | 1651.2 | 66 | 66 | 17.3 |
| D | 2 | 249 | 179737 | 2161.05 | 335 | 325 | 83.0 |
| D | 13 | 249 | 67814 | 812.92 | 335 | 325 | 83.0 |
| D | 12 | 0 | 52213 | 625.0 | 335 | 325 | 83.0 |
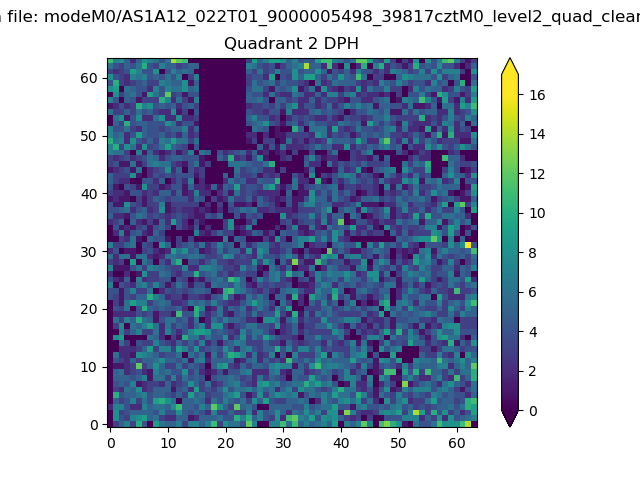
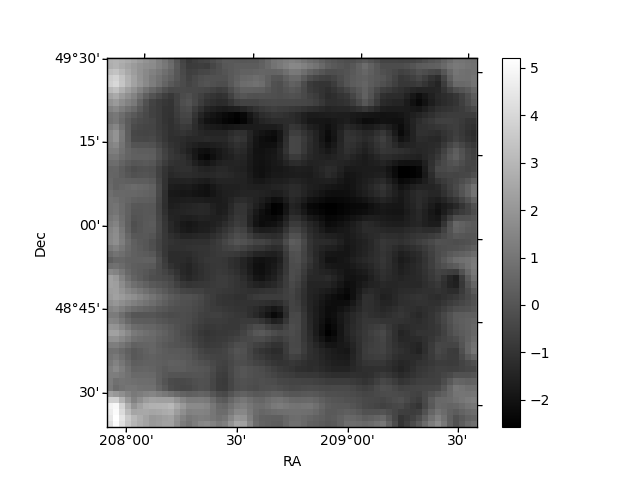
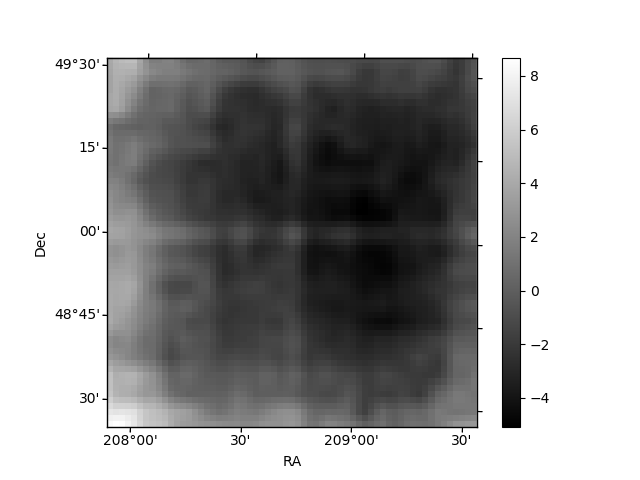
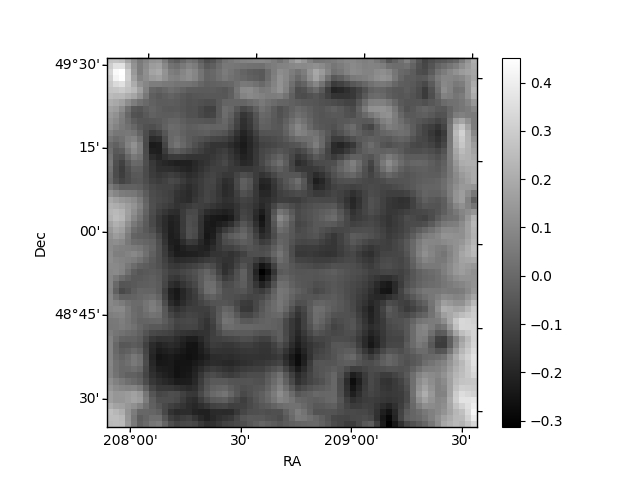
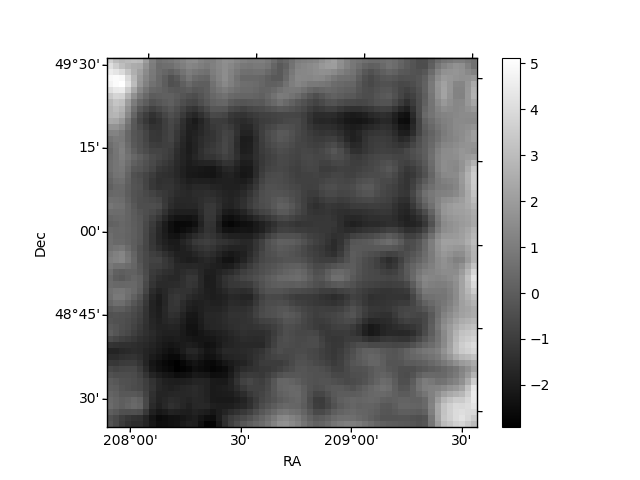
Histogram calculated using DETX and DETY for each event in the final _common_clean file
| Quadrant A | 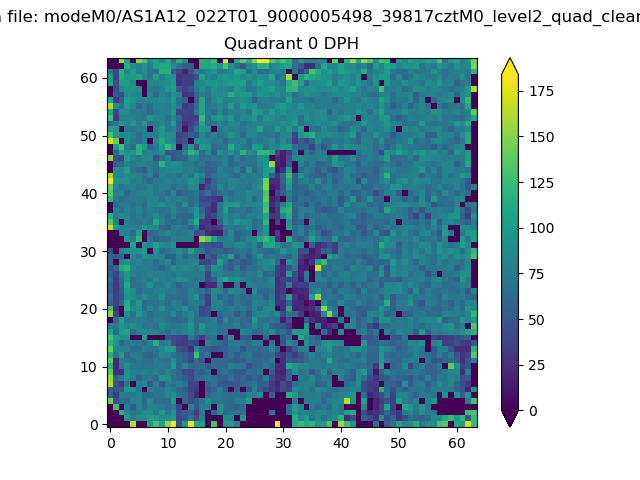 |
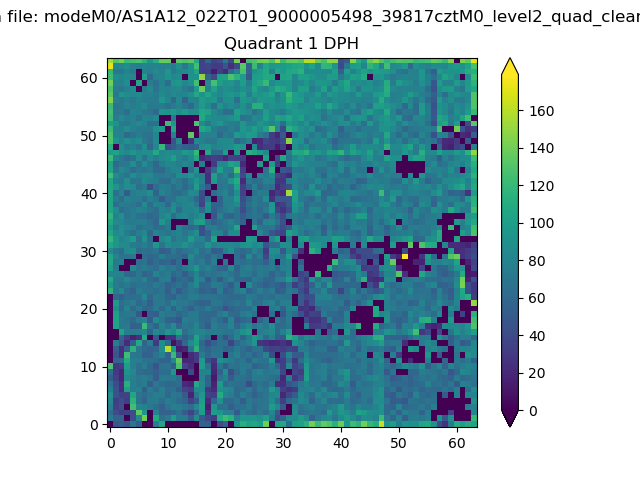 |
Quadrant B |
|---|---|---|---|
| Quadrant D | 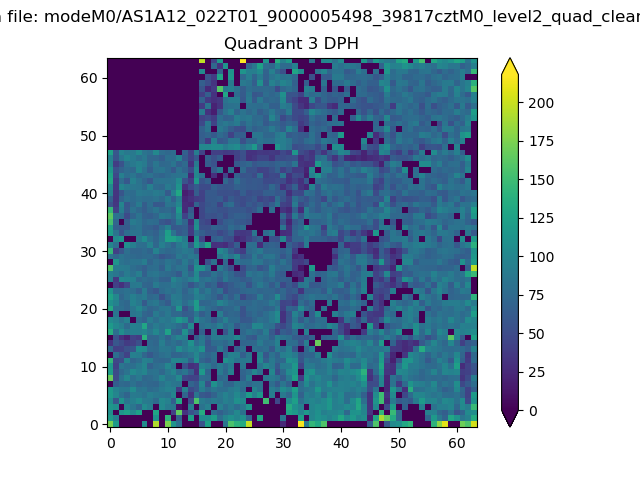 |
 |
Quadrant C |
| Plot type | Count rate plots | Images |
|---|---|---|
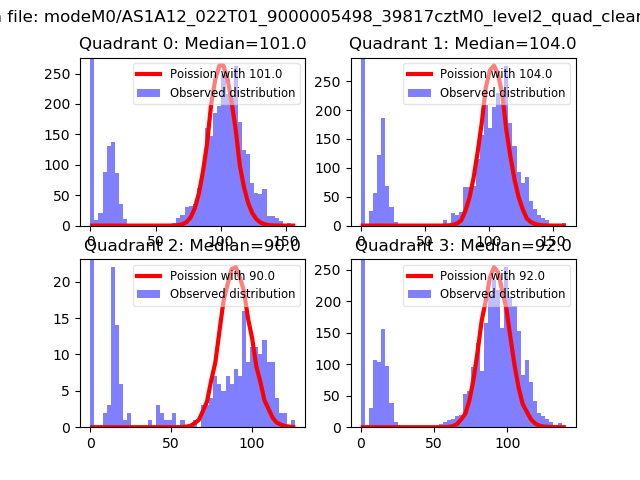
| Comparison with Poisson distribution Blue bars denote a histogram of data divided into 1 sec bins. Red curve is a Poisson curve with rate = median count rate of data. |
 |
 |
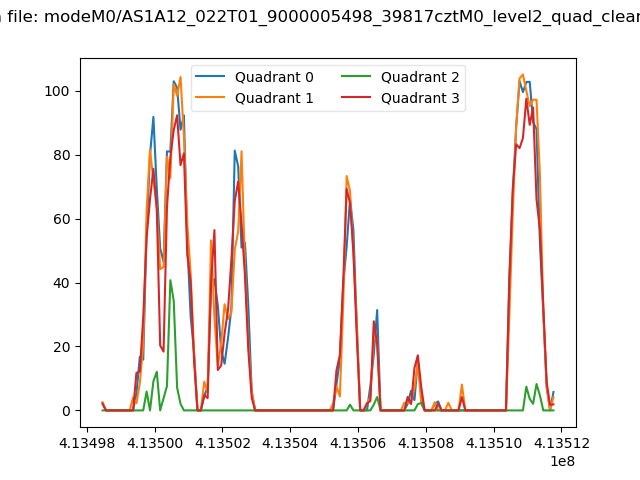
| Quadrant-wise count rates Data is divided into 100 sec bins |
 |
|
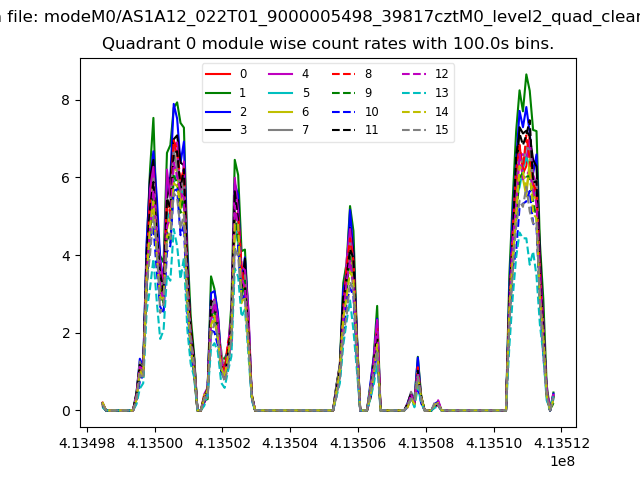
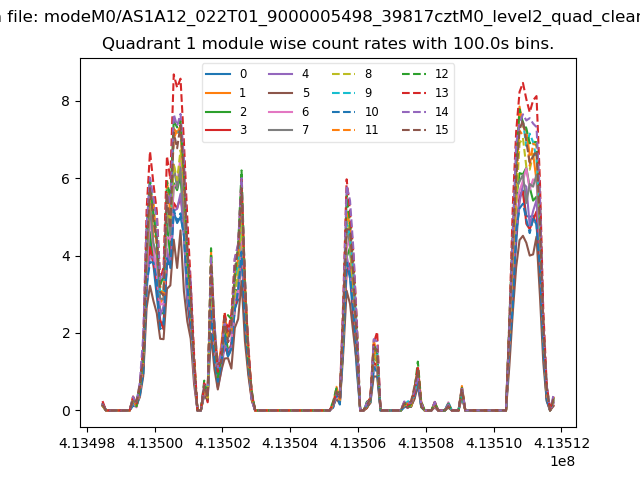
| Module-wise count rates for Quadrant A Data is divided into 100 sec bins |
 |
 |
| Module-wise count rates for Quadrant B Data is divided into 100 sec bins |
 |
 |
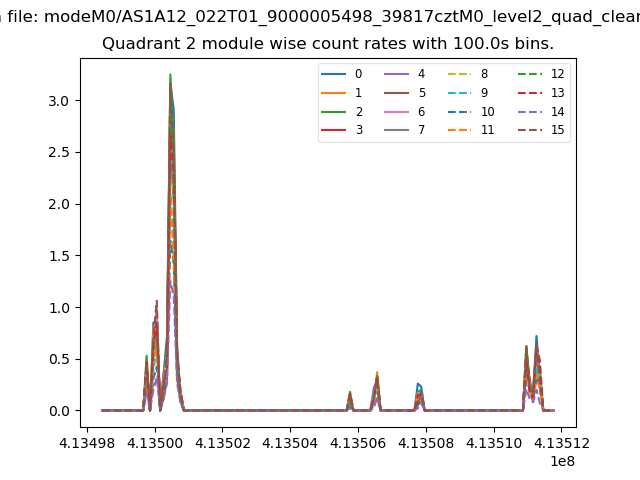
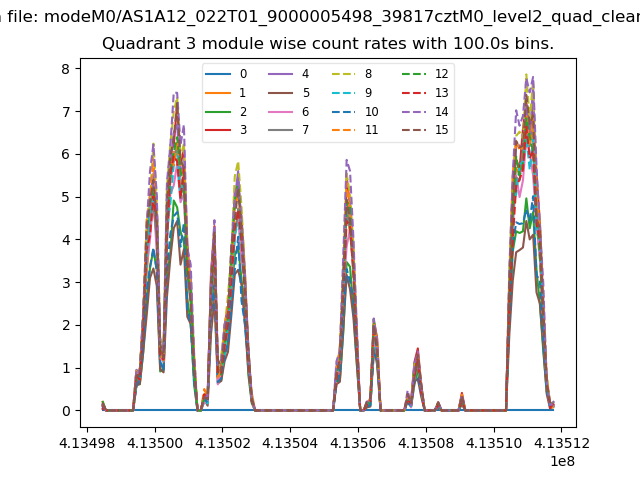
| Module-wise count rates for Quadrant C Data is divided into 100 sec bins |
 |
 |
| Module-wise count rates for Quadrant D Data is divided into 100 sec bins |
 |
 |
| Parameter | Plot |
|---|---|
| CZT HV Monitor | 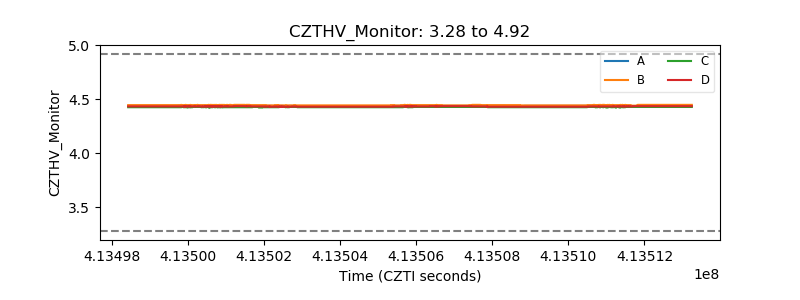 |
| D_VDD | 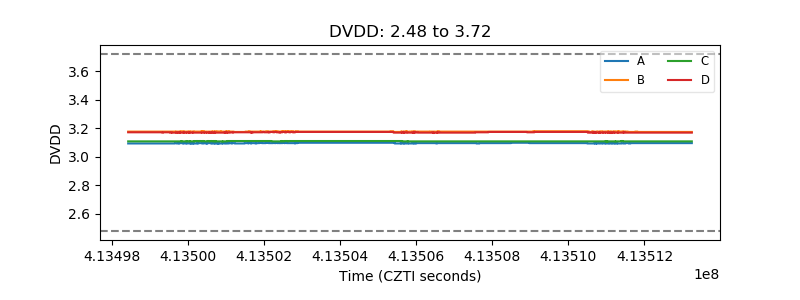 |
| Temperature 1 | 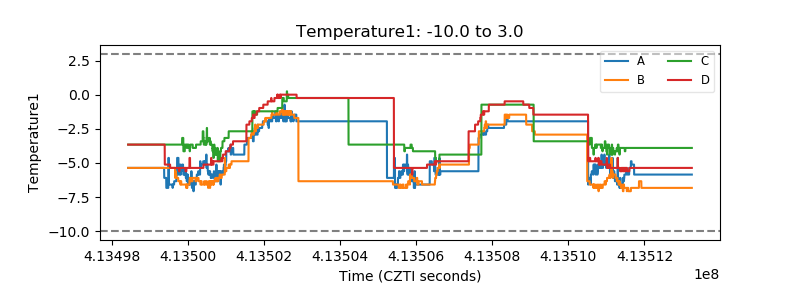 |
| Veto HV Monitor | 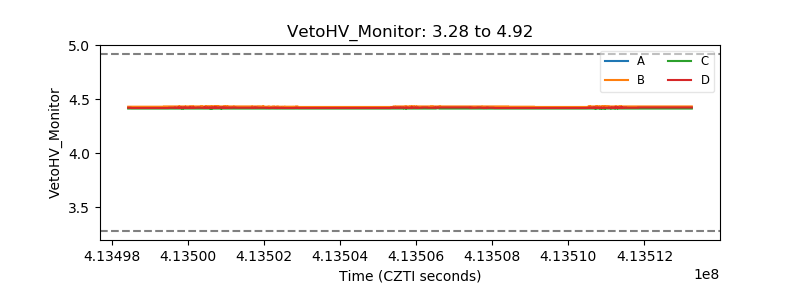 |
| Veto LLD | 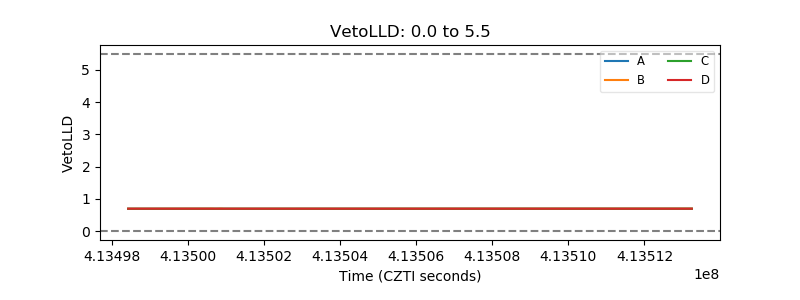 |
| Alpha Counter | 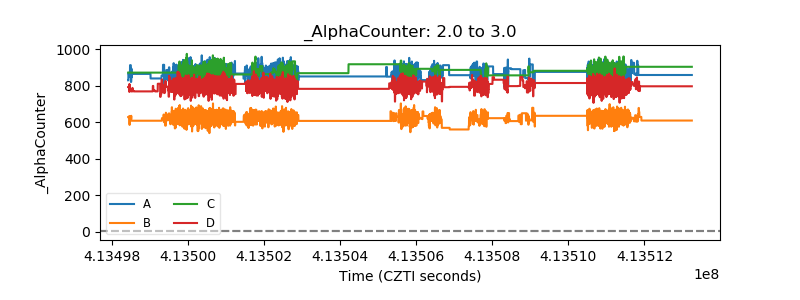 |
| _CPM_Rate | 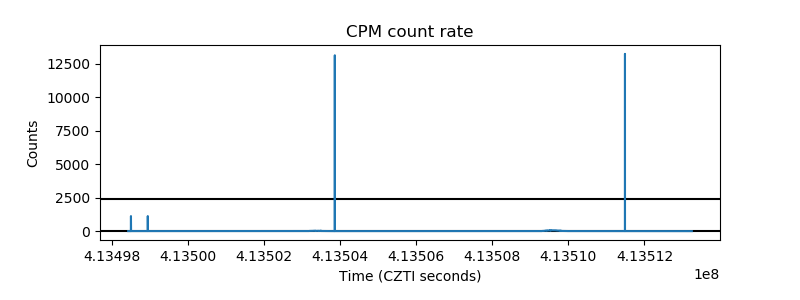 |
| CZT Counter | 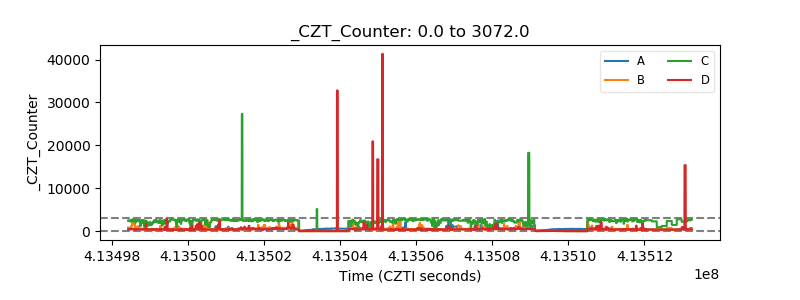 |
| +2.5 Volts monitor | 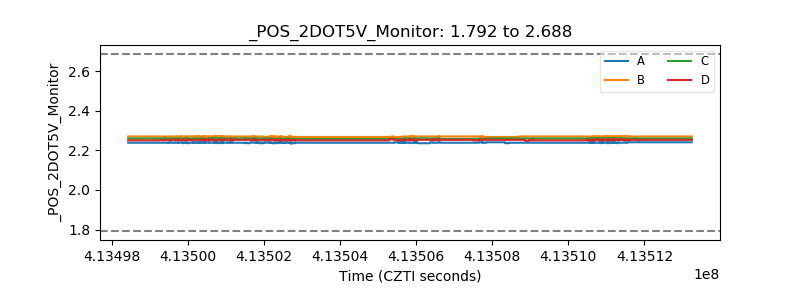 |
| +5 Volts monitor |  |
| _ROLL_ROT | 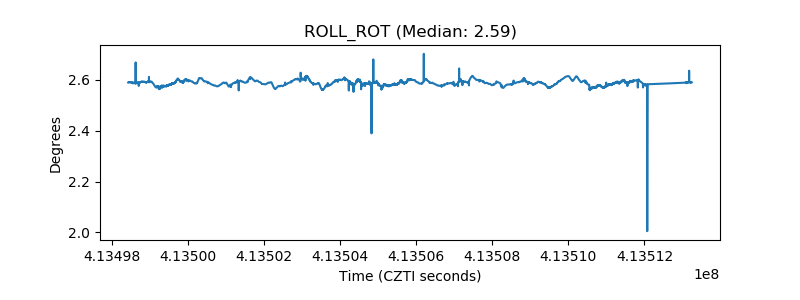 |
| _Roll_DEC | 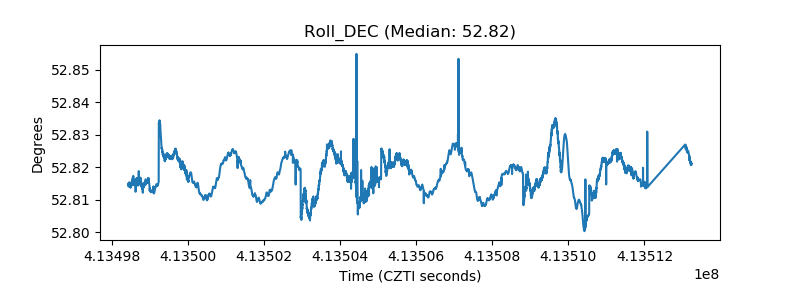 |
| _Roll_RA | 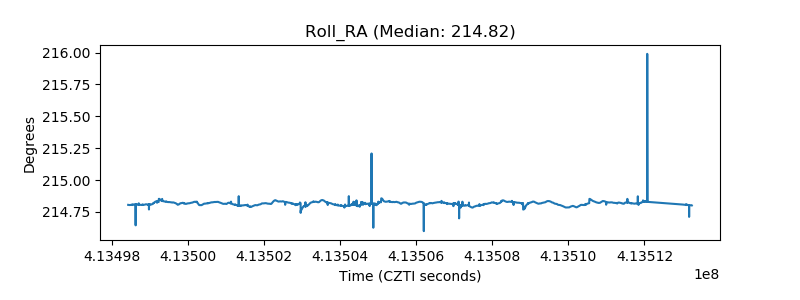 |
| Veto Counter | 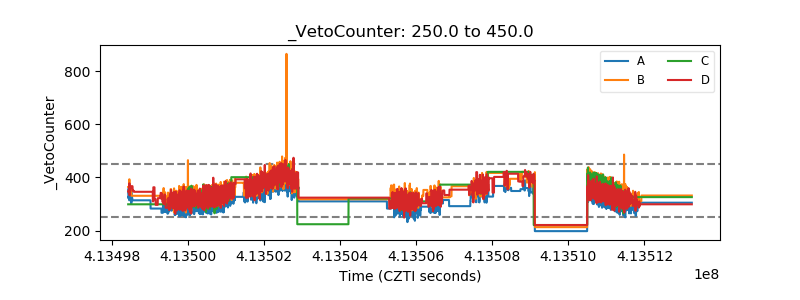 |