| Param | Original file | Final file |
|---|---|---|
| Filename | modeM0/AS1A12_022T01_9000005498_39821cztM0_level2.fits | modeM0/AS1A12_022T01_9000005498_39821cztM0_level2_quad_clean.evt |
| Size (bytes) | 2,160,815,040 | 258,871,680 |
| Size | 2.0 GB | 246.9 MB |
| Events in quadrant A | 10,797,718 | 2,097,465 |
| Events in quadrant B | 11,775,817 | 2,105,801 |
| Events in quadrant C | 43,494,467 | 499,439 |
| Events in quadrant D | 12,416,262 | 1,795,552 |
| Mode M0 | |||
|---|---|---|---|
| Quadrant | BADHDUFLAG | Total packets | Discarded packets |
| A | 0 | 44126 | 6 |
| B | 0 | 48092 | 5 |
| C | 0 | 142601 | 5 |
| D | 0 | 51329 | 5 |
| Mode M9 | |||
|---|---|---|---|
| Quadrant | BADHDUFLAG | Total packets | Discarded packets |
| A | 0 | 80 | 0 |
| B | 0 | 80 | 0 |
| C | 0 | 80 | 0 |
| D | 0 | 80 | 0 |
| Mode SS | |||
|---|---|---|---|
| Quadrant | BADHDUFLAG | Total packets | Discarded packets |
| A | 0 | 402 | 0 |
| B | 0 | 402 | 0 |
| C | 0 | 402 | 0 |
| D | 0 | 402 | 0 |
| Quadrant | Total seconds | Saturated seconds | Saturation percentage |
|---|---|---|---|
| A | 19421 | 167 | 0.859894% |
| B | 19421 | 570 | 2.934967% |
| C | 19421 | 15584 | 80.243036% |
| D | 19421 | 999 | 5.143916% |
Noise dominated data is calculated using 1-second bins in cleaned event files. If a bin has >2000 counts, and if more than 50% of those come from <1% of pixels, then it is considered to be noise-dominated and hence unusable.
| Quadrant | # 1 sec bins | Bins with >0 counts | Bins with >2000 counts | High rate bins dominated by noise | Noise dominated (total time) | Noise dominated (detector-on time) | Marked lightcurve |
|---|---|---|---|---|---|---|---|
| A | 27544 | 19426 | 135 | 135 | 0.49% | 0.69% | 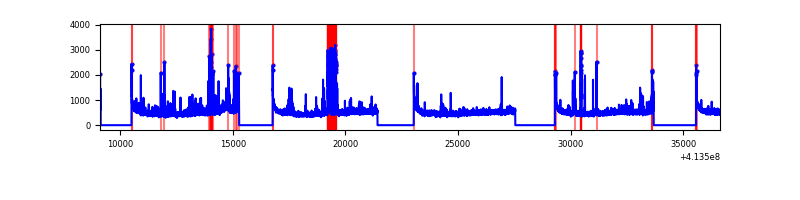 |
| B | 27544 | 19426 | 381 | 381 | 1.38% | 1.96% | 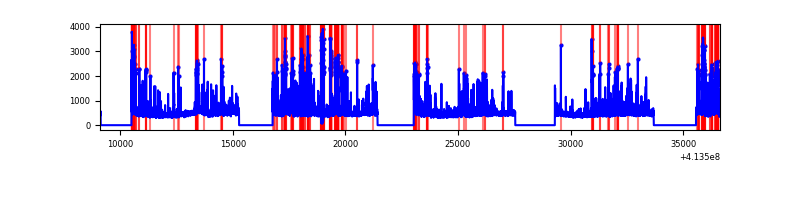 |
| C | 27544 | 19423 | 13434 | 13434 | 48.77% | 69.17% | 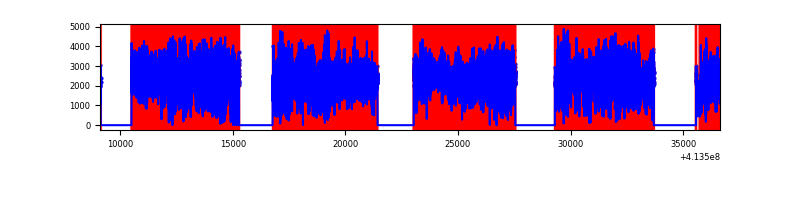 |
| D | 27544 | 19426 | 882 | 882 | 3.20% | 4.54% | 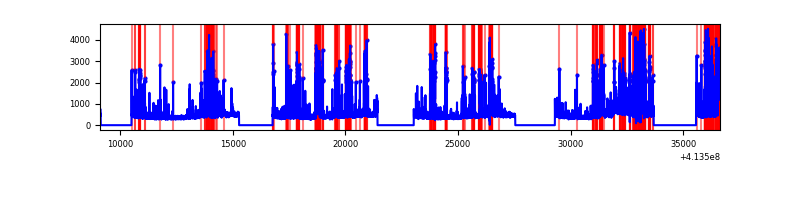 |
Top three noisy pixels from each quadrant. If the there are fewer than three noisy pixels in the level2.evt file, extra rows are filled as -1
| Pixel properties | Quadrant properties | ||||||
|---|---|---|---|---|---|---|---|
| Quadrant | DetID | PixID | Counts | Sigma | Mean | Median | Sigma |
| A | 10 | 83 | 1457500 | 3419.09 | 2113 | 2071 | 425.7 |
| A | 9 | 143 | 428382 | 1001.49 | 2113 | 2071 | 425.7 |
| A | 14 | 235 | 417579 | 976.11 | 2113 | 2071 | 425.7 |
| B | 4 | 171 | 2618124 | 6644.59 | 2070 | 2009 | 393.7 |
| B | 5 | 255 | 287536 | 725.2 | 2070 | 2009 | 393.7 |
| B | 5 | 172 | 239929 | 604.28 | 2070 | 2009 | 393.7 |
| C | 9 | 187 | 33600917 | 127819.2 | 1145 | 1150 | 262.9 |
| C | 15 | 208 | 4889058 | 18594.43 | 1145 | 1150 | 262.9 |
| C | 15 | 214 | 474664 | 1801.33 | 1145 | 1150 | 262.9 |
| D | 2 | 249 | 1865361 | 3838.37 | 2008 | 1947 | 485.5 |
| D | 12 | 227 | 1606891 | 3305.96 | 2008 | 1947 | 485.5 |
| D | 13 | 249 | 491964 | 1009.36 | 2008 | 1947 | 485.5 |
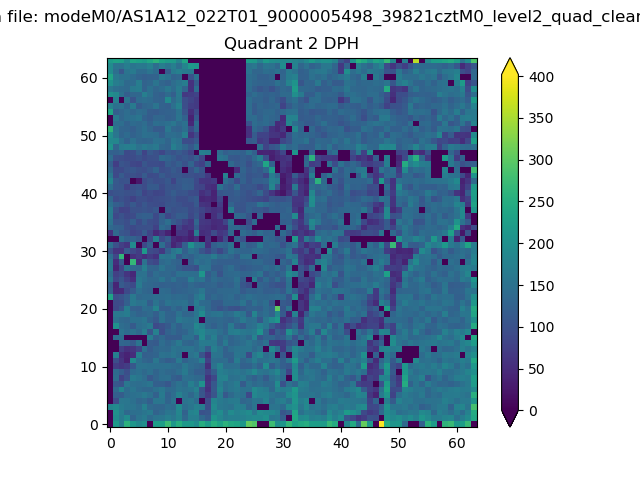
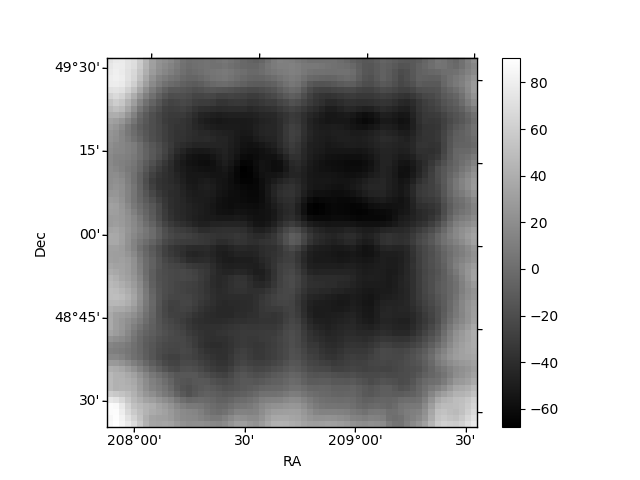
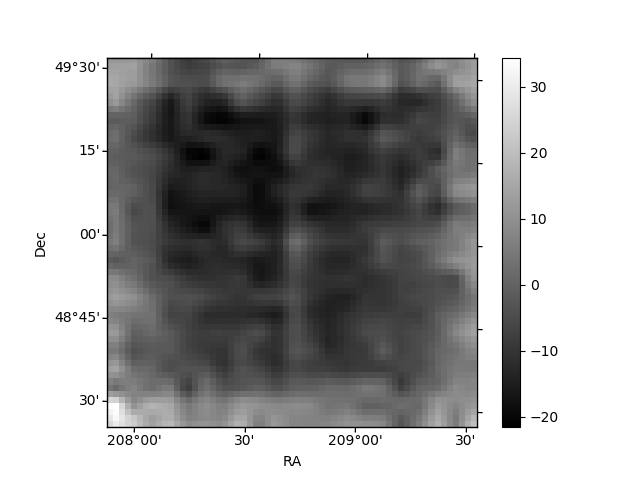
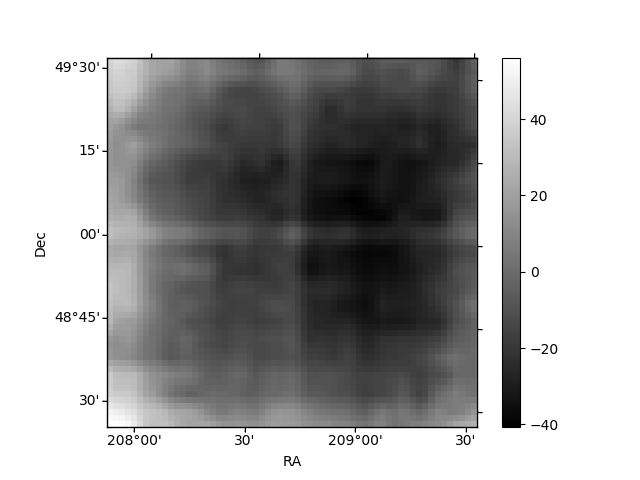
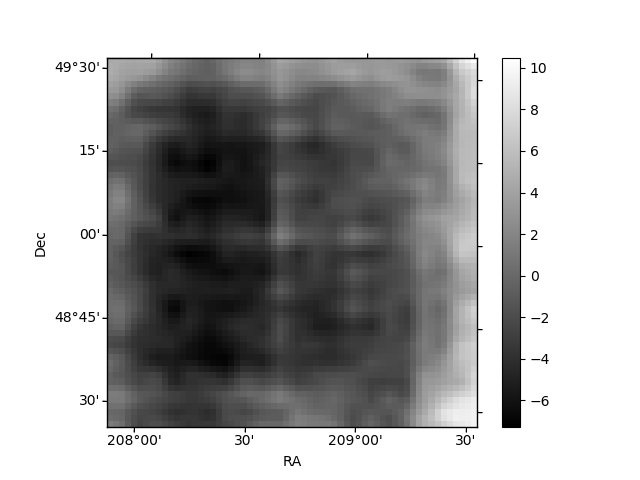
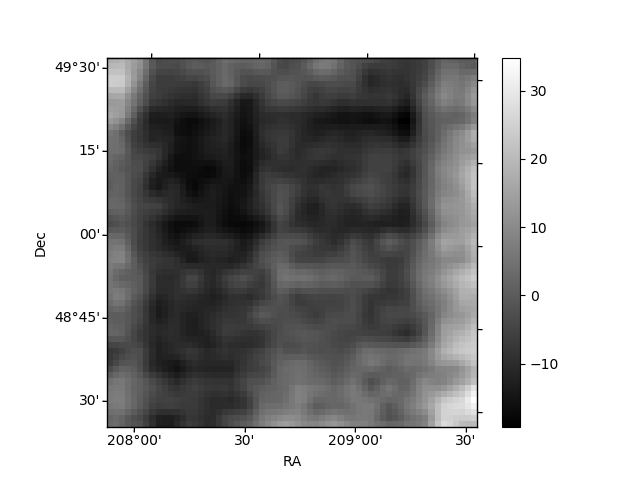
Histogram calculated using DETX and DETY for each event in the final _common_clean file
| Quadrant A | 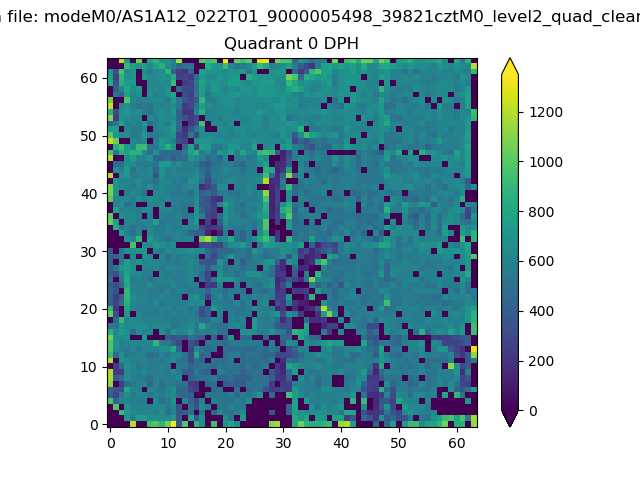 |
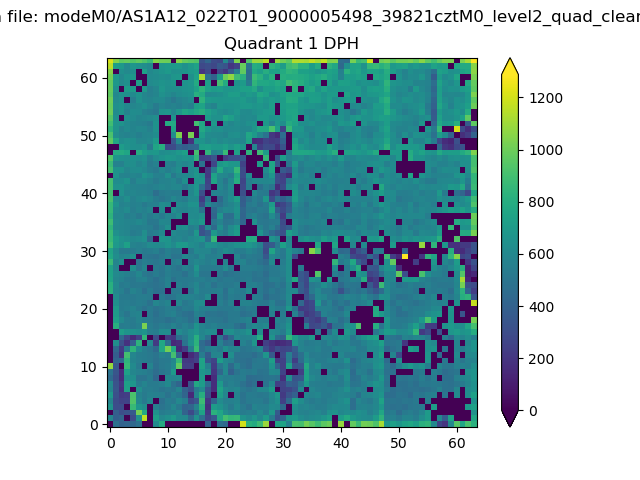 |
Quadrant B |
|---|---|---|---|
| Quadrant D | 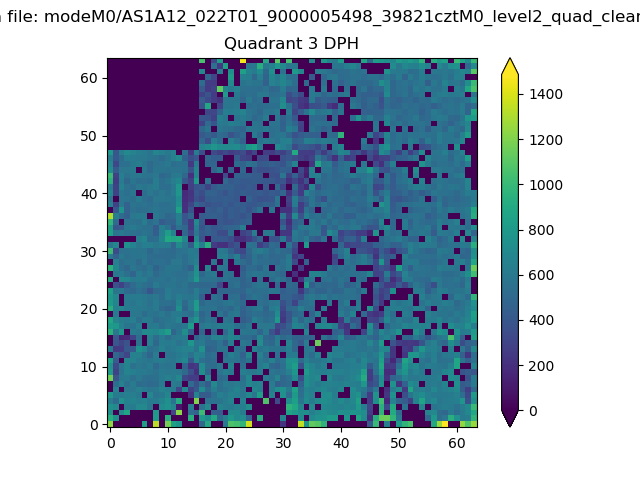 |
 |
Quadrant C |
| Plot type | Count rate plots | Images |
|---|---|---|
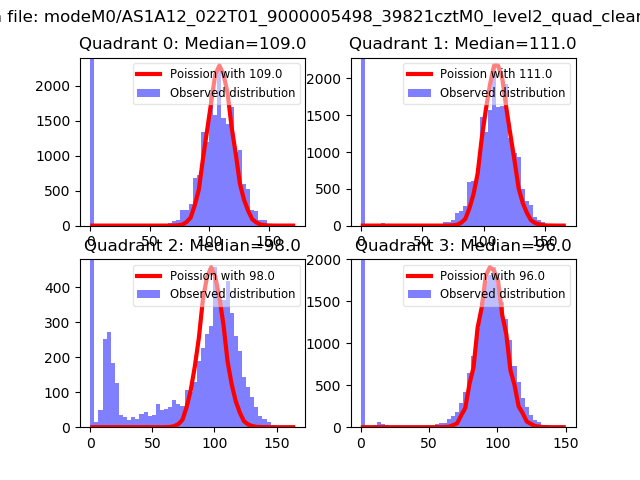
| Comparison with Poisson distribution Blue bars denote a histogram of data divided into 1 sec bins. Red curve is a Poisson curve with rate = median count rate of data. |
 |
 |
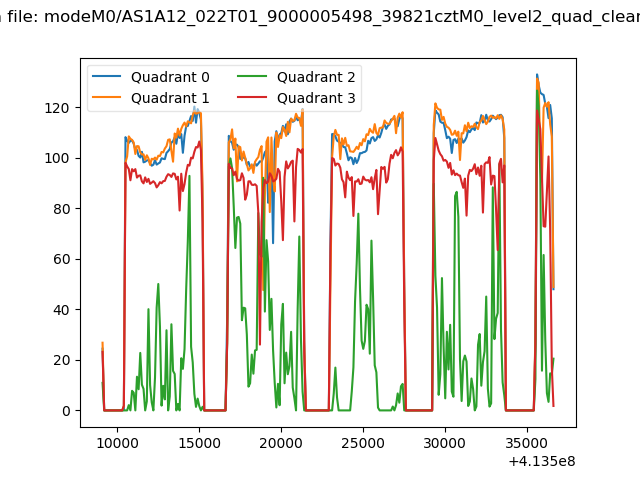
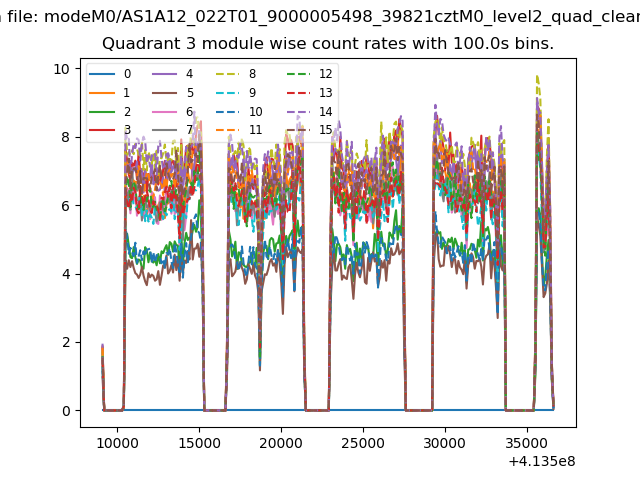
| Quadrant-wise count rates Data is divided into 100 sec bins |
 |
|
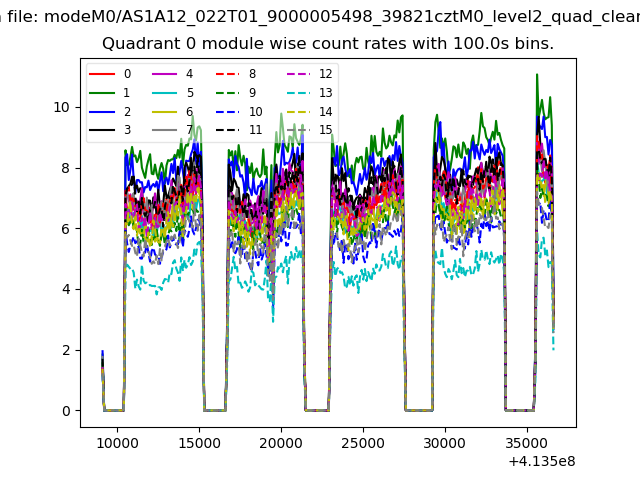
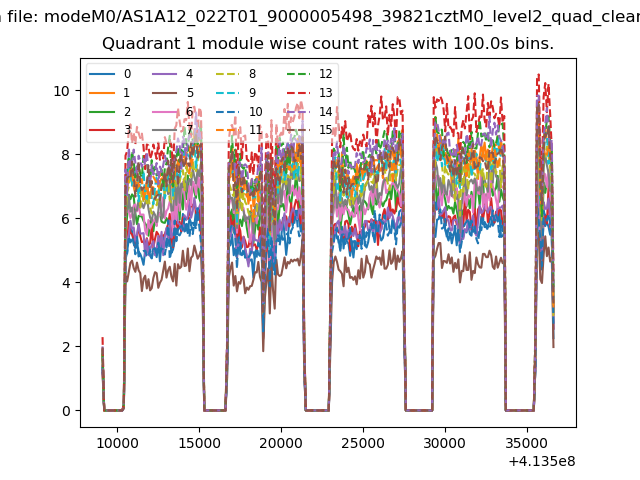
| Module-wise count rates for Quadrant A Data is divided into 100 sec bins |
 |
 |
| Module-wise count rates for Quadrant B Data is divided into 100 sec bins |
 |
 |
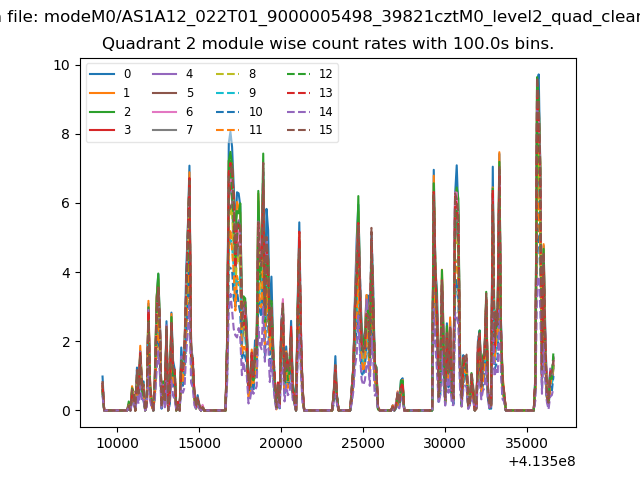
| Module-wise count rates for Quadrant C Data is divided into 100 sec bins |
 |
 |
| Module-wise count rates for Quadrant D Data is divided into 100 sec bins |
 |
 |
| Parameter | Plot |
|---|---|
| CZT HV Monitor | 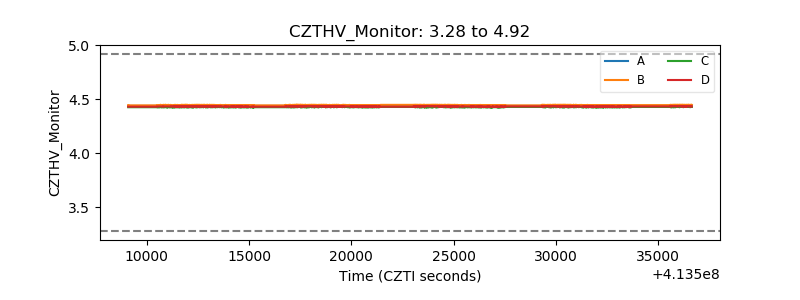 |
| D_VDD | 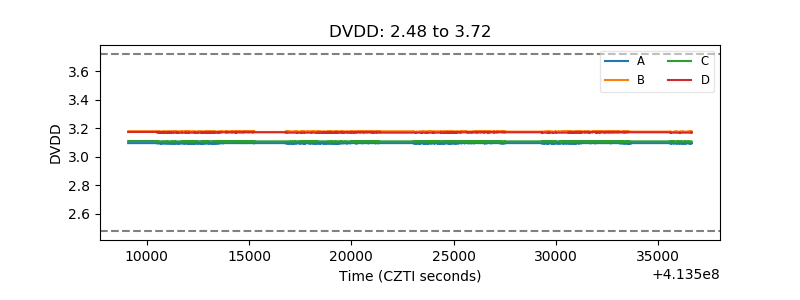 |
| Temperature 1 | 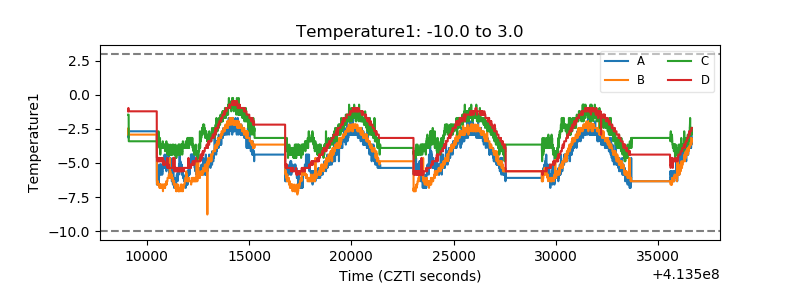 |
| Veto HV Monitor | 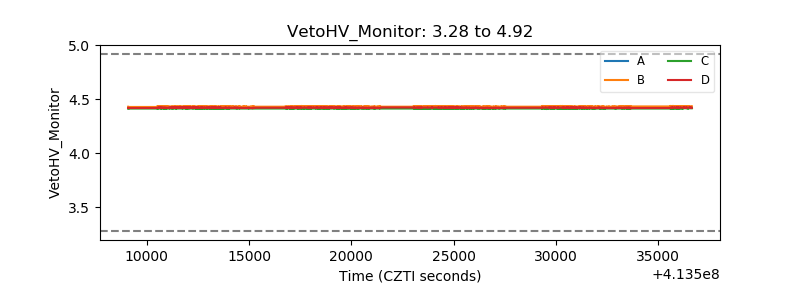 |
| Veto LLD | 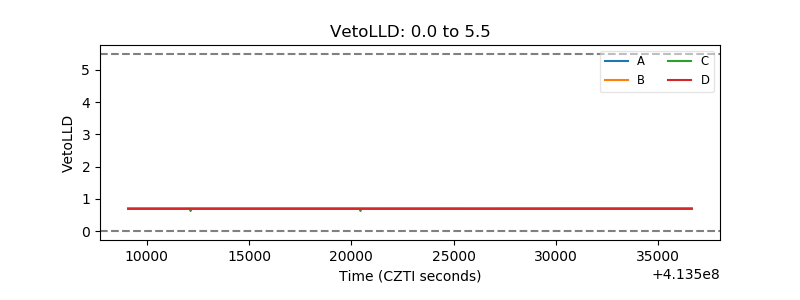 |
| Alpha Counter | 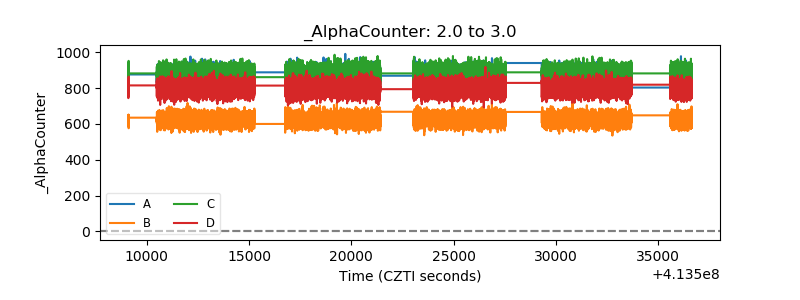 |
| _CPM_Rate | 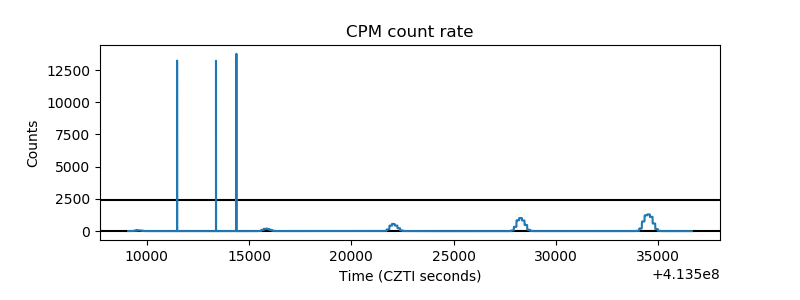 |
| CZT Counter | 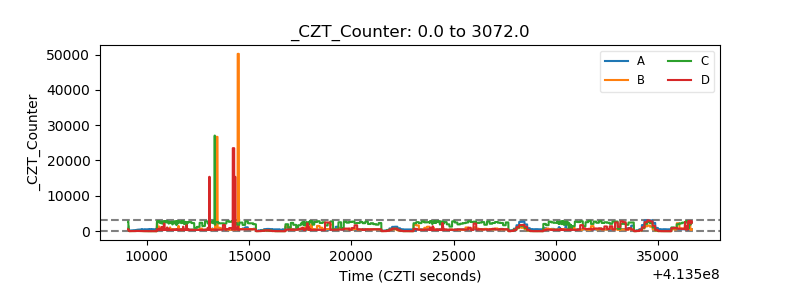 |
| +2.5 Volts monitor | 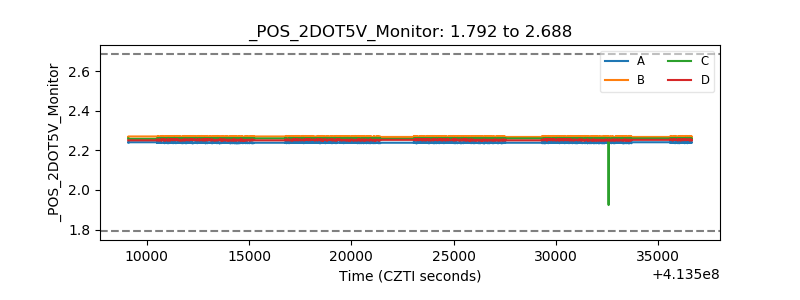 |
| +5 Volts monitor | 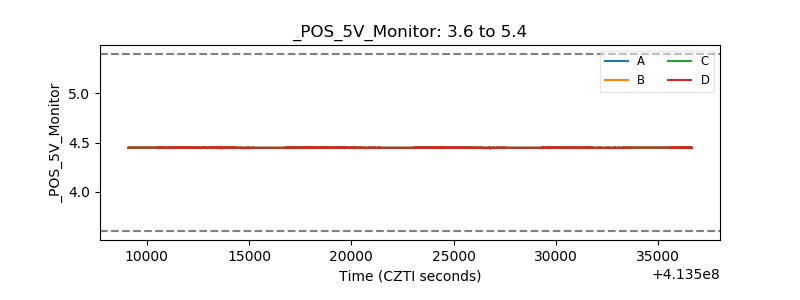 |
| _ROLL_ROT | 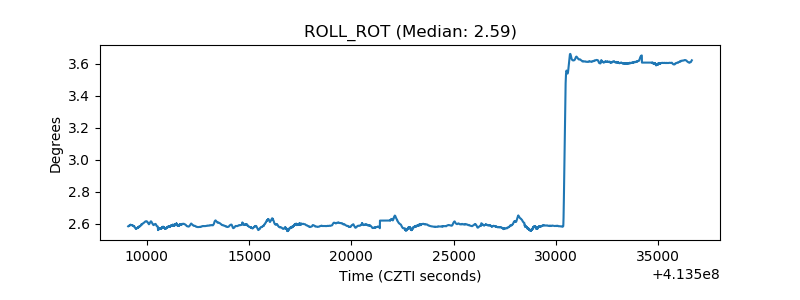 |
| _Roll_DEC | 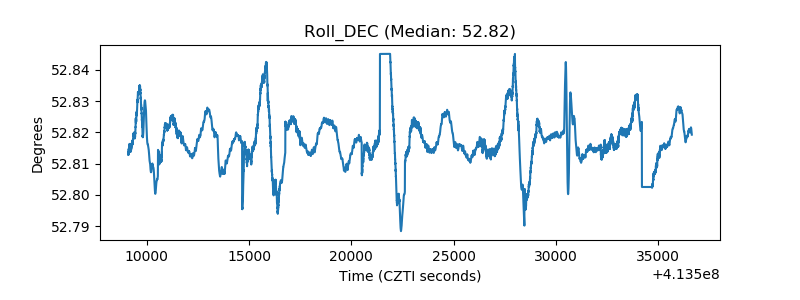 |
| _Roll_RA | 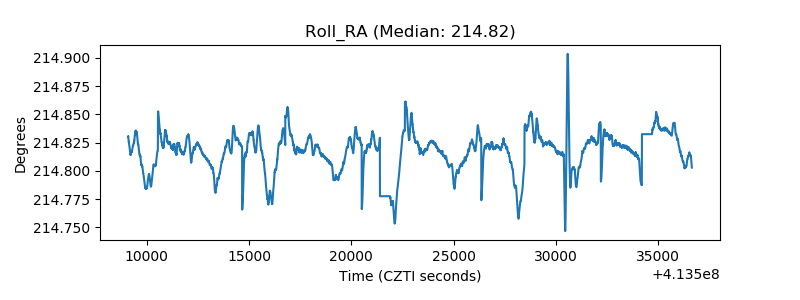 |
| Veto Counter | 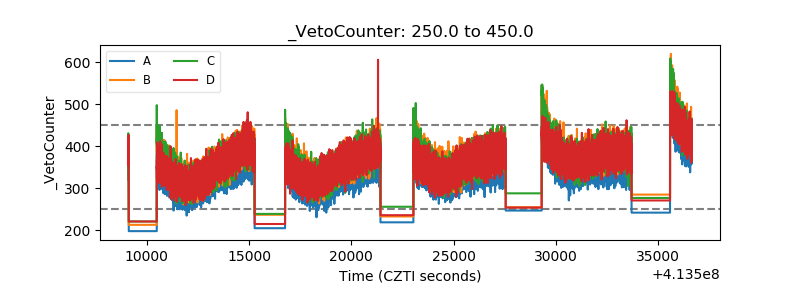 |