| Param | Original file | Final file |
|---|---|---|
| Filename | modeM0/AS1A12_022T01_9000005498_39822cztM0_level2.fits | modeM0/AS1A12_022T01_9000005498_39822cztM0_level2_quad_clean.evt |
| Size (bytes) | 596,882,880 | 73,287,360 |
| Size | 569.2 MB | 69.9 MB |
| Events in quadrant A | 2,896,622 | 615,989 |
| Events in quadrant B | 3,431,924 | 611,228 |
| Events in quadrant C | 11,294,189 | 145,287 |
| Events in quadrant D | 4,083,380 | 496,102 |
| Mode M0 | |||
|---|---|---|---|
| Quadrant | BADHDUFLAG | Total packets | Discarded packets |
| A | 0 | 11454 | 1 |
| B | 0 | 13449 | 0 |
| C | 0 | 36961 | 0 |
| D | 0 | 15447 | 0 |
| Mode M9 | |||
|---|---|---|---|
| Quadrant | BADHDUFLAG | Total packets | Discarded packets |
| A | 0 | 20 | 0 |
| B | 0 | 20 | 0 |
| C | 0 | 20 | 0 |
| D | 0 | 20 | 0 |
| Mode SS | |||
|---|---|---|---|
| Quadrant | BADHDUFLAG | Total packets | Discarded packets |
| A | 0 | 102 | 0 |
| B | 0 | 102 | 0 |
| C | 0 | 102 | 0 |
| D | 0 | 102 | 0 |
| Quadrant | Total seconds | Saturated seconds | Saturation percentage |
|---|---|---|---|
| A | 4997 | 57 | 1.140684% |
| B | 4997 | 211 | 4.222534% |
| C | 4997 | 3954 | 79.127476% |
| D | 4997 | 532 | 10.646388% |
Noise dominated data is calculated using 1-second bins in cleaned event files. If a bin has >2000 counts, and if more than 50% of those come from <1% of pixels, then it is considered to be noise-dominated and hence unusable.
| Quadrant | # 1 sec bins | Bins with >0 counts | Bins with >2000 counts | High rate bins dominated by noise | Noise dominated (total time) | Noise dominated (detector-on time) | Marked lightcurve |
|---|---|---|---|---|---|---|---|
| A | 6970 | 4998 | 46 | 46 | 0.66% | 0.92% | 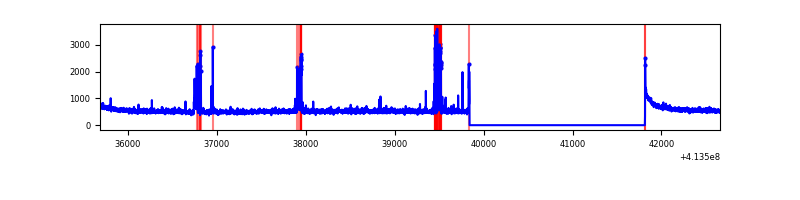 |
| B | 6970 | 4998 | 157 | 157 | 2.25% | 3.14% | 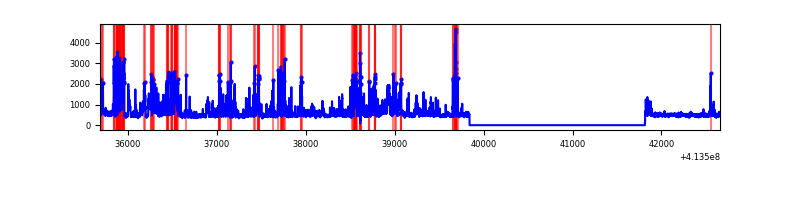 |
| C | 6970 | 4997 | 3635 | 3635 | 52.15% | 72.74% | 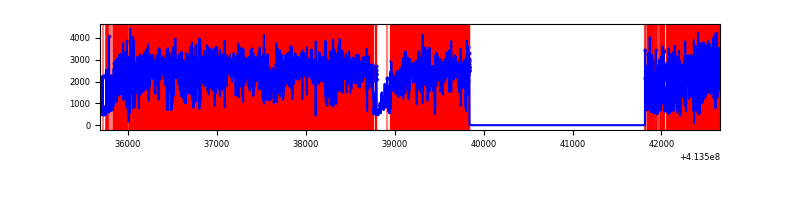 |
| D | 6970 | 4998 | 487 | 487 | 6.99% | 9.74% | 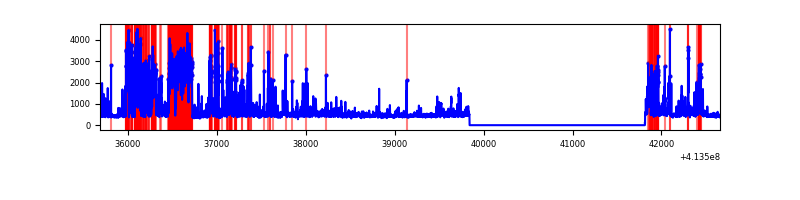 |
Top three noisy pixels from each quadrant. If the there are fewer than three noisy pixels in the level2.evt file, extra rows are filled as -1
| Pixel properties | Quadrant properties | ||||||
|---|---|---|---|---|---|---|---|
| Quadrant | DetID | PixID | Counts | Sigma | Mean | Median | Sigma |
| A | 10 | 83 | 397600 | 3374.24 | 580 | 568 | 117.7 |
| A | 9 | 143 | 175526 | 1486.91 | 580 | 568 | 117.7 |
| A | 13 | 248 | 52747 | 443.45 | 580 | 568 | 117.7 |
| B | 4 | 171 | 910953 | 8513.1 | 562 | 547 | 106.9 |
| B | 5 | 172 | 152048 | 1416.67 | 562 | 547 | 106.9 |
| B | 5 | 255 | 50017 | 462.59 | 562 | 547 | 106.9 |
| C | 9 | 187 | 9655851 | 136752.4 | 303 | 305 | 70.6 |
| C | 15 | 208 | 311456 | 4406.86 | 303 | 305 | 70.6 |
| C | 15 | 214 | 125025 | 1766.42 | 303 | 305 | 70.6 |
| D | 12 | 227 | 1614664 | 12356.66 | 534 | 516 | 130.6 |
| D | 2 | 249 | 191297 | 1460.47 | 534 | 516 | 130.6 |
| D | 13 | 249 | 137364 | 1047.6 | 534 | 516 | 130.6 |
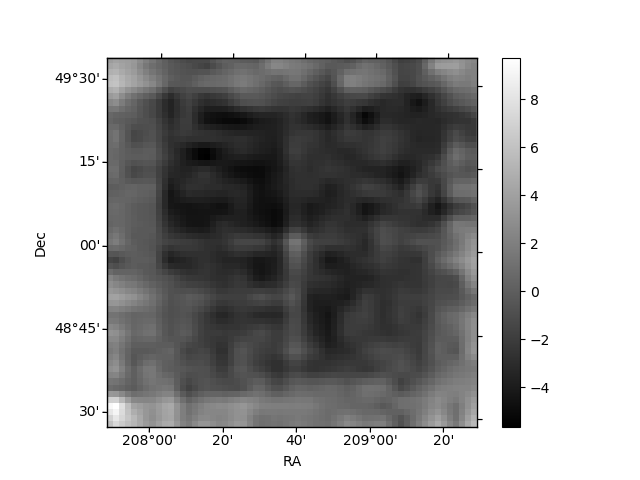
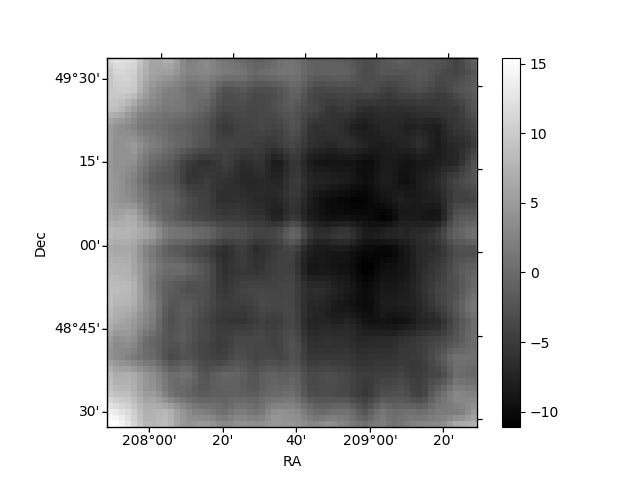
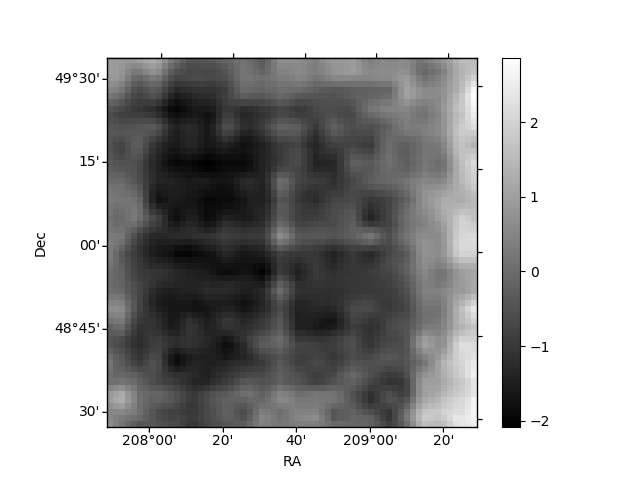
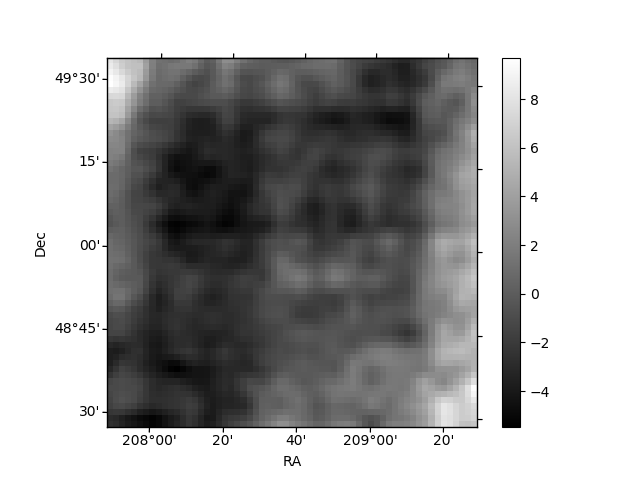
Histogram calculated using DETX and DETY for each event in the final _common_clean file
| Quadrant A | 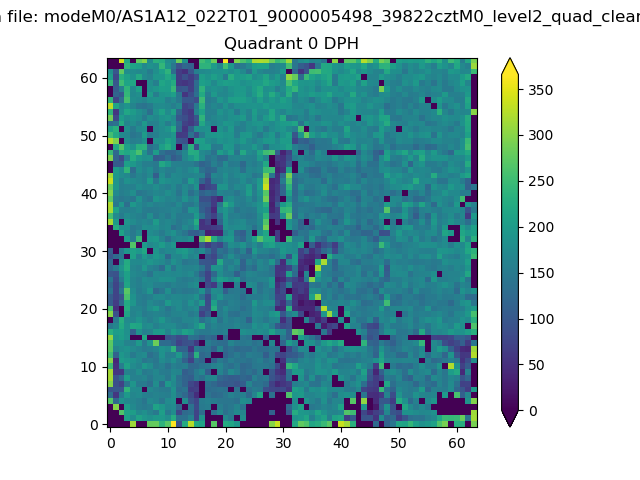 |
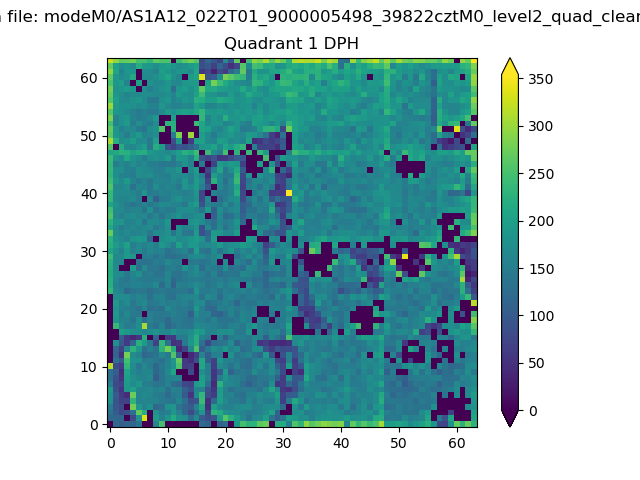 |
Quadrant B |
|---|---|---|---|
| Quadrant D | 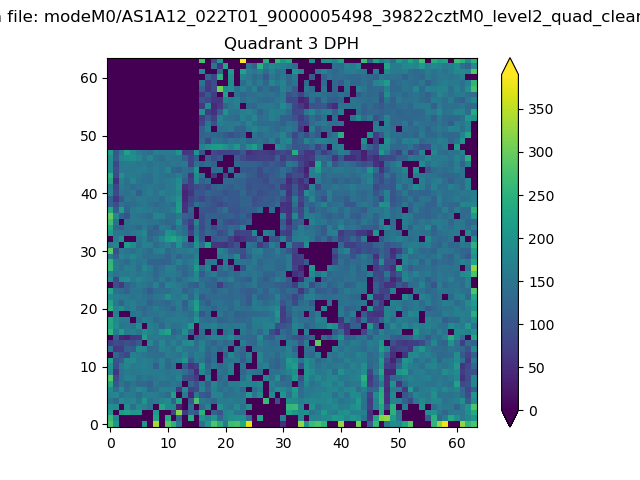 |
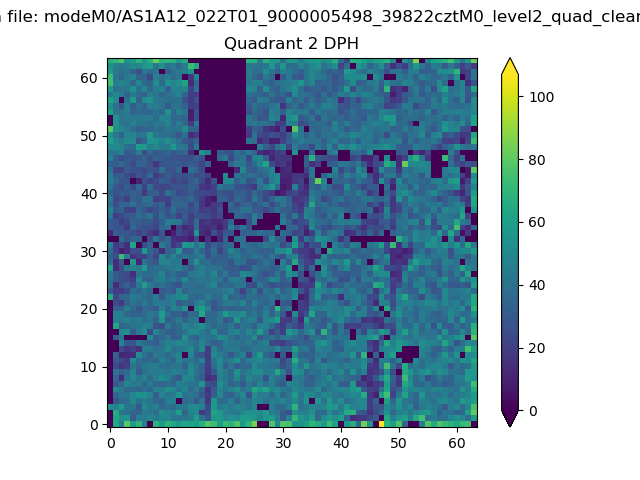 |
Quadrant C |
| Plot type | Count rate plots | Images |
|---|---|---|
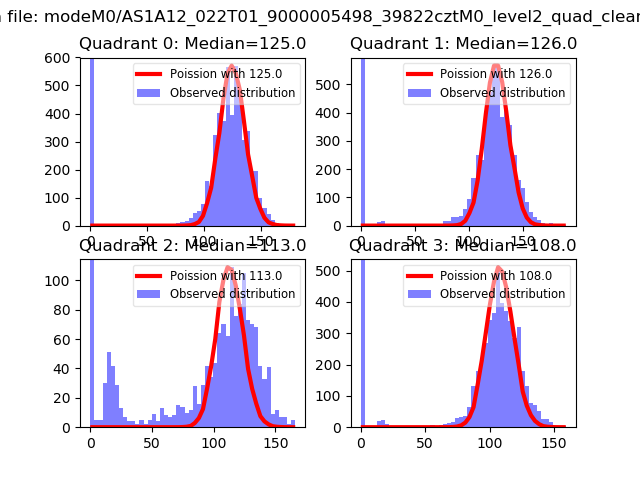
| Comparison with Poisson distribution Blue bars denote a histogram of data divided into 1 sec bins. Red curve is a Poisson curve with rate = median count rate of data. |
 |
 |
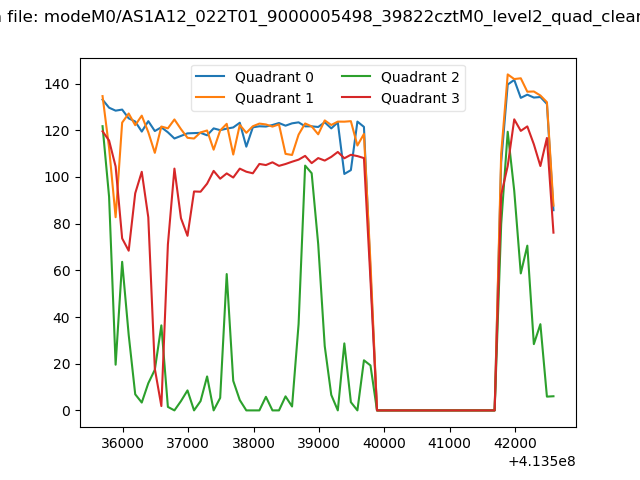
| Quadrant-wise count rates Data is divided into 100 sec bins |
 |
|
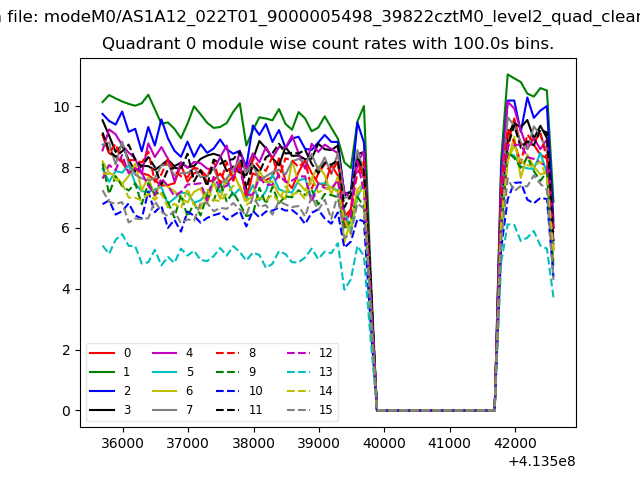
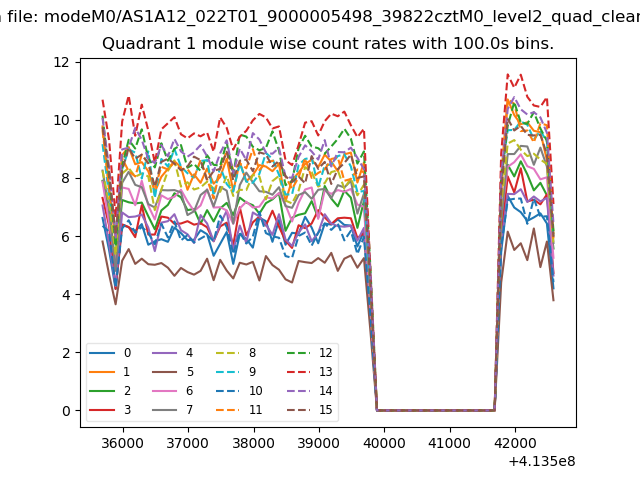
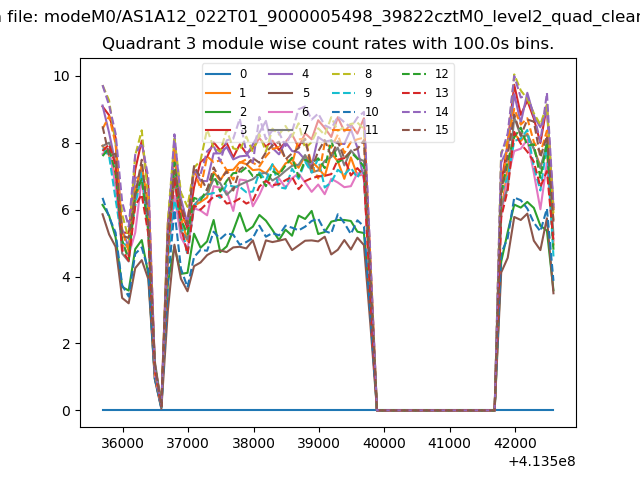
| Module-wise count rates for Quadrant A Data is divided into 100 sec bins |
 |
 |
| Module-wise count rates for Quadrant B Data is divided into 100 sec bins |
 |
 |
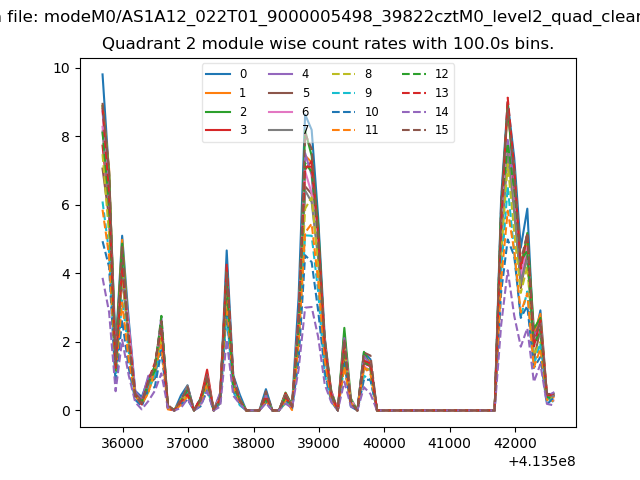
| Module-wise count rates for Quadrant C Data is divided into 100 sec bins |
 |
 |
| Module-wise count rates for Quadrant D Data is divided into 100 sec bins |
 |
 |
| Parameter | Plot |
|---|---|
| CZT HV Monitor | 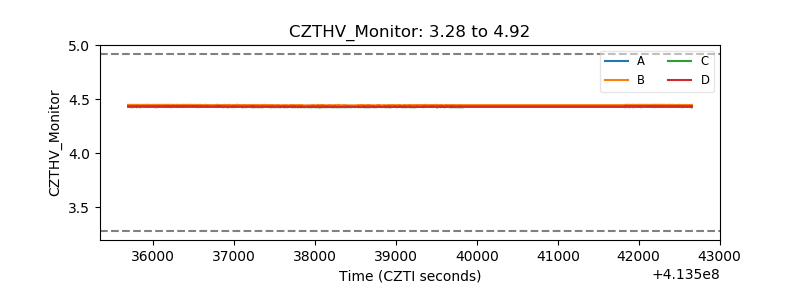 |
| D_VDD | 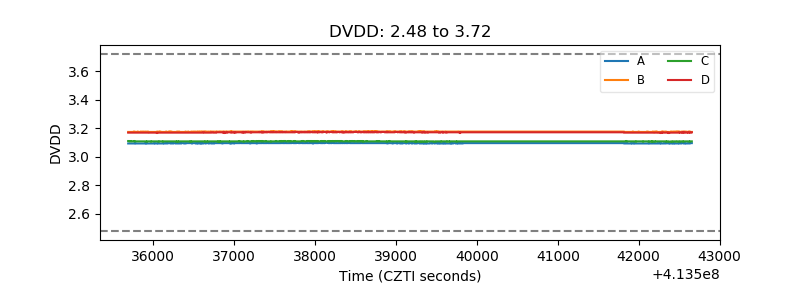 |
| Temperature 1 |  |
| Veto HV Monitor | 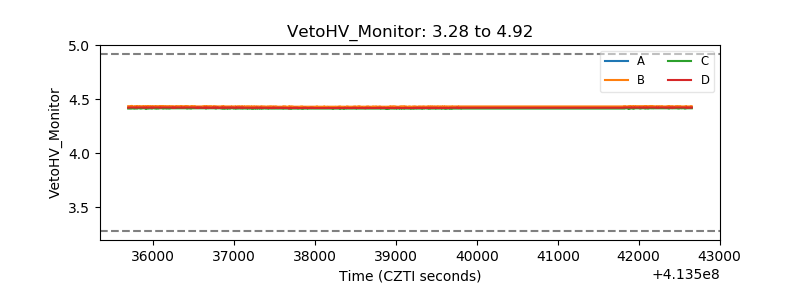 |
| Veto LLD | 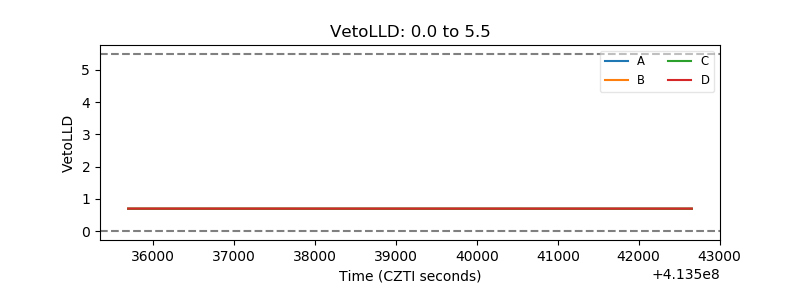 |
| Alpha Counter | 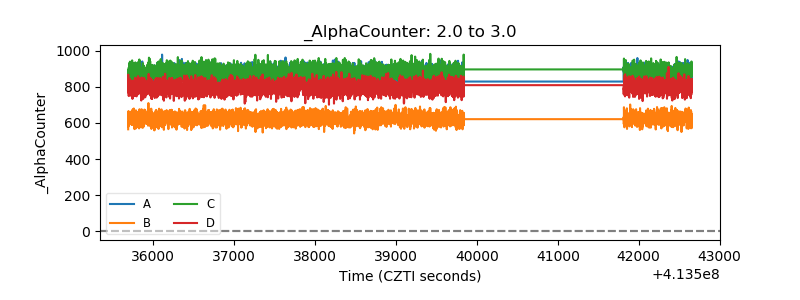 |
| _CPM_Rate | 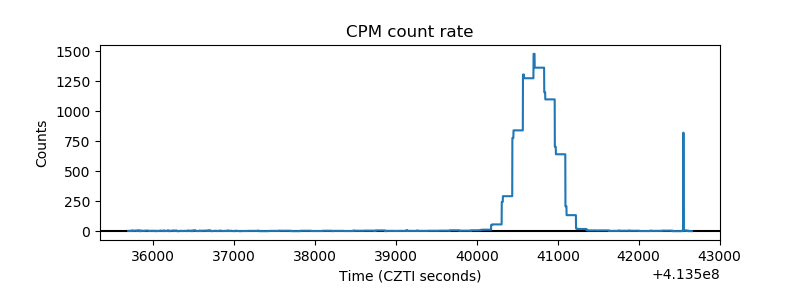 |
| CZT Counter | 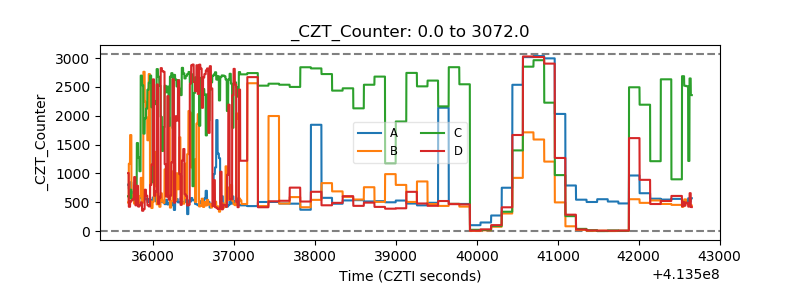 |
| +2.5 Volts monitor | 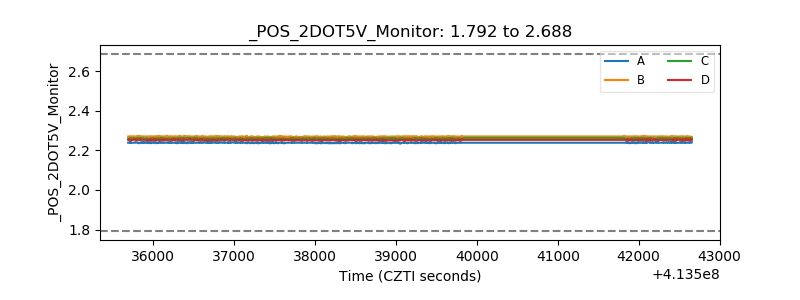 |
| +5 Volts monitor |  |
| _ROLL_ROT | 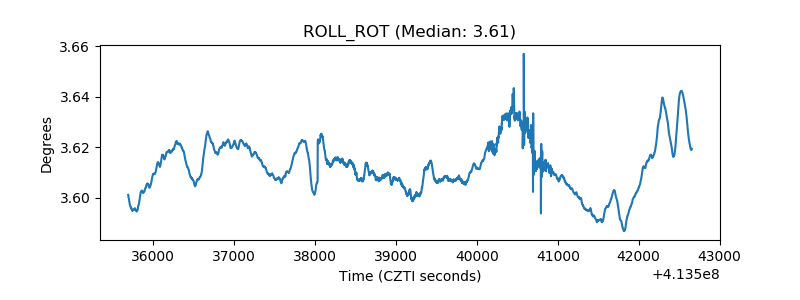 |
| _Roll_DEC | 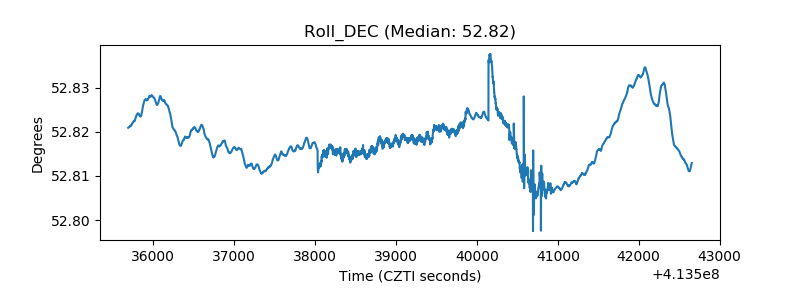 |
| _Roll_RA | 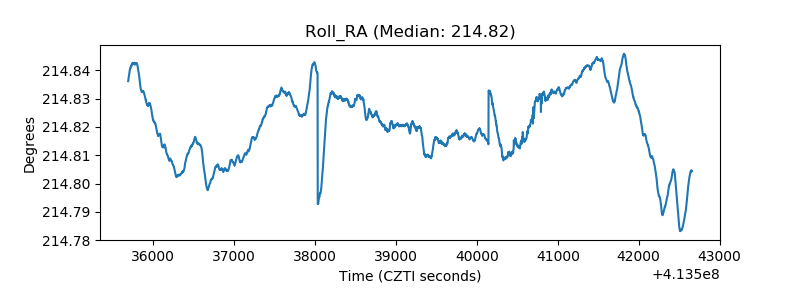 |
| Veto Counter | 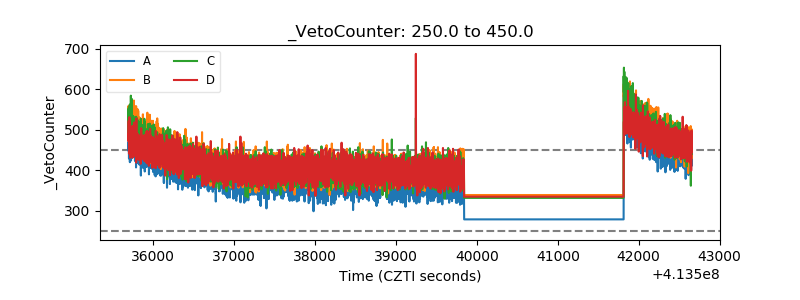 |