| Param | Original file | Final file |
|---|---|---|
| Filename | modeM0/AS1A12_022T01_9000005498_39823cztM0_level2.fits | modeM0/AS1A12_022T01_9000005498_39823cztM0_level2_quad_clean.evt |
| Size (bytes) | 617,883,840 | 74,056,320 |
| Size | 589.3 MB | 70.6 MB |
| Events in quadrant A | 3,290,073 | 628,128 |
| Events in quadrant B | 2,690,944 | 645,568 |
| Events in quadrant C | 11,039,843 | 163,967 |
| Events in quadrant D | 5,461,539 | 453,140 |
| Mode M0 | |||
|---|---|---|---|
| Quadrant | BADHDUFLAG | Total packets | Discarded packets |
| A | 0 | 12760 | 2 |
| B | 0 | 11114 | 1 |
| C | 0 | 36238 | 1 |
| D | 0 | 19468 | 1 |
| Mode M9 | |||
|---|---|---|---|
| Quadrant | BADHDUFLAG | Total packets | Discarded packets |
| A | 0 | 25 | 0 |
| B | 0 | 25 | 0 |
| C | 0 | 25 | 0 |
| D | 0 | 26 | 0 |
| Mode SS | |||
|---|---|---|---|
| Quadrant | BADHDUFLAG | Total packets | Discarded packets |
| A | 0 | 102 | 0 |
| B | 0 | 102 | 0 |
| C | 0 | 102 | 0 |
| D | 0 | 102 | 0 |
| Quadrant | Total seconds | Saturated seconds | Saturation percentage |
|---|---|---|---|
| A | 5013 | 140 | 2.792739% |
| B | 5013 | 41 | 0.817874% |
| C | 5013 | 3862 | 77.039697% |
| D | 5013 | 1070 | 21.344504% |
Noise dominated data is calculated using 1-second bins in cleaned event files. If a bin has >2000 counts, and if more than 50% of those come from <1% of pixels, then it is considered to be noise-dominated and hence unusable.
| Quadrant | # 1 sec bins | Bins with >0 counts | Bins with >2000 counts | High rate bins dominated by noise | Noise dominated (total time) | Noise dominated (detector-on time) | Marked lightcurve |
|---|---|---|---|---|---|---|---|
| A | 7075 | 5014 | 121 | 121 | 1.71% | 2.41% | 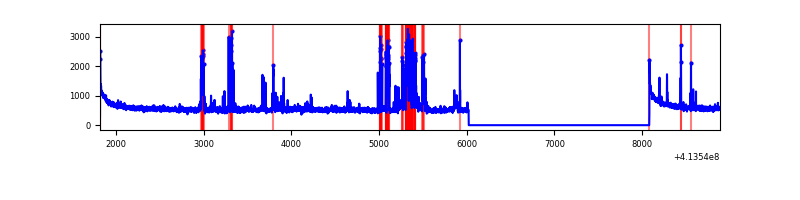 |
| B | 7075 | 5014 | 24 | 24 | 0.34% | 0.48% | 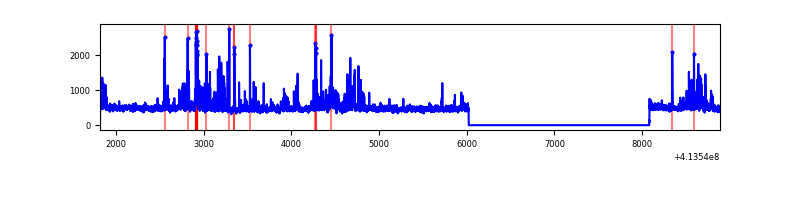 |
| C | 7075 | 5014 | 3432 | 3432 | 48.51% | 68.45% | 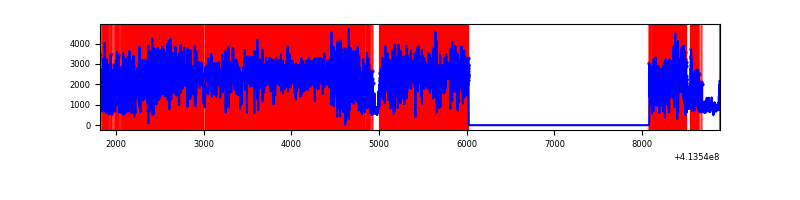 |
| D | 7075 | 5014 | 975 | 975 | 13.78% | 19.45% | 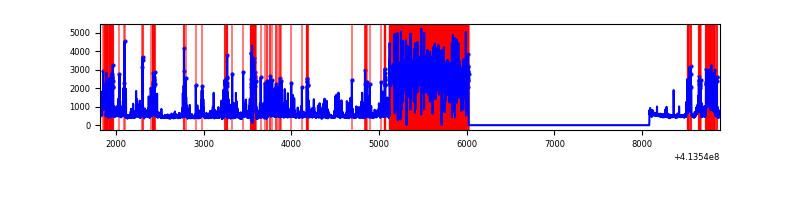 |
Top three noisy pixels from each quadrant. If the there are fewer than three noisy pixels in the level2.evt file, extra rows are filled as -1
| Pixel properties | Quadrant properties | ||||||
|---|---|---|---|---|---|---|---|
| Quadrant | DetID | PixID | Counts | Sigma | Mean | Median | Sigma |
| A | 10 | 83 | 446803 | 3758.62 | 591 | 581 | 118.7 |
| A | 14 | 235 | 294660 | 2477.09 | 591 | 581 | 118.7 |
| A | 9 | 143 | 201813 | 1695.02 | 591 | 581 | 118.7 |
| B | 4 | 171 | 251363 | 2260.02 | 582 | 568 | 111.0 |
| B | 5 | 32 | 52966 | 472.18 | 582 | 568 | 111.0 |
| B | 5 | 172 | 43189 | 384.07 | 582 | 568 | 111.0 |
| C | 9 | 187 | 8957858 | 116577.52 | 327 | 329 | 76.8 |
| C | 15 | 208 | 634697 | 8255.96 | 327 | 329 | 76.8 |
| C | 15 | 214 | 130034 | 1688.04 | 327 | 329 | 76.8 |
| D | 12 | 227 | 2692445 | 22248.63 | 496 | 481 | 121.0 |
| D | 13 | 249 | 344042 | 2839.47 | 496 | 481 | 121.0 |
| D | 12 | 233 | 264808 | 2184.62 | 496 | 481 | 121.0 |
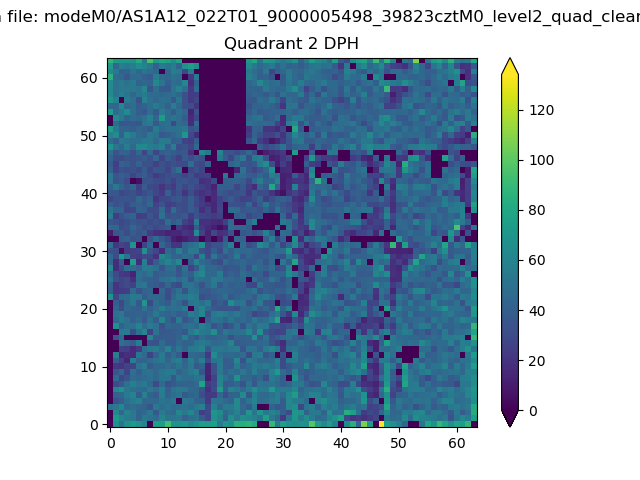
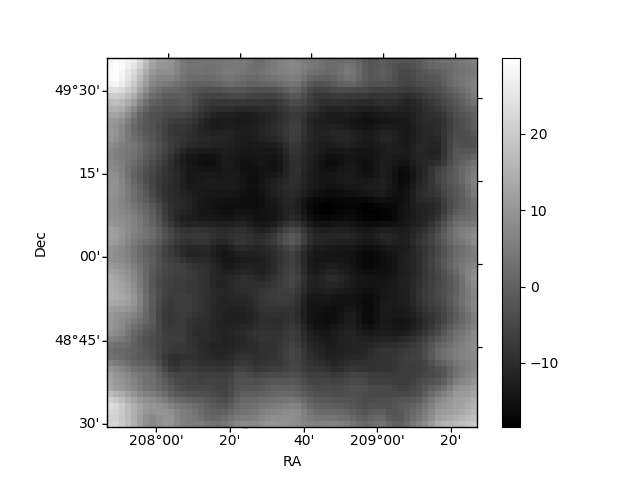
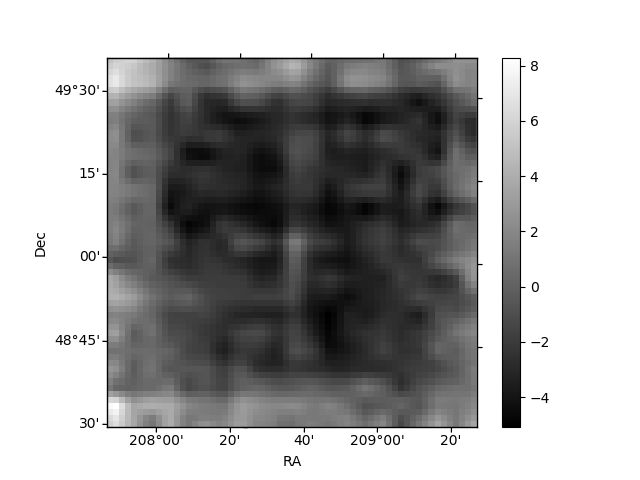
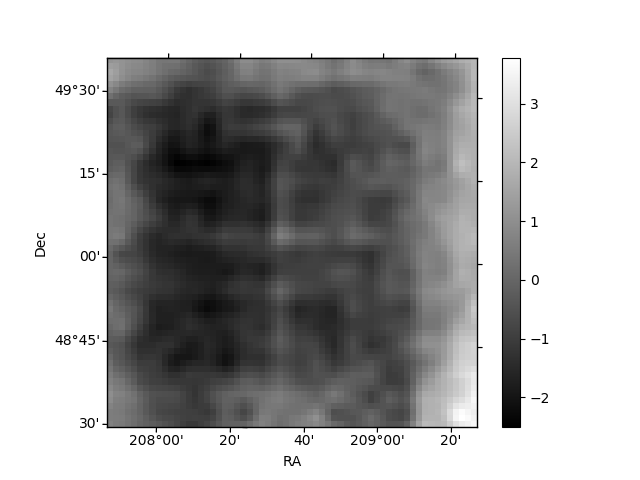
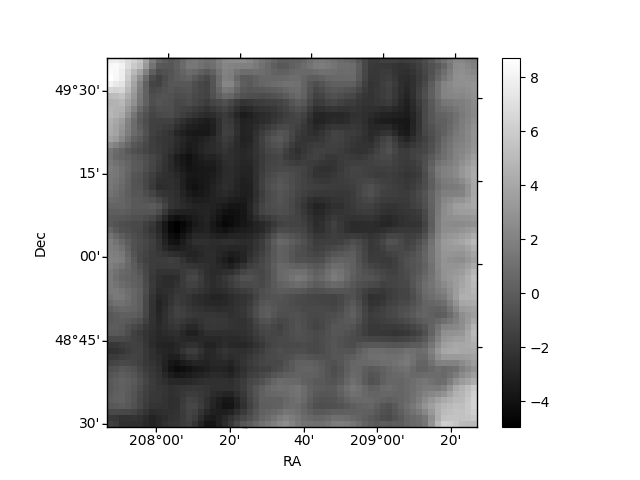
Histogram calculated using DETX and DETY for each event in the final _common_clean file
| Quadrant A | 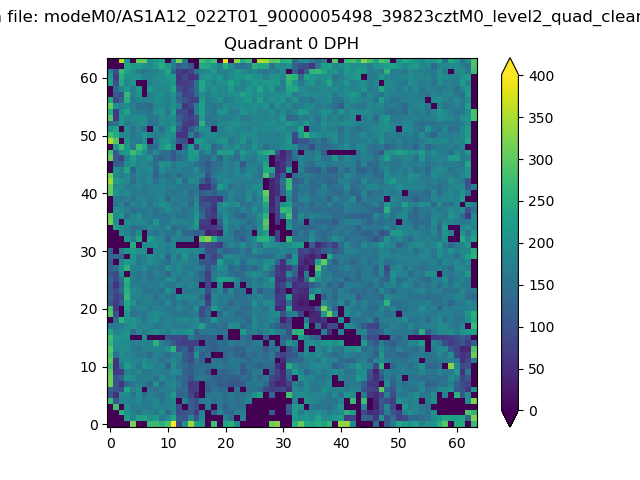 |
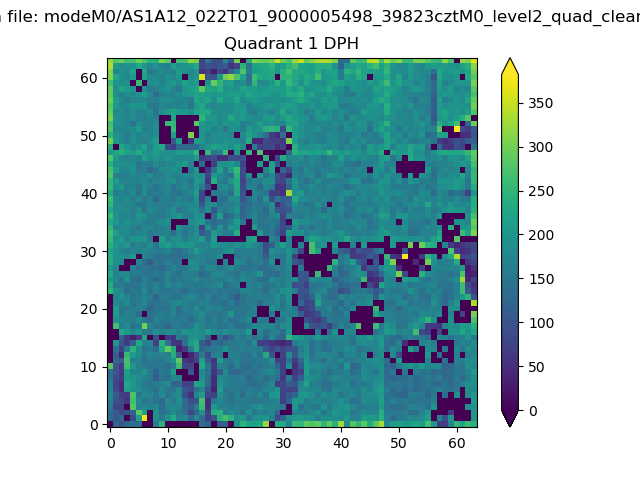 |
Quadrant B |
|---|---|---|---|
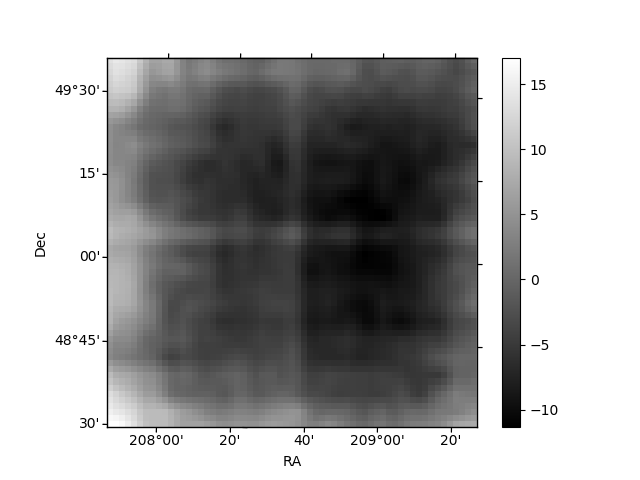
| Quadrant D | 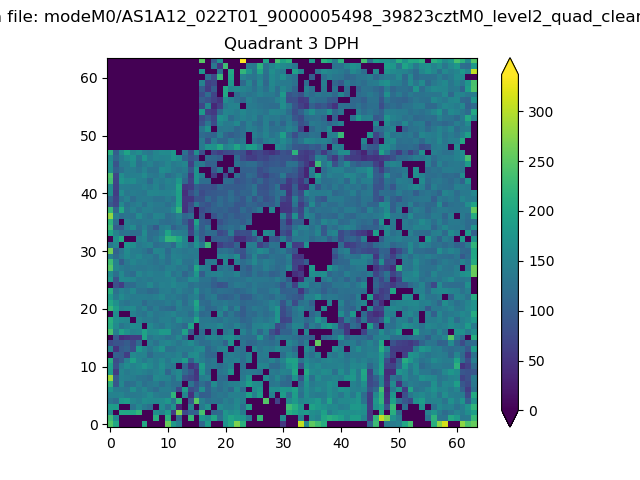 |
 |
Quadrant C |
| Plot type | Count rate plots | Images |
|---|---|---|
| Comparison with Poisson distribution Blue bars denote a histogram of data divided into 1 sec bins. Red curve is a Poisson curve with rate = median count rate of data. |
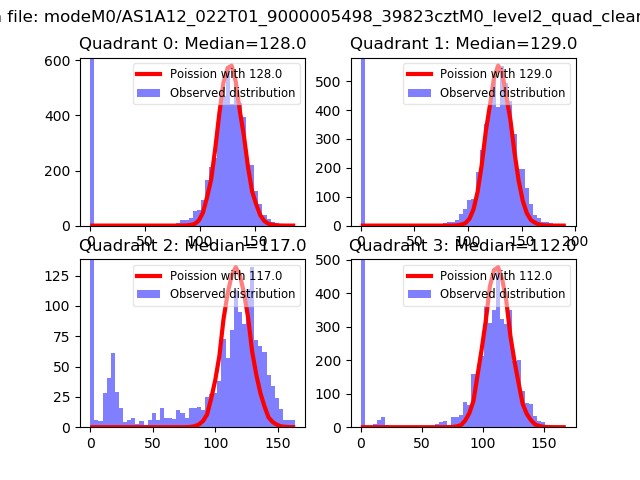 |
 |
| Quadrant-wise count rates Data is divided into 100 sec bins |
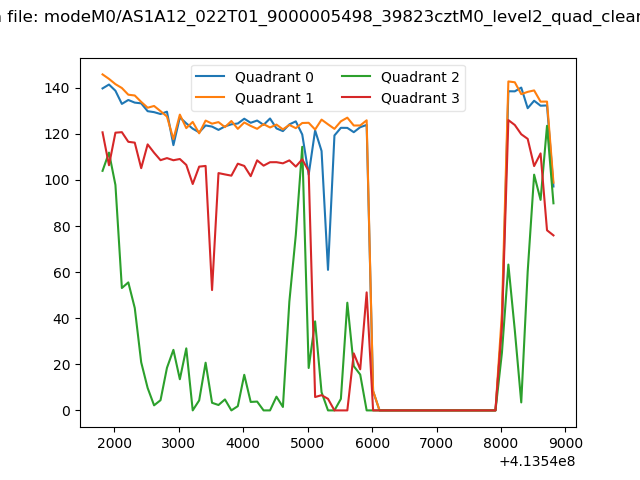 |
|
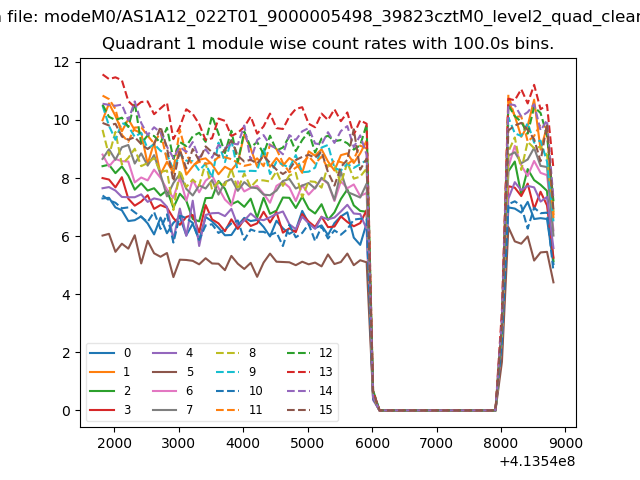
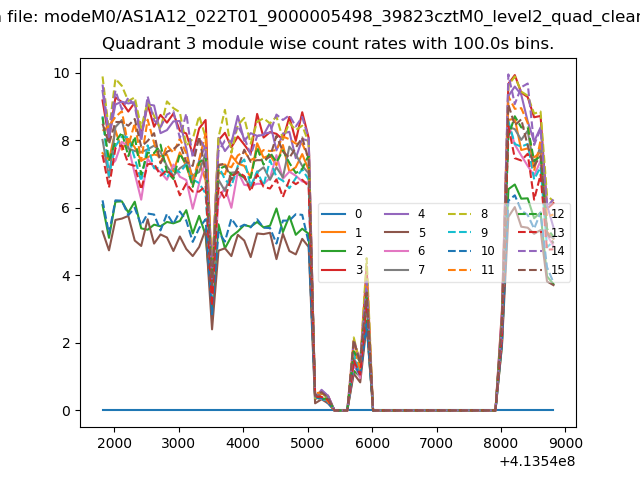
| Module-wise count rates for Quadrant A Data is divided into 100 sec bins |
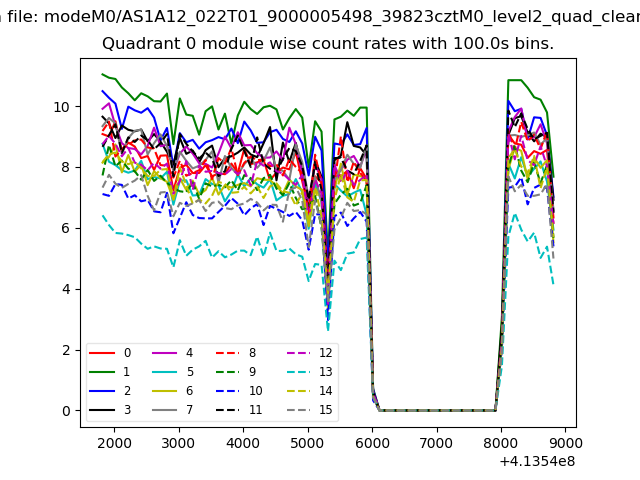 |
 |
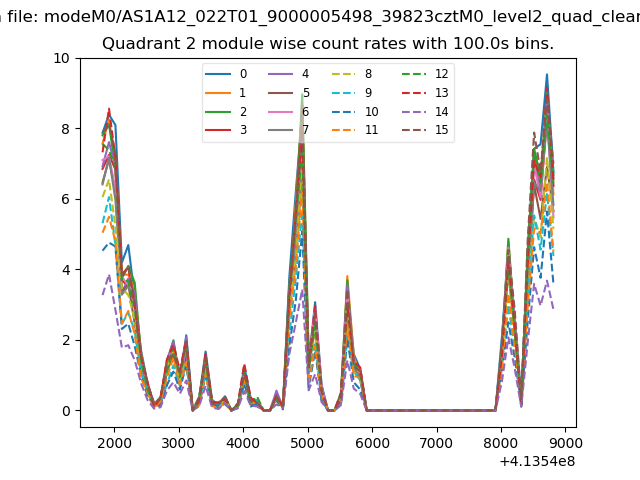
| Module-wise count rates for Quadrant B Data is divided into 100 sec bins |
 |
 |
| Module-wise count rates for Quadrant C Data is divided into 100 sec bins |
 |
 |
| Module-wise count rates for Quadrant D Data is divided into 100 sec bins |
 |
 |
| Parameter | Plot |
|---|---|
| CZT HV Monitor | 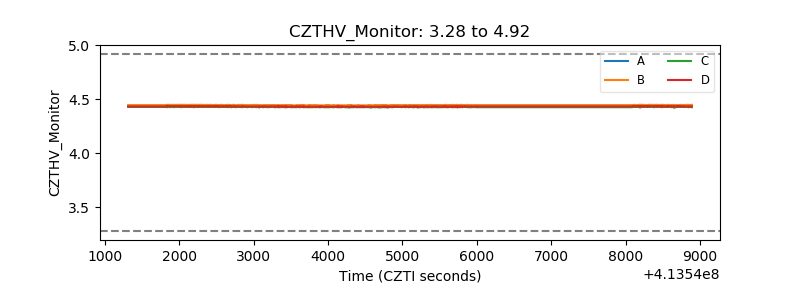 |
| D_VDD | 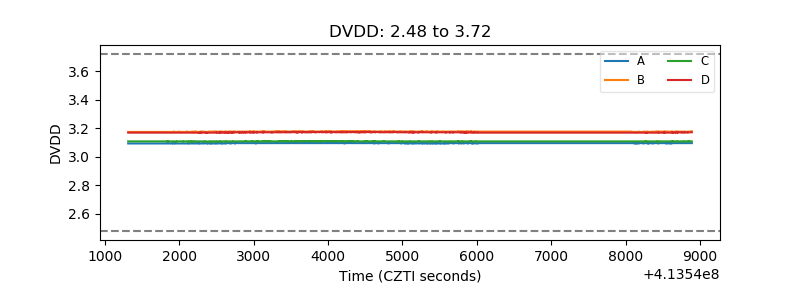 |
| Temperature 1 | 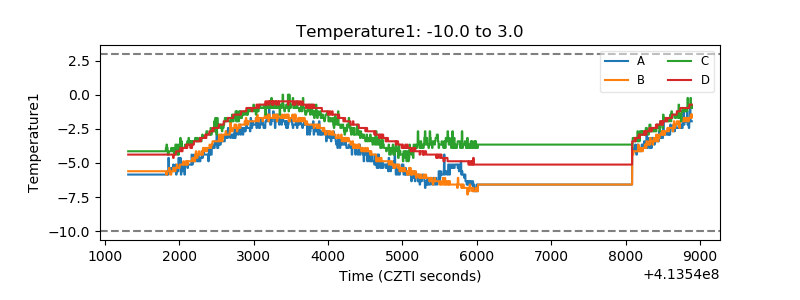 |
| Veto HV Monitor |  |
| Veto LLD | 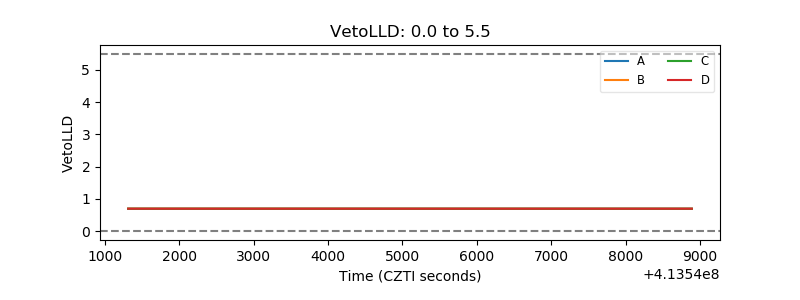 |
| Alpha Counter | 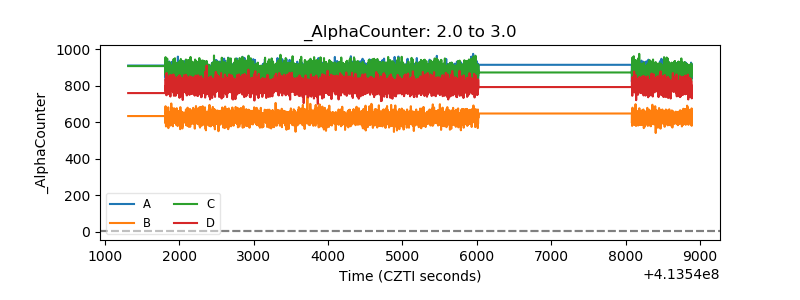 |
| _CPM_Rate | 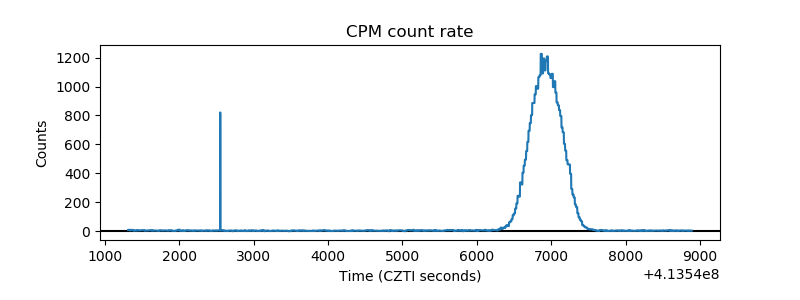 |
| CZT Counter | 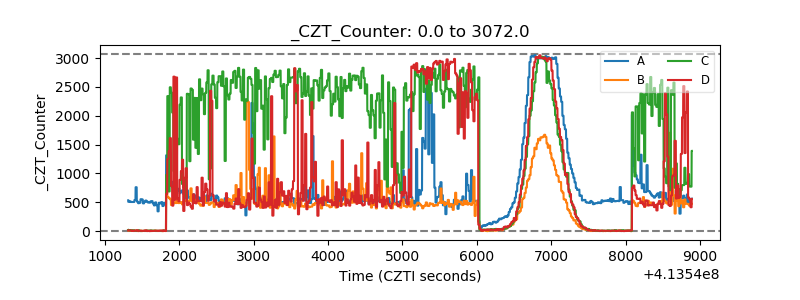 |
| +2.5 Volts monitor | 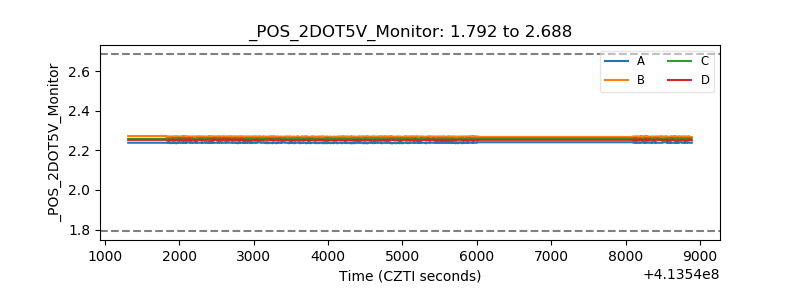 |
| +5 Volts monitor | 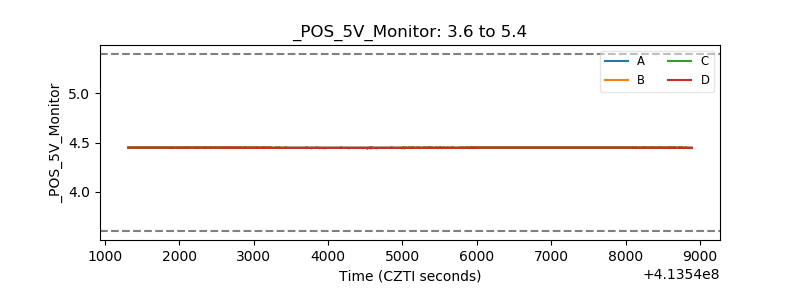 |
| _ROLL_ROT | 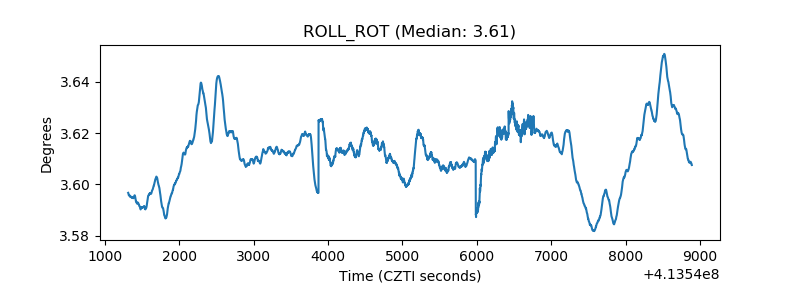 |
| _Roll_DEC | 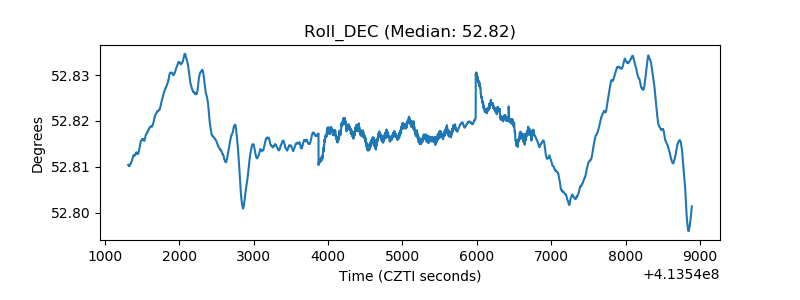 |
| _Roll_RA | 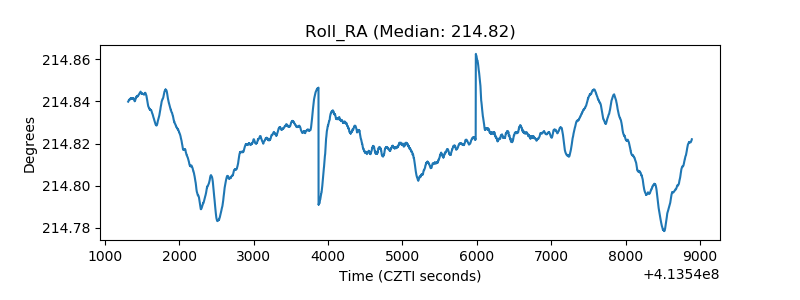 |
| Veto Counter | 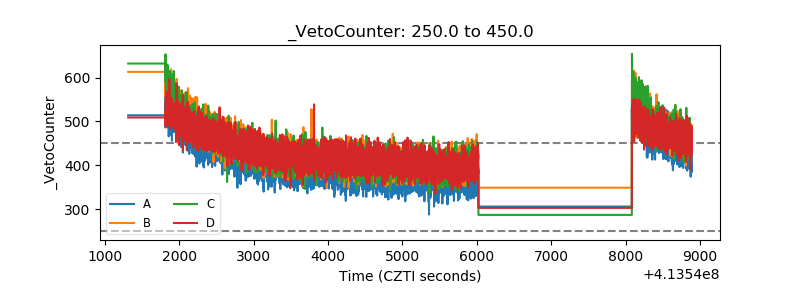 |