| Param | Original file | Final file |
|---|---|---|
| Filename | modeM0/AS1A12_022T01_9000005498_39824cztM0_level2.fits | modeM0/AS1A12_022T01_9000005498_39824cztM0_level2_quad_clean.evt |
| Size (bytes) | 625,985,280 | 77,408,640 |
| Size | 597.0 MB | 73.8 MB |
| Events in quadrant A | 3,180,843 | 655,777 |
| Events in quadrant B | 2,896,811 | 661,153 |
| Events in quadrant C | 11,914,035 | 123,529 |
| Events in quadrant D | 4,773,838 | 536,952 |
| Mode M0 | |||
|---|---|---|---|
| Quadrant | BADHDUFLAG | Total packets | Discarded packets |
| A | 0 | 12526 | 3 |
| B | 0 | 11923 | 2 |
| C | 0 | 38924 | 2 |
| D | 0 | 17663 | 2 |
| Mode M9 | |||
|---|---|---|---|
| Quadrant | BADHDUFLAG | Total packets | Discarded packets |
| A | 0 | 21 | 0 |
| B | 0 | 21 | 0 |
| C | 0 | 21 | 0 |
| D | 0 | 21 | 0 |
| Mode SS | |||
|---|---|---|---|
| Quadrant | BADHDUFLAG | Total packets | Discarded packets |
| A | 0 | 108 | 0 |
| B | 0 | 108 | 0 |
| C | 0 | 108 | 0 |
| D | 0 | 108 | 0 |
| Quadrant | Total seconds | Saturated seconds | Saturation percentage |
|---|---|---|---|
| A | 5229 | 46 | 0.879709% |
| B | 5229 | 66 | 1.262192% |
| C | 5229 | 4363 | 83.438516% |
| D | 5229 | 477 | 9.122203% |
Noise dominated data is calculated using 1-second bins in cleaned event files. If a bin has >2000 counts, and if more than 50% of those come from <1% of pixels, then it is considered to be noise-dominated and hence unusable.
| Quadrant | # 1 sec bins | Bins with >0 counts | Bins with >2000 counts | High rate bins dominated by noise | Noise dominated (total time) | Noise dominated (detector-on time) | Marked lightcurve |
|---|---|---|---|---|---|---|---|
| A | 7352 | 5230 | 38 | 38 | 0.52% | 0.73% | 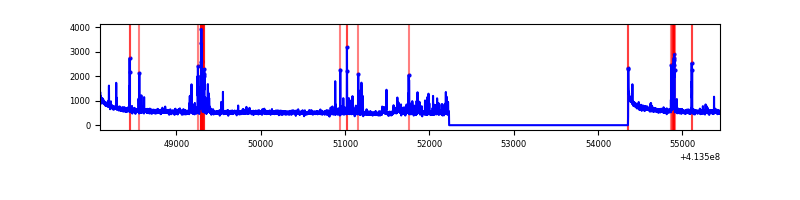 |
| B | 7352 | 5230 | 44 | 44 | 0.60% | 0.84% | 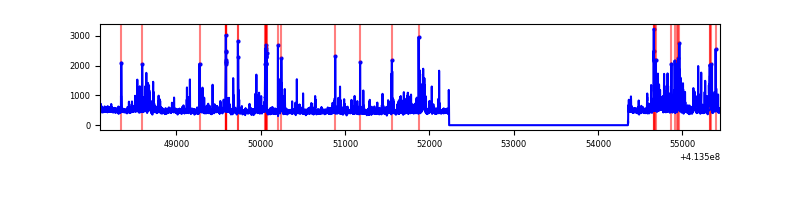 |
| C | 7352 | 5230 | 3833 | 3833 | 52.14% | 73.29% | 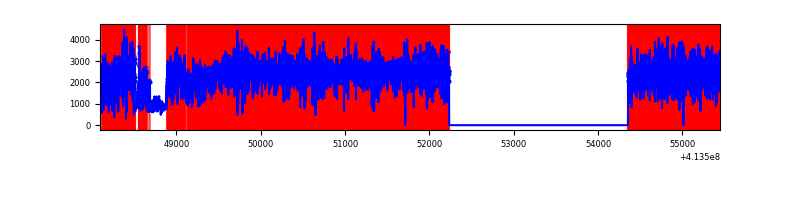 |
| D | 7352 | 5230 | 452 | 452 | 6.15% | 8.64% | 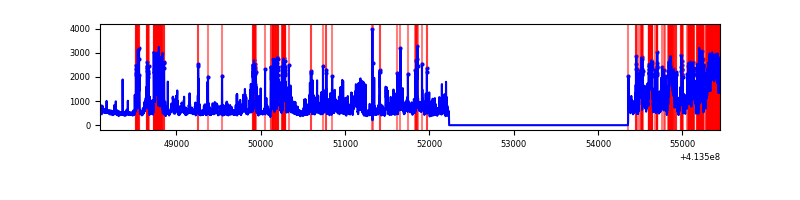 |
Top three noisy pixels from each quadrant. If the there are fewer than three noisy pixels in the level2.evt file, extra rows are filled as -1
| Pixel properties | Quadrant properties | ||||||
|---|---|---|---|---|---|---|---|
| Quadrant | DetID | PixID | Counts | Sigma | Mean | Median | Sigma |
| A | 10 | 83 | 469923 | 3817.69 | 611 | 601 | 122.9 |
| A | 9 | 143 | 127451 | 1031.86 | 611 | 601 | 122.9 |
| A | 13 | 248 | 106086 | 858.07 | 611 | 601 | 122.9 |
| B | 4 | 171 | 258033 | 2265.32 | 600 | 585 | 113.6 |
| B | 5 | 255 | 106695 | 933.68 | 600 | 585 | 113.6 |
| B | 5 | 172 | 68119 | 594.24 | 600 | 585 | 113.6 |
| C | 9 | 187 | 8901646 | 121195.65 | 315 | 318 | 73.4 |
| C | 15 | 208 | 1587671 | 21612.54 | 315 | 318 | 73.4 |
| C | 15 | 214 | 124156 | 1686.11 | 315 | 318 | 73.4 |
| D | 12 | 227 | 992639 | 7075.65 | 579 | 563 | 140.2 |
| D | 12 | 233 | 957590 | 6825.68 | 579 | 563 | 140.2 |
| D | 13 | 249 | 246580 | 1754.63 | 579 | 563 | 140.2 |
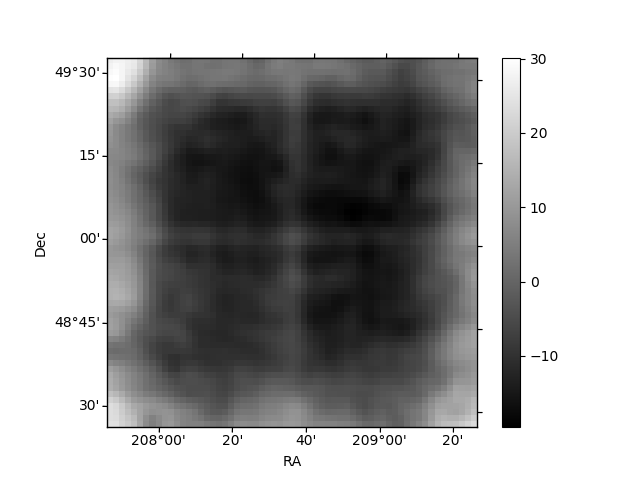
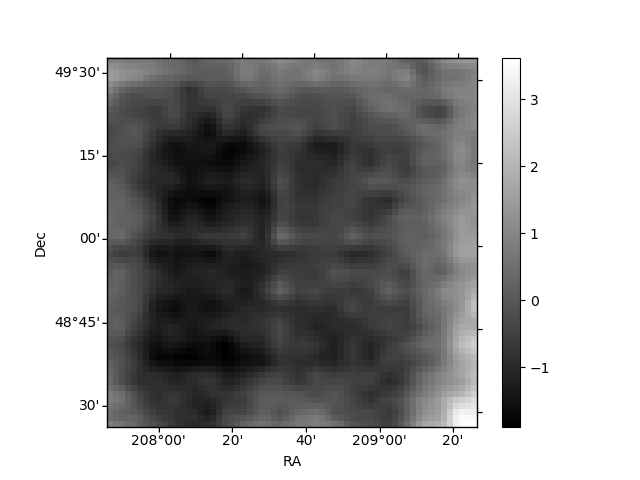
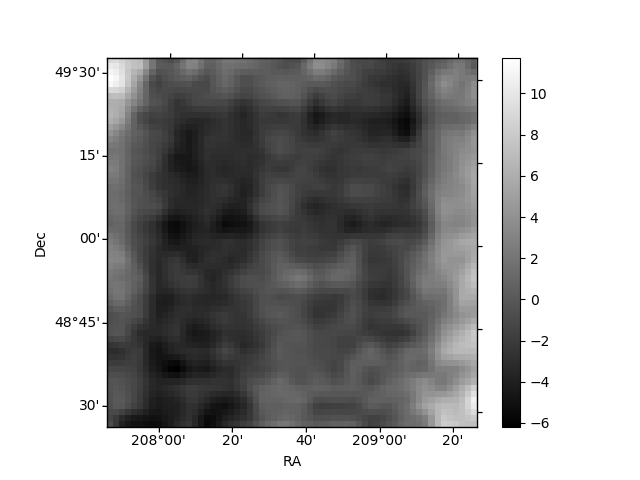
Histogram calculated using DETX and DETY for each event in the final _common_clean file
| Quadrant A | 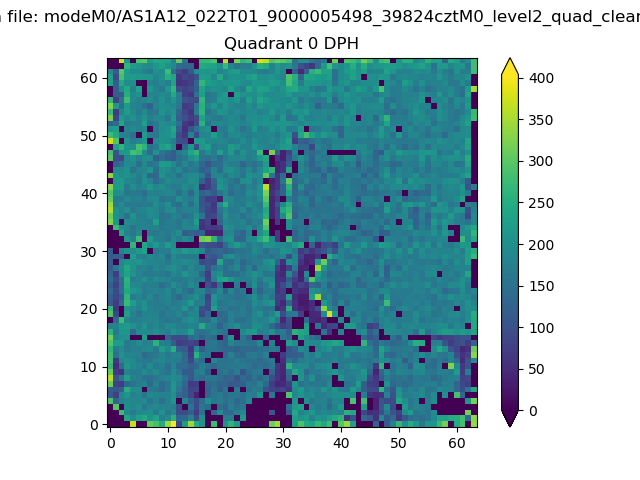 |
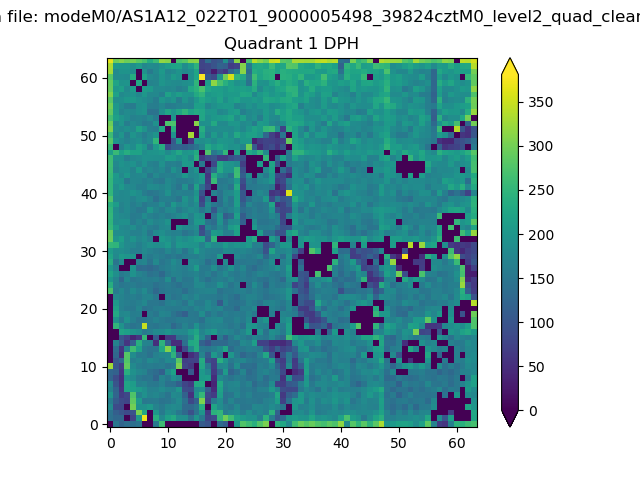 |
Quadrant B |
|---|---|---|---|
| Quadrant D | 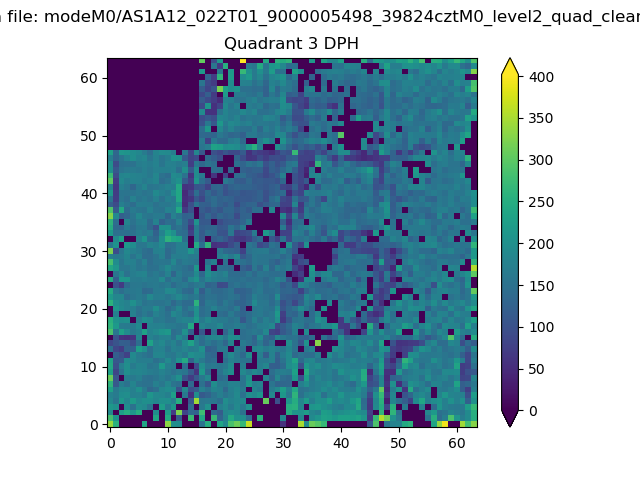 |
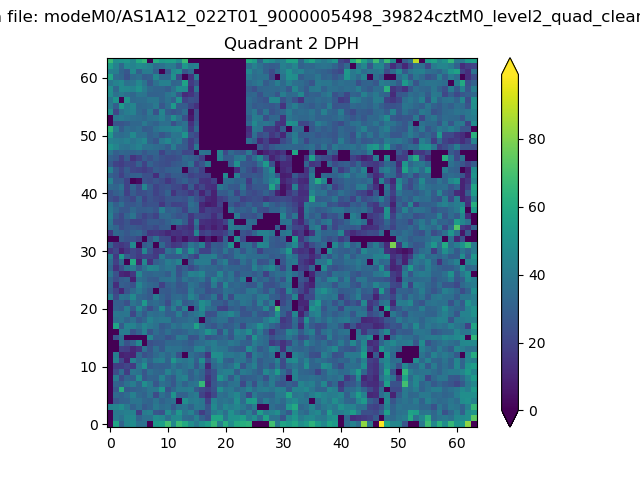 |
Quadrant C |
| Plot type | Count rate plots | Images |
|---|---|---|
| Comparison with Poisson distribution Blue bars denote a histogram of data divided into 1 sec bins. Red curve is a Poisson curve with rate = median count rate of data. |
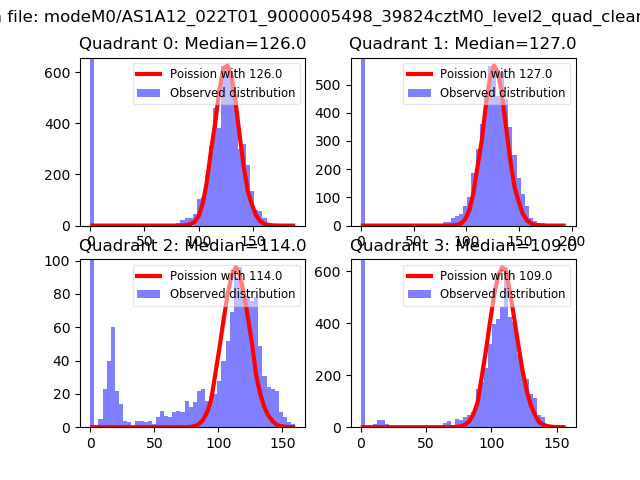 |
 |
| Quadrant-wise count rates Data is divided into 100 sec bins |
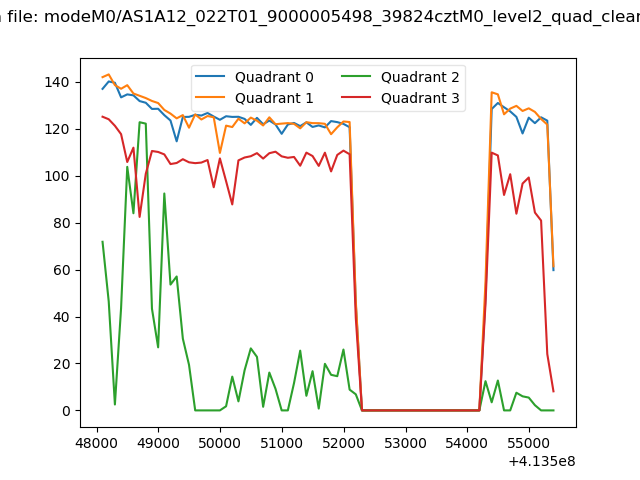 |
|
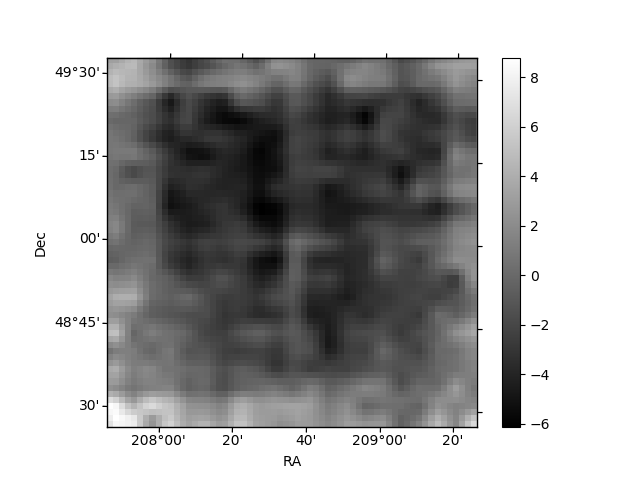
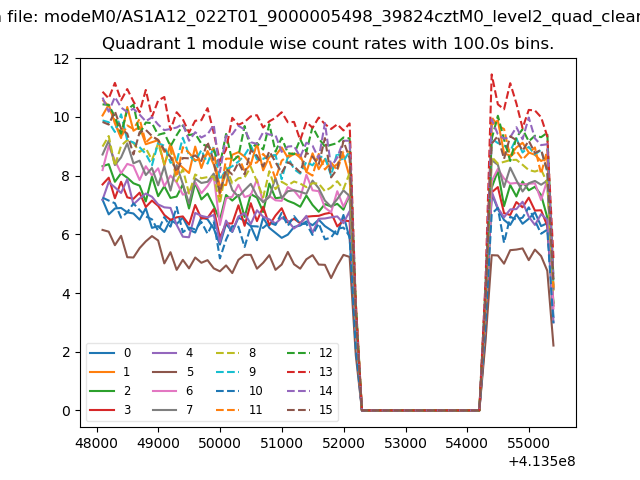
| Module-wise count rates for Quadrant A Data is divided into 100 sec bins |
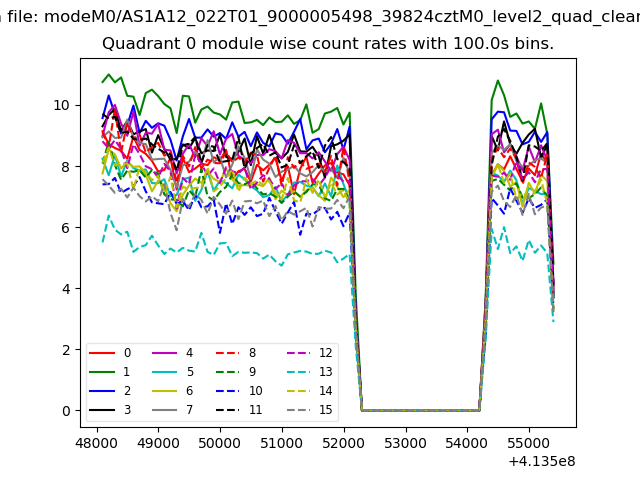 |
 |
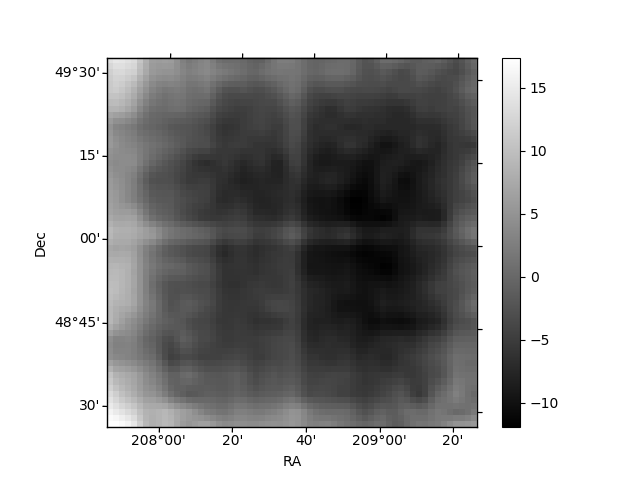
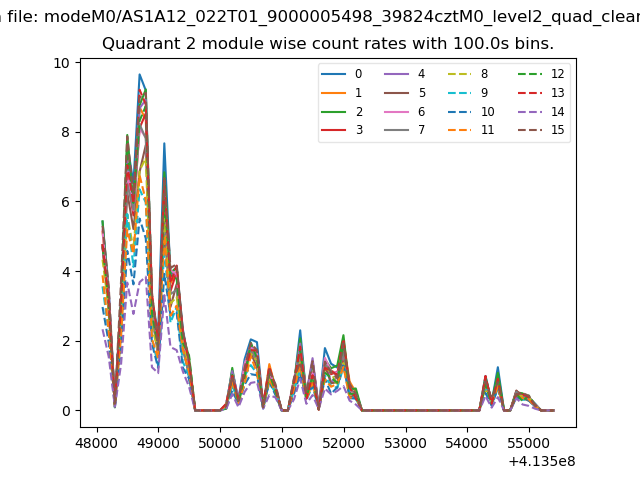
| Module-wise count rates for Quadrant B Data is divided into 100 sec bins |
 |
 |
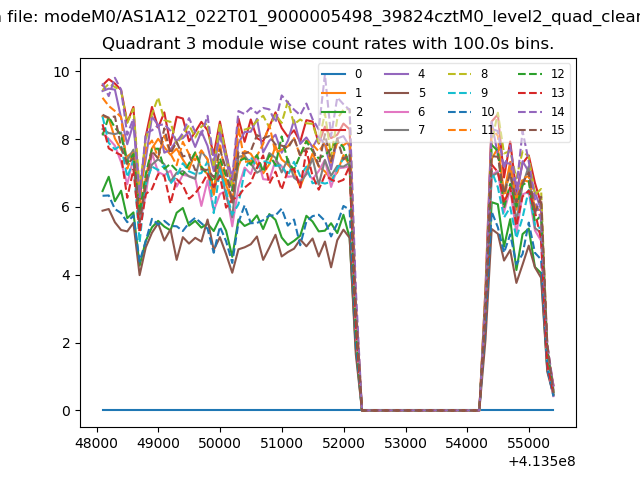
| Module-wise count rates for Quadrant C Data is divided into 100 sec bins |
 |
 |
| Module-wise count rates for Quadrant D Data is divided into 100 sec bins |
 |
 |
| Parameter | Plot |
|---|---|
| CZT HV Monitor | 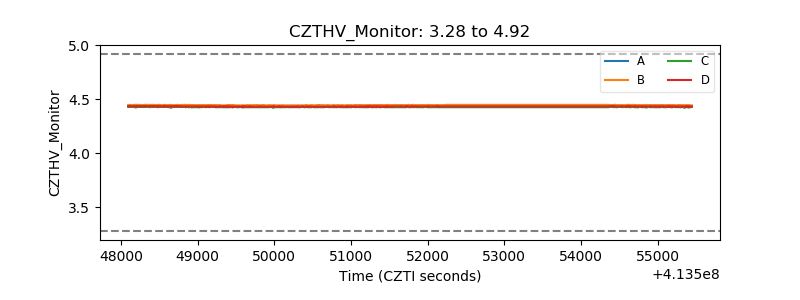 |
| D_VDD | 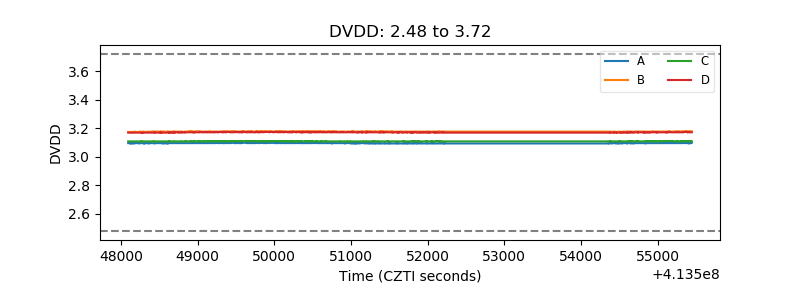 |
| Temperature 1 | 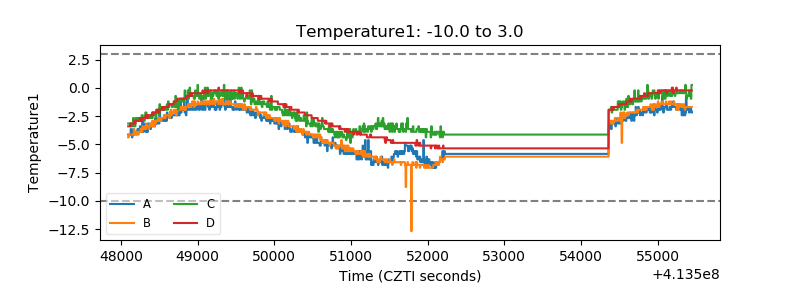 |
| Veto HV Monitor | 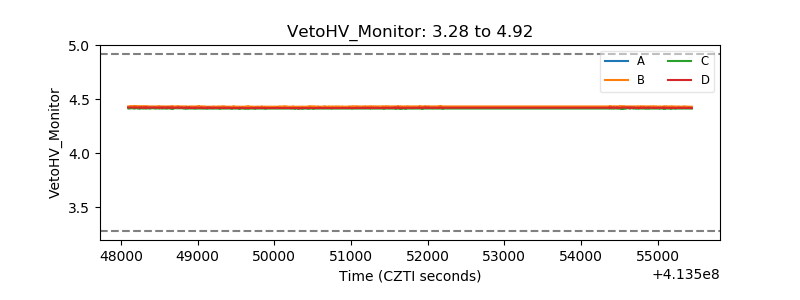 |
| Veto LLD | 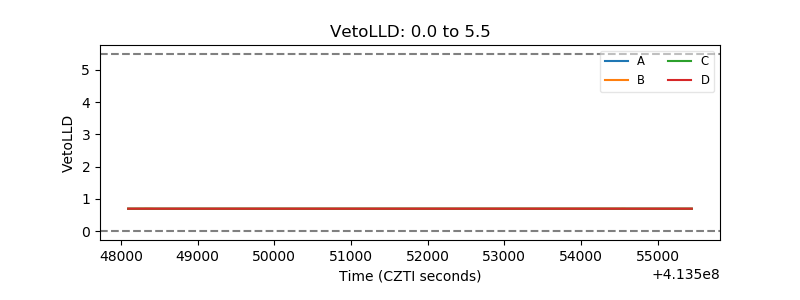 |
| Alpha Counter | 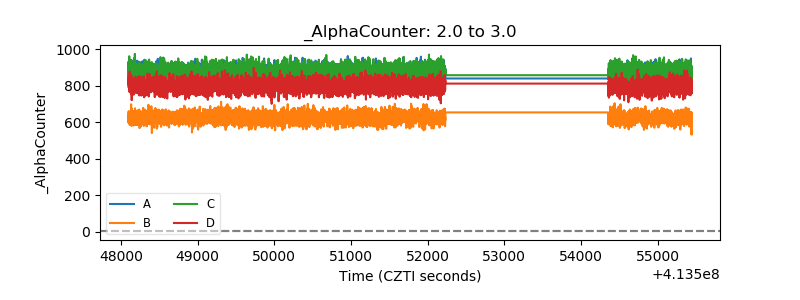 |
| _CPM_Rate | 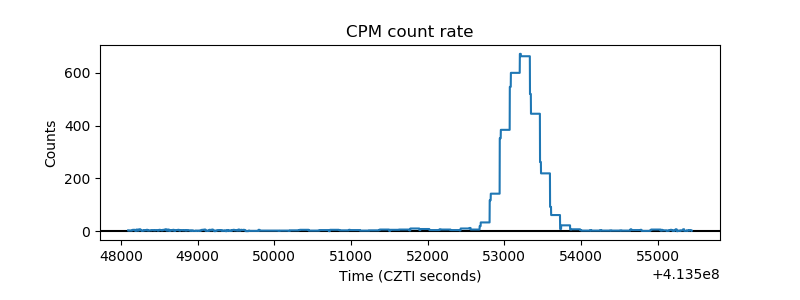 |
| CZT Counter | 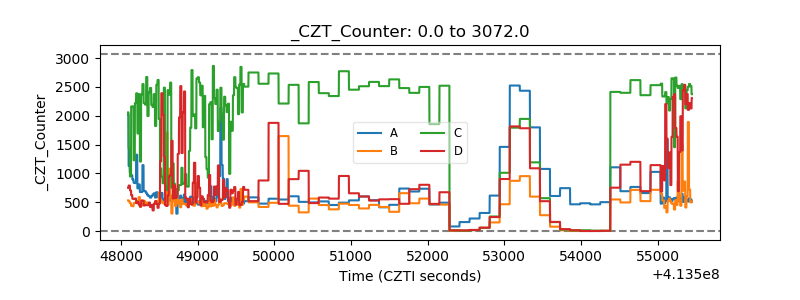 |
| +2.5 Volts monitor | 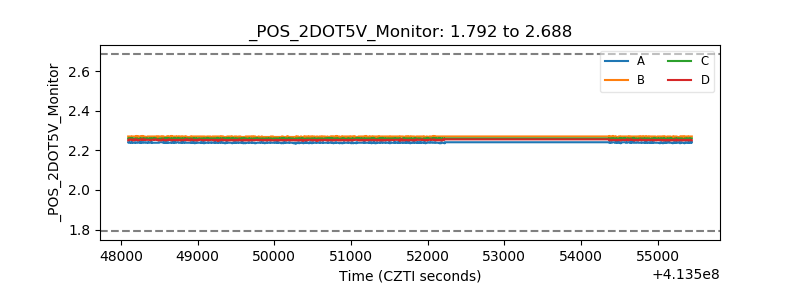 |
| +5 Volts monitor | 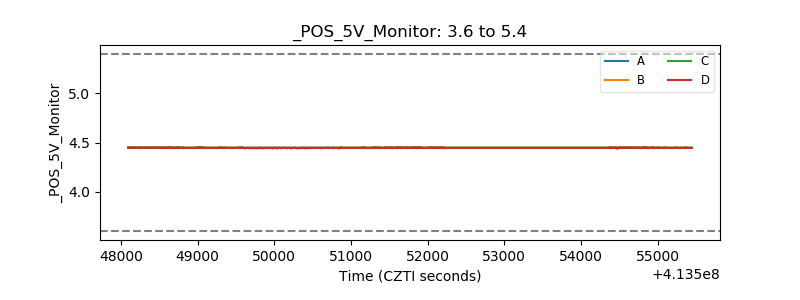 |
| _ROLL_ROT | 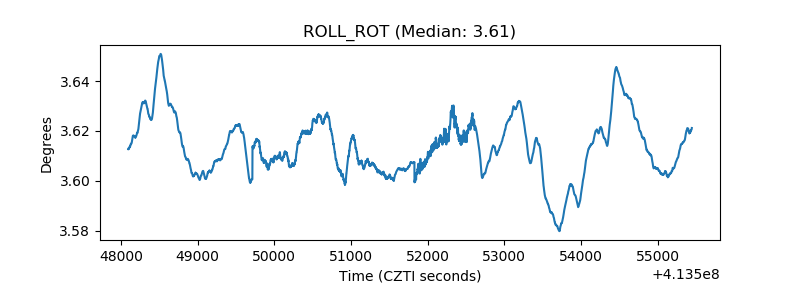 |
| _Roll_DEC | 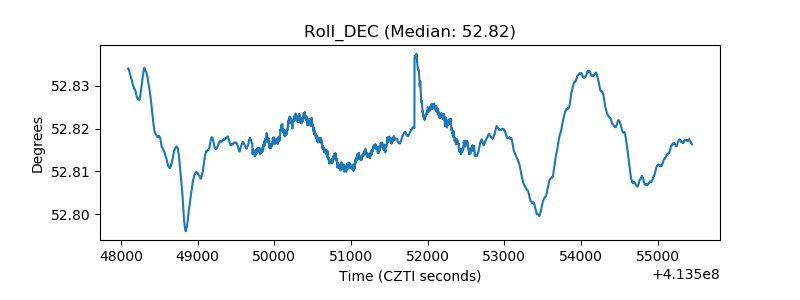 |
| _Roll_RA | 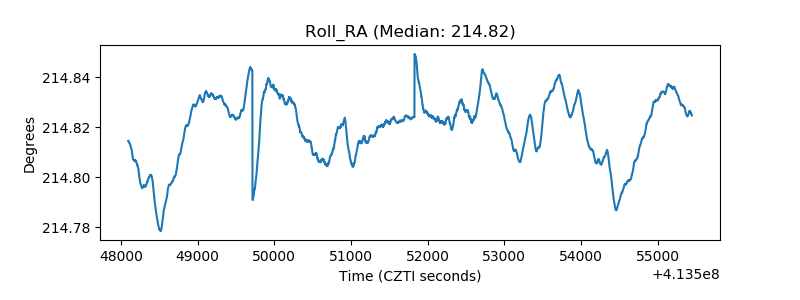 |
| Veto Counter | 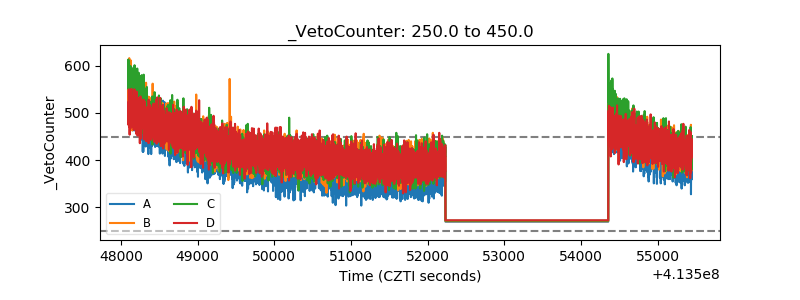 |