| Param | Original file | Final file |
|---|---|---|
| Filename | modeM0/AS1A12_022T01_9000005498_39825cztM0_level2.fits | modeM0/AS1A12_022T01_9000005498_39825cztM0_level2_quad_clean.evt |
| Size (bytes) | 637,896,960 | 72,383,040 |
| Size | 608.3 MB | 69.0 MB |
| Events in quadrant A | 3,115,303 | 627,446 |
| Events in quadrant B | 3,539,038 | 619,654 |
| Events in quadrant C | 12,466,499 | 59,820 |
| Events in quadrant D | 4,084,682 | 517,981 |
| Mode M0 | |||
|---|---|---|---|
| Quadrant | BADHDUFLAG | Total packets | Discarded packets |
| A | 0 | 12521 | 3 |
| B | 0 | 13958 | 2 |
| C | 0 | 40577 | 2 |
| D | 0 | 15784 | 2 |
| Mode M9 | |||
|---|---|---|---|
| Quadrant | BADHDUFLAG | Total packets | Discarded packets |
| A | 0 | 22 | 0 |
| B | 0 | 22 | 0 |
| C | 0 | 22 | 0 |
| D | 0 | 23 | 0 |
| Mode SS | |||
|---|---|---|---|
| Quadrant | BADHDUFLAG | Total packets | Discarded packets |
| A | 0 | 106 | 0 |
| B | 0 | 106 | 0 |
| C | 0 | 106 | 0 |
| D | 0 | 106 | 0 |
| Quadrant | Total seconds | Saturated seconds | Saturation percentage |
|---|---|---|---|
| A | 5237 | 57 | 1.088409% |
| B | 5237 | 222 | 4.239068% |
| C | 5237 | 4823 | 92.094711% |
| D | 5237 | 435 | 8.306282% |
Noise dominated data is calculated using 1-second bins in cleaned event files. If a bin has >2000 counts, and if more than 50% of those come from <1% of pixels, then it is considered to be noise-dominated and hence unusable.
| Quadrant | # 1 sec bins | Bins with >0 counts | Bins with >2000 counts | High rate bins dominated by noise | Noise dominated (total time) | Noise dominated (detector-on time) | Marked lightcurve |
|---|---|---|---|---|---|---|---|
| A | 7330 | 5238 | 43 | 43 | 0.59% | 0.82% | 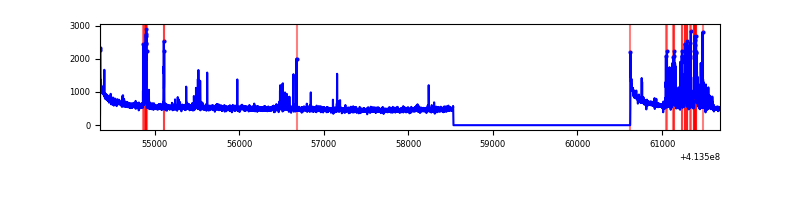 |
| B | 7330 | 5238 | 163 | 163 | 2.22% | 3.11% | 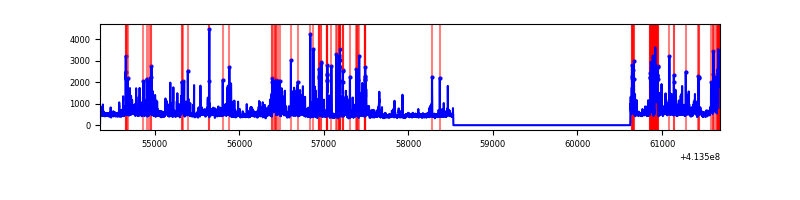 |
| C | 7330 | 5238 | 4191 | 4191 | 57.18% | 80.01% | 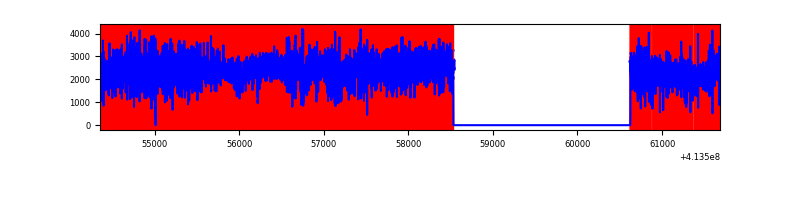 |
| D | 7330 | 5238 | 411 | 411 | 5.61% | 7.85% | 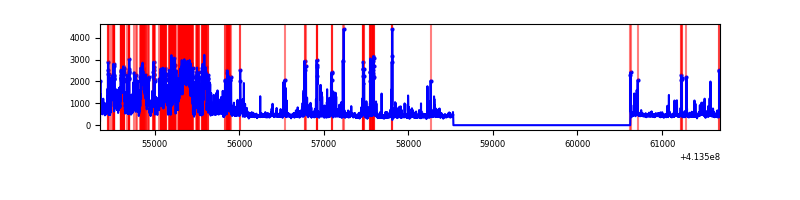 |
Top three noisy pixels from each quadrant. If the there are fewer than three noisy pixels in the level2.evt file, extra rows are filled as -1
| Pixel properties | Quadrant properties | ||||||
|---|---|---|---|---|---|---|---|
| Quadrant | DetID | PixID | Counts | Sigma | Mean | Median | Sigma |
| A | 10 | 83 | 471555 | 3920.3 | 593 | 581 | 120.1 |
| A | 13 | 248 | 244221 | 2028.01 | 593 | 581 | 120.1 |
| A | 9 | 143 | 65074 | 536.83 | 593 | 581 | 120.1 |
| B | 4 | 171 | 489611 | 4466.84 | 578 | 564 | 109.5 |
| B | 5 | 172 | 440686 | 4019.97 | 578 | 564 | 109.5 |
| B | 5 | 32 | 143445 | 1305.04 | 578 | 564 | 109.5 |
| C | 9 | 187 | 9796067 | 148992.06 | 285 | 285 | 65.7 |
| C | 15 | 208 | 1370174 | 20835.76 | 285 | 285 | 65.7 |
| C | 15 | 214 | 116747 | 1771.37 | 285 | 285 | 65.7 |
| D | 12 | 233 | 935723 | 6763.12 | 564 | 549 | 138.3 |
| D | 12 | 227 | 572503 | 4136.34 | 564 | 549 | 138.3 |
| D | 13 | 249 | 215103 | 1551.64 | 564 | 549 | 138.3 |
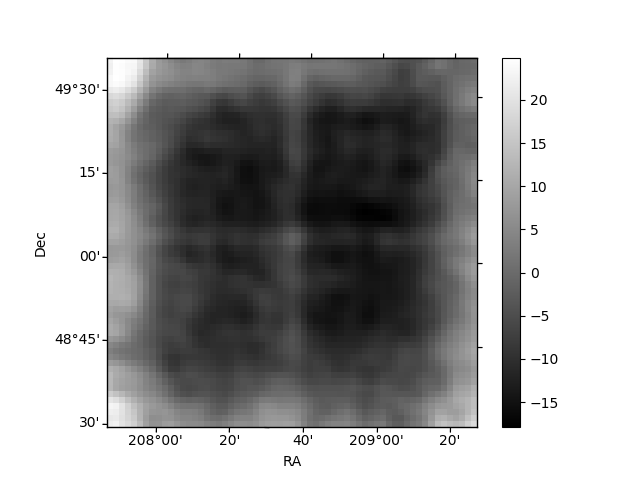
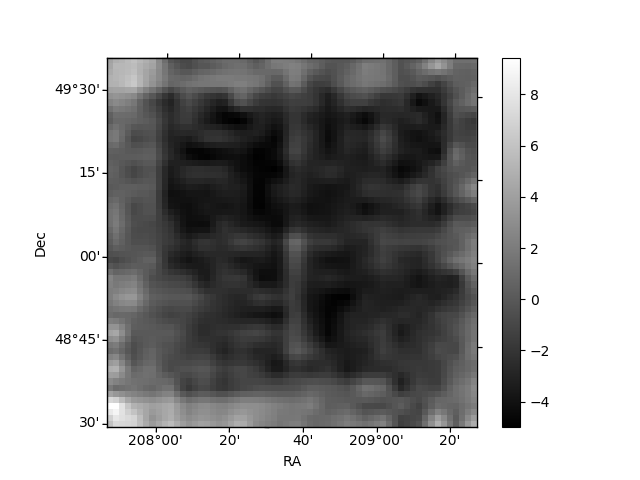
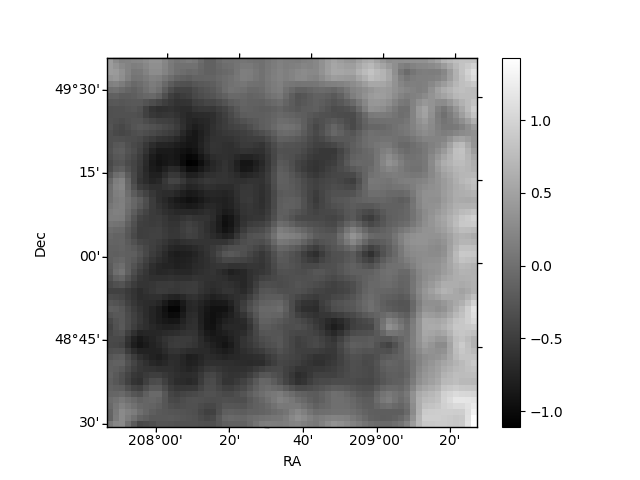
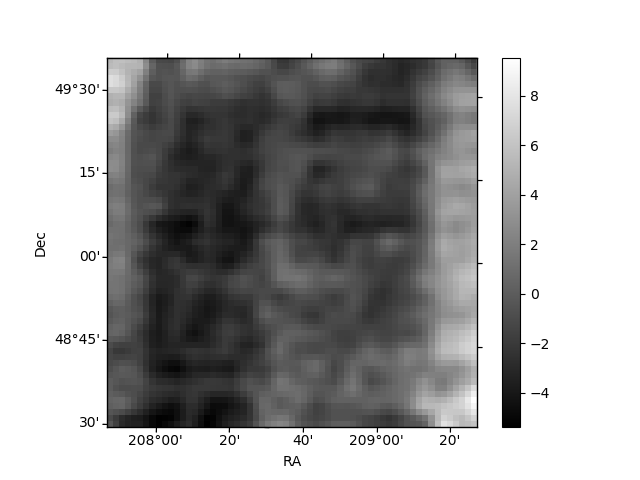
Histogram calculated using DETX and DETY for each event in the final _common_clean file
| Quadrant A | 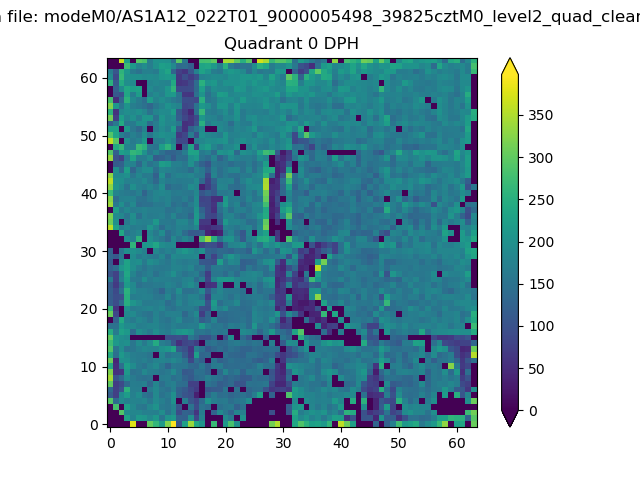 |
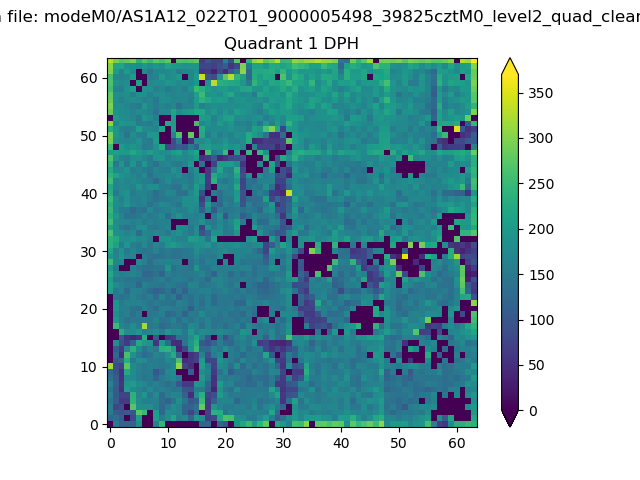 |
Quadrant B |
|---|---|---|---|
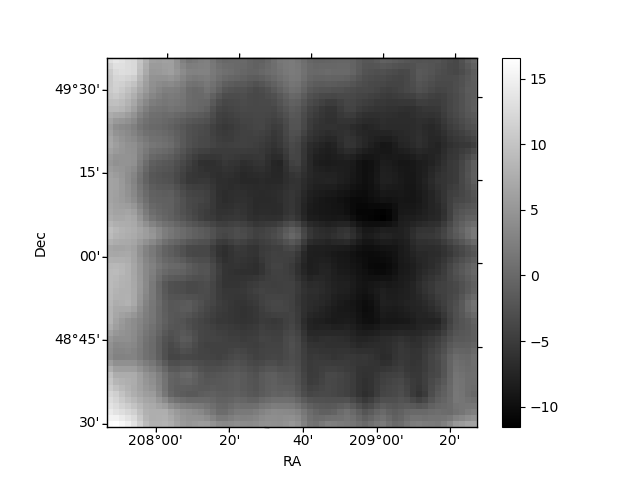
| Quadrant D | 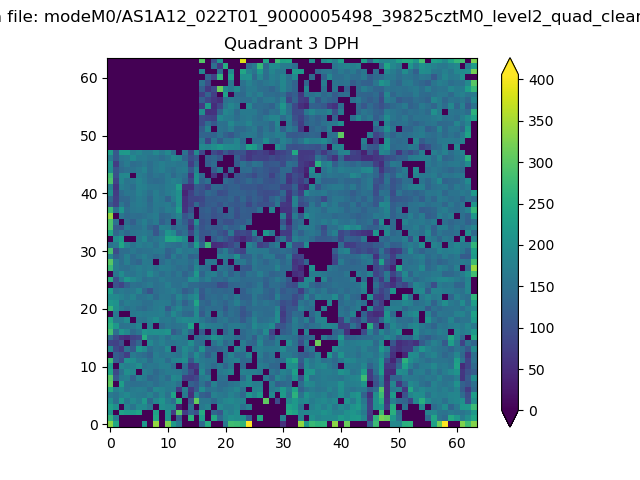 |
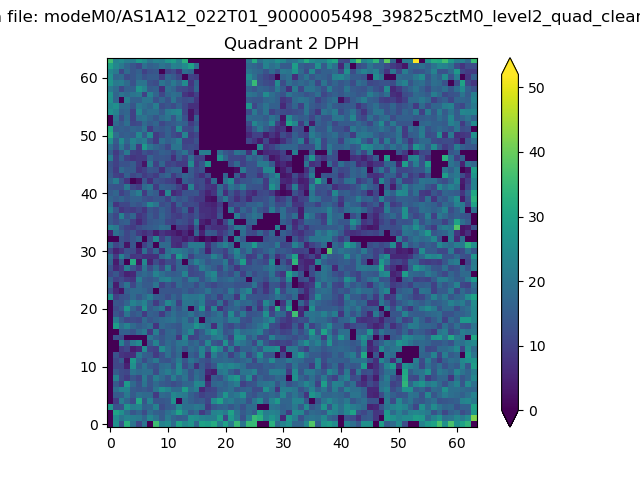 |
Quadrant C |
| Plot type | Count rate plots | Images |
|---|---|---|
| Comparison with Poisson distribution Blue bars denote a histogram of data divided into 1 sec bins. Red curve is a Poisson curve with rate = median count rate of data. |
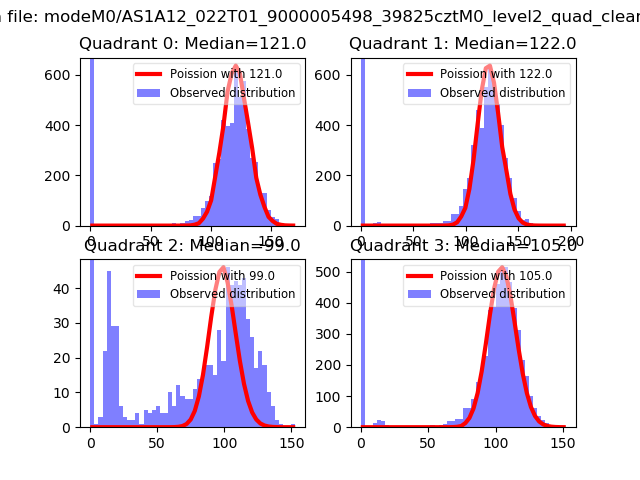 |
 |
| Quadrant-wise count rates Data is divided into 100 sec bins |
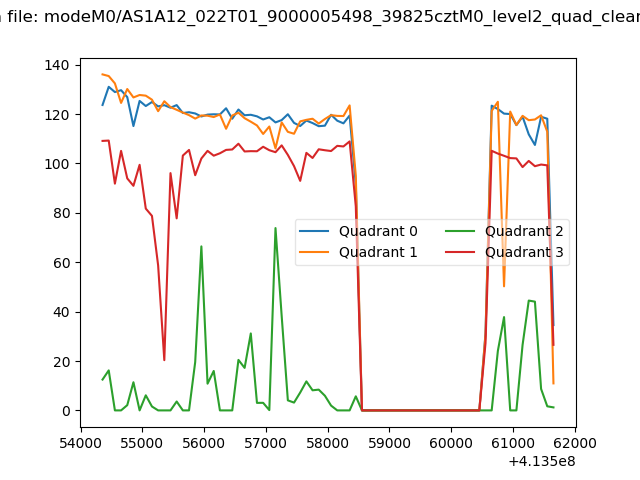 |
|
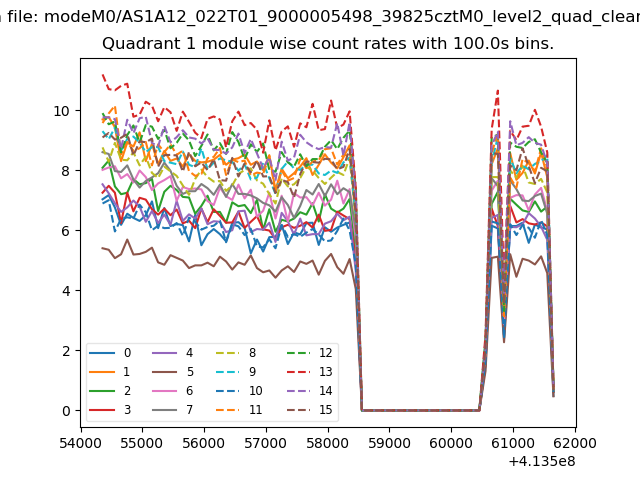
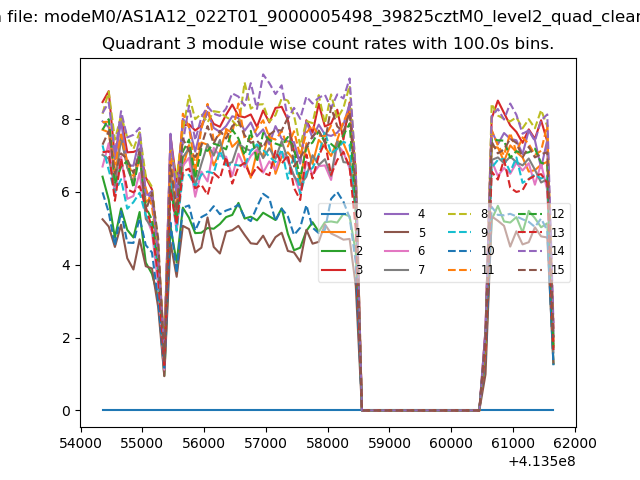
| Module-wise count rates for Quadrant A Data is divided into 100 sec bins |
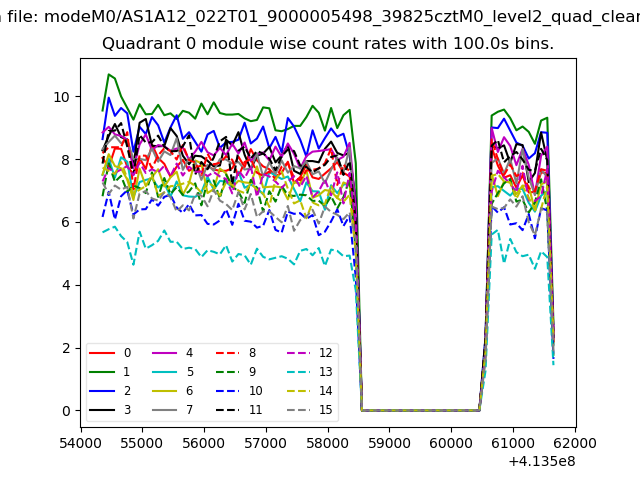 |
 |
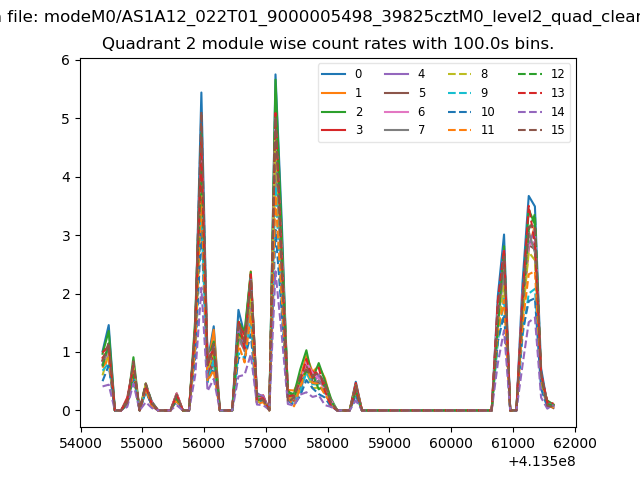
| Module-wise count rates for Quadrant B Data is divided into 100 sec bins |
 |
 |
| Module-wise count rates for Quadrant C Data is divided into 100 sec bins |
 |
 |
| Module-wise count rates for Quadrant D Data is divided into 100 sec bins |
 |
 |
| Parameter | Plot |
|---|---|
| CZT HV Monitor | 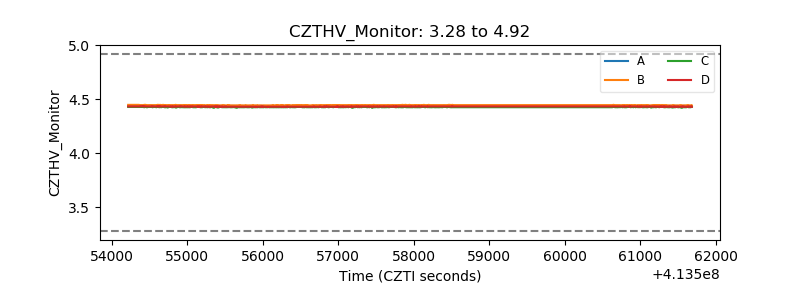 |
| D_VDD | 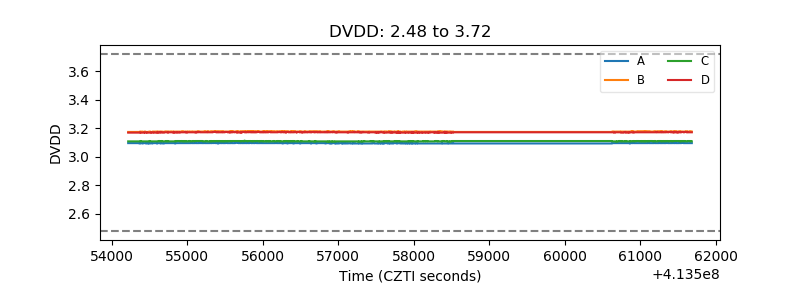 |
| Temperature 1 | 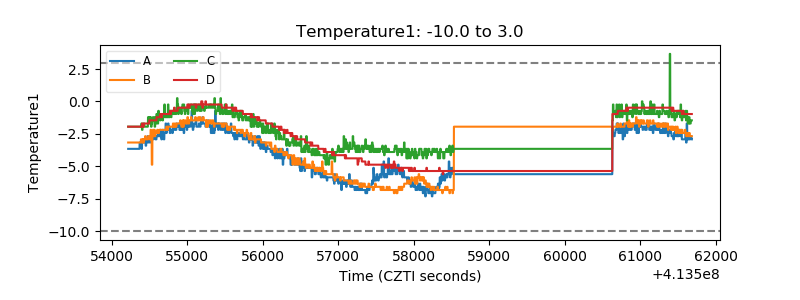 |
| Veto HV Monitor | 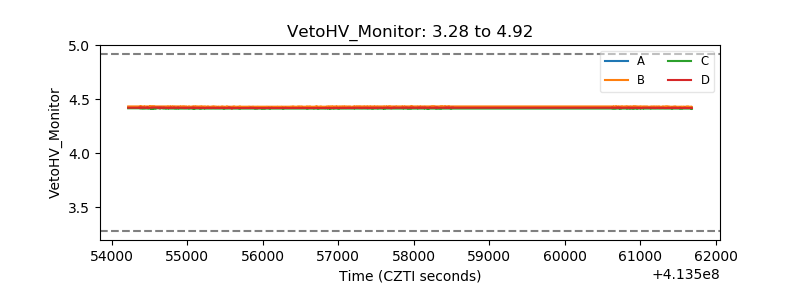 |
| Veto LLD | 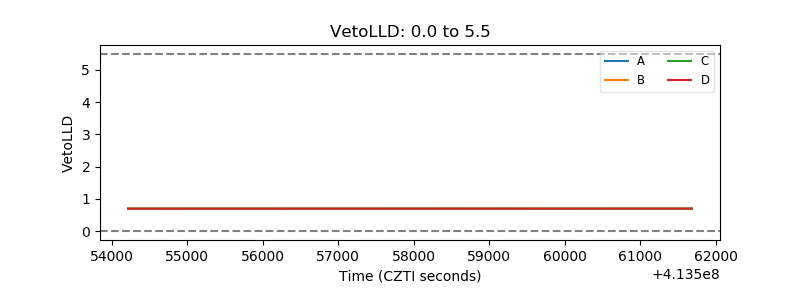 |
| Alpha Counter | 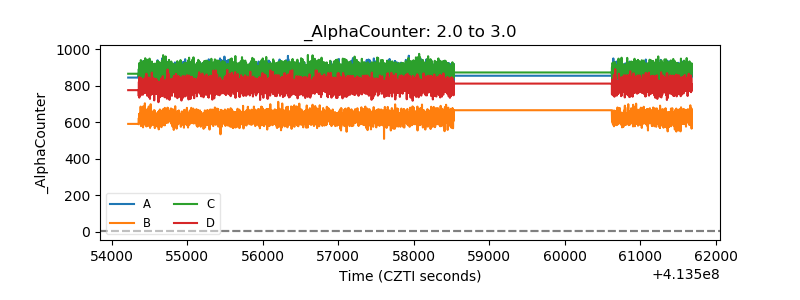 |
| _CPM_Rate | 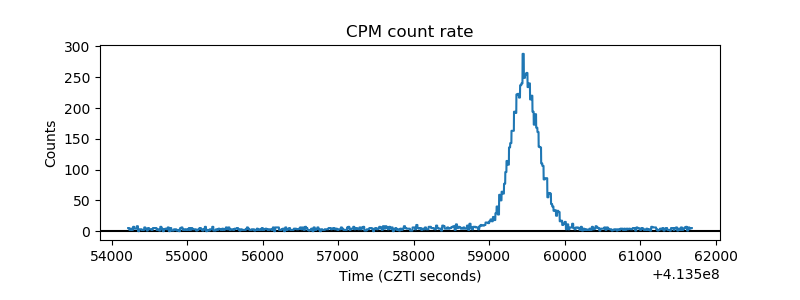 |
| CZT Counter | 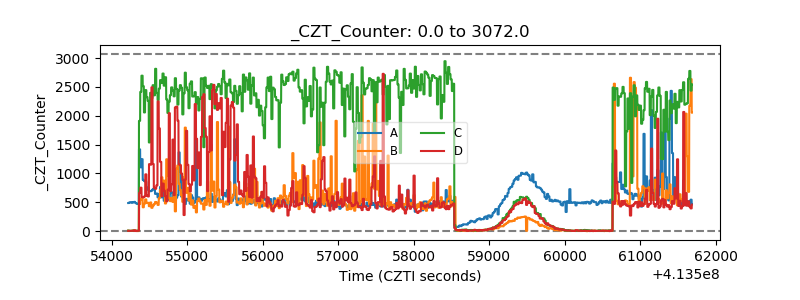 |
| +2.5 Volts monitor | 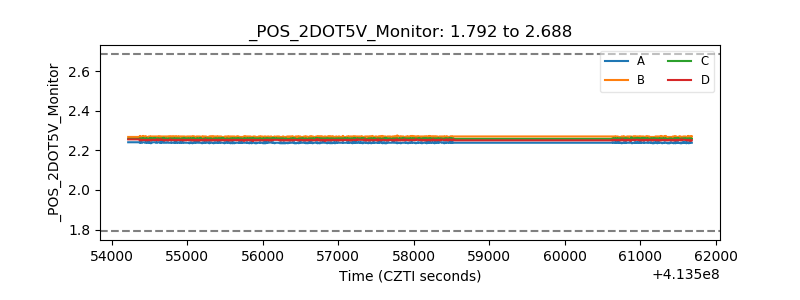 |
| +5 Volts monitor | 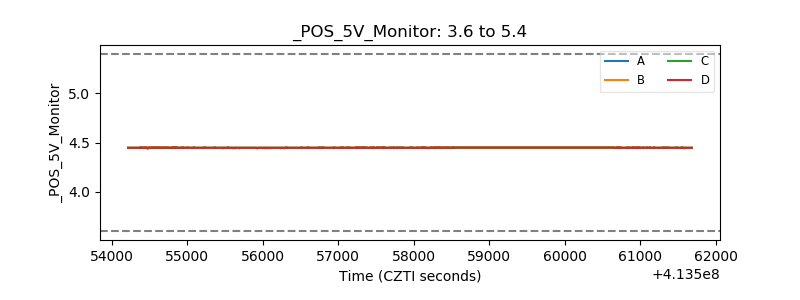 |
| _ROLL_ROT | 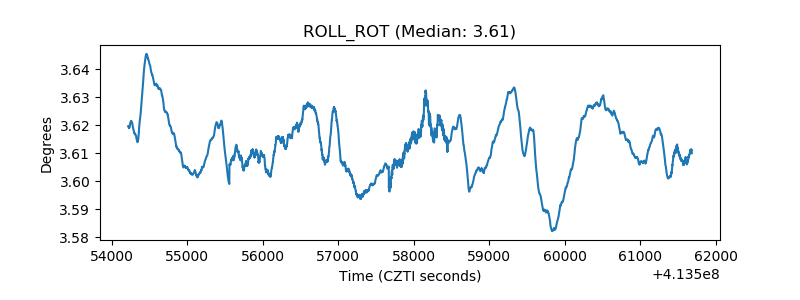 |
| _Roll_DEC | 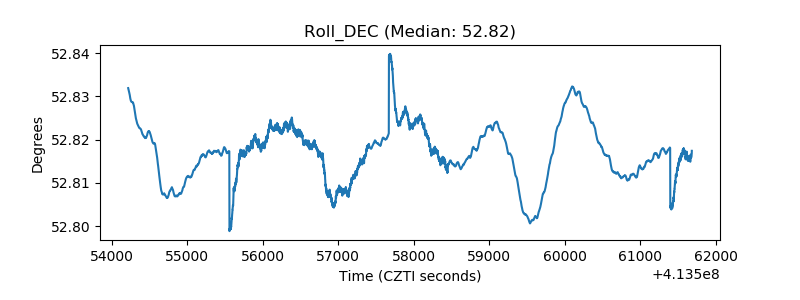 |
| _Roll_RA | 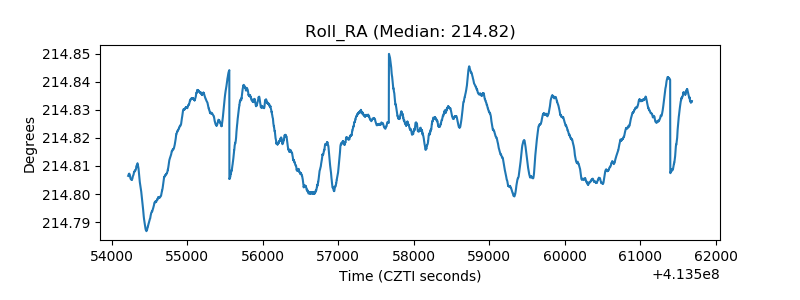 |
| Veto Counter | 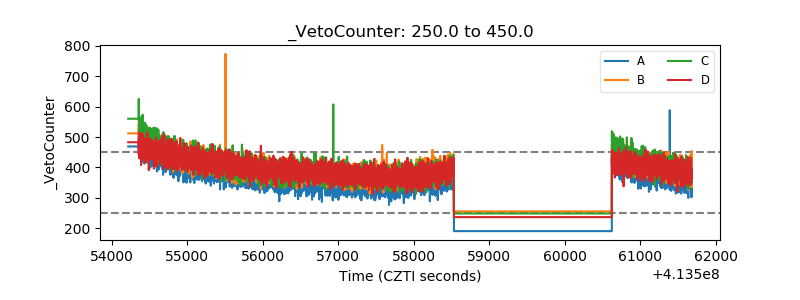 |