| Param | Original file | Final file |
|---|---|---|
| Filename | modeM0/AS1A12_022T01_9000005498_39826cztM0_level2.fits | modeM0/AS1A12_022T01_9000005498_39826cztM0_level2_quad_clean.evt |
| Size (bytes) | 607,308,480 | 73,105,920 |
| Size | 579.2 MB | 69.7 MB |
| Events in quadrant A | 3,096,704 | 607,580 |
| Events in quadrant B | 3,447,400 | 599,296 |
| Events in quadrant C | 12,384,901 | 104,780 |
| Events in quadrant D | 3,137,826 | 529,758 |
| Mode M0 | |||
|---|---|---|---|
| Quadrant | BADHDUFLAG | Total packets | Discarded packets |
| A | 0 | 12610 | 3 |
| B | 0 | 13883 | 2 |
| C | 0 | 40396 | 2 |
| D | 0 | 13071 | 2 |
| Mode M9 | |||
|---|---|---|---|
| Quadrant | BADHDUFLAG | Total packets | Discarded packets |
| A | 0 | 24 | 0 |
| B | 0 | 24 | 0 |
| C | 0 | 24 | 0 |
| D | 0 | 25 | 0 |
| Mode SS | |||
|---|---|---|---|
| Quadrant | BADHDUFLAG | Total packets | Discarded packets |
| A | 0 | 108 | 0 |
| B | 0 | 108 | 0 |
| C | 0 | 108 | 0 |
| D | 0 | 108 | 0 |
| Quadrant | Total seconds | Saturated seconds | Saturation percentage |
|---|---|---|---|
| A | 5314 | 82 | 1.543094% |
| B | 5314 | 219 | 4.121189% |
| C | 5314 | 4566 | 85.923974% |
| D | 5314 | 135 | 2.540459% |
Noise dominated data is calculated using 1-second bins in cleaned event files. If a bin has >2000 counts, and if more than 50% of those come from <1% of pixels, then it is considered to be noise-dominated and hence unusable.
| Quadrant | # 1 sec bins | Bins with >0 counts | Bins with >2000 counts | High rate bins dominated by noise | Noise dominated (total time) | Noise dominated (detector-on time) | Marked lightcurve |
|---|---|---|---|---|---|---|---|
| A | 7196 | 5315 | 59 | 59 | 0.82% | 1.11% | 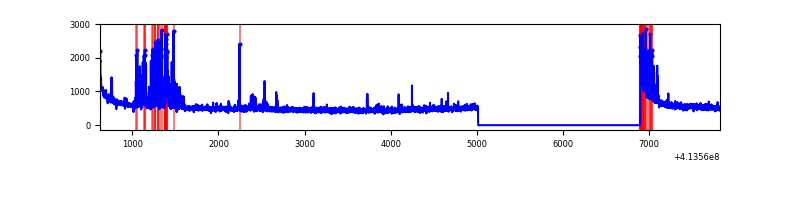 |
| B | 7196 | 5315 | 167 | 167 | 2.32% | 3.14% | 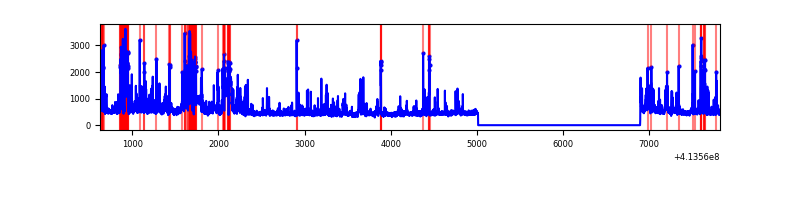 |
| C | 7196 | 5315 | 4148 | 4148 | 57.64% | 78.04% | 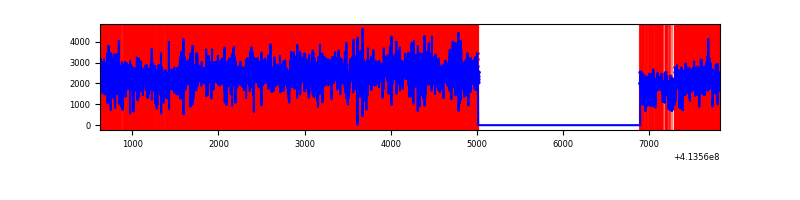 |
| D | 7196 | 5315 | 108 | 108 | 1.50% | 2.03% | 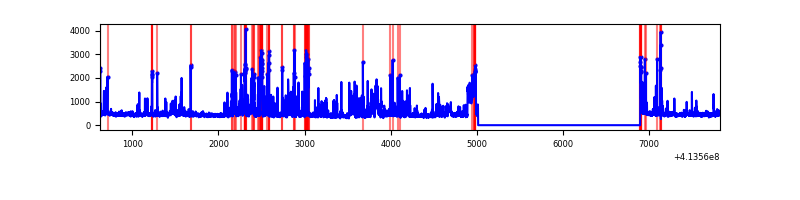 |
Top three noisy pixels from each quadrant. If the there are fewer than three noisy pixels in the level2.evt file, extra rows are filled as -1
| Pixel properties | Quadrant properties | ||||||
|---|---|---|---|---|---|---|---|
| Quadrant | DetID | PixID | Counts | Sigma | Mean | Median | Sigma |
| A | 10 | 83 | 475113 | 4026.94 | 582 | 572 | 117.8 |
| A | 13 | 248 | 320415 | 2714.18 | 582 | 572 | 117.8 |
| A | 15 | 254 | 13033 | 105.74 | 582 | 572 | 117.8 |
| B | 4 | 171 | 716443 | 6492.34 | 571 | 555 | 110.3 |
| B | 5 | 32 | 159402 | 1440.57 | 571 | 555 | 110.3 |
| B | 5 | 172 | 114440 | 1032.81 | 571 | 555 | 110.3 |
| C | 9 | 187 | 8091664 | 104581.07 | 333 | 334 | 77.4 |
| C | 15 | 208 | 2805447 | 36256.3 | 333 | 334 | 77.4 |
| C | 15 | 214 | 138764 | 1789.22 | 333 | 334 | 77.4 |
| D | 12 | 227 | 293056 | 2092.18 | 565 | 546 | 139.8 |
| D | 13 | 249 | 255732 | 1825.22 | 565 | 546 | 139.8 |
| D | 2 | 153 | 243692 | 1739.1 | 565 | 546 | 139.8 |
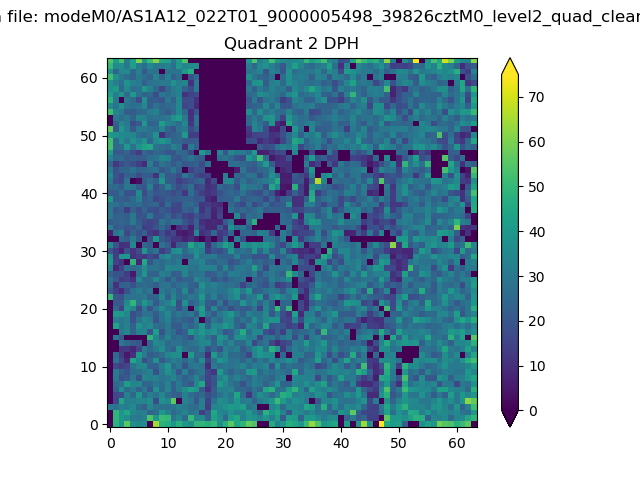
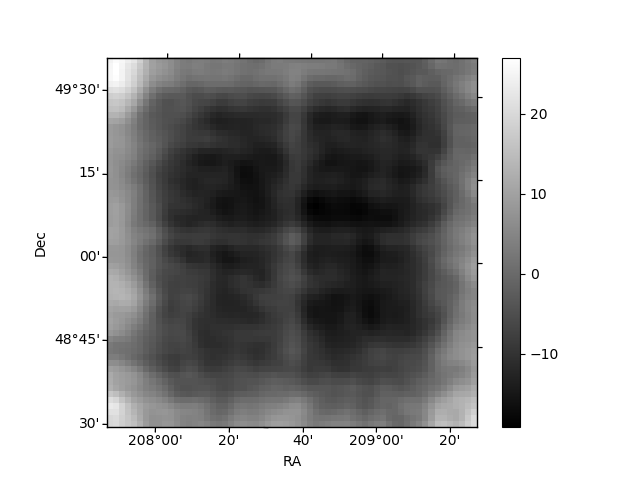
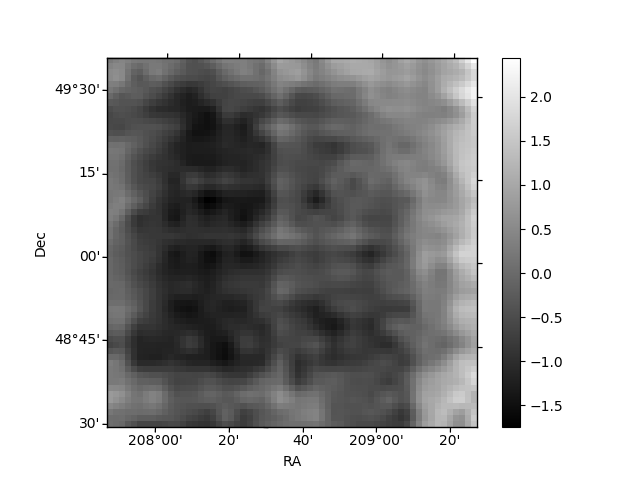
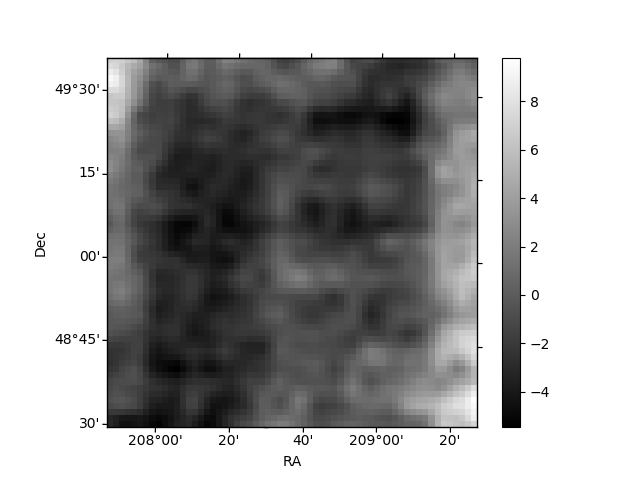
Histogram calculated using DETX and DETY for each event in the final _common_clean file
| Quadrant A | 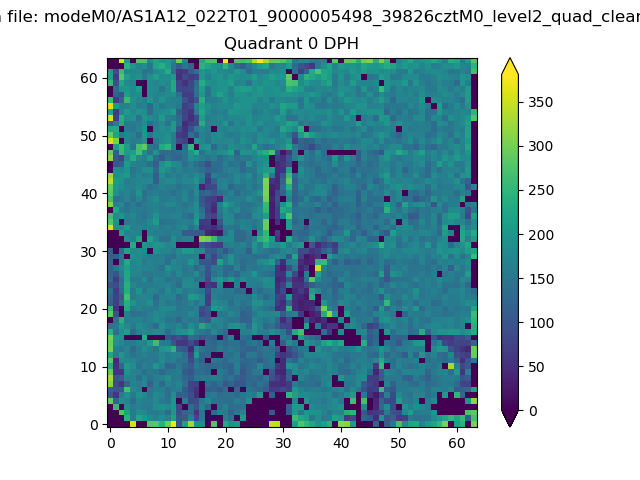 |
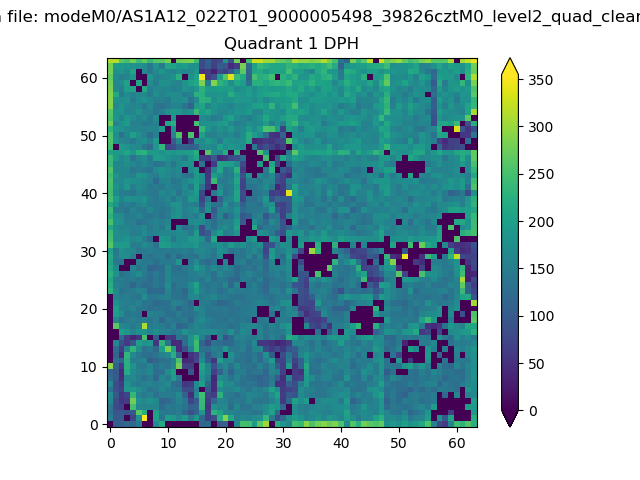 |
Quadrant B |
|---|---|---|---|
| Quadrant D | 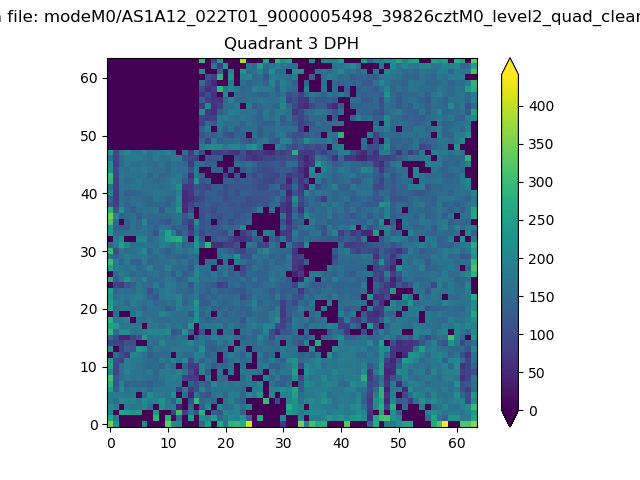 |
 |
Quadrant C |
| Plot type | Count rate plots | Images |
|---|---|---|
| Comparison with Poisson distribution Blue bars denote a histogram of data divided into 1 sec bins. Red curve is a Poisson curve with rate = median count rate of data. |
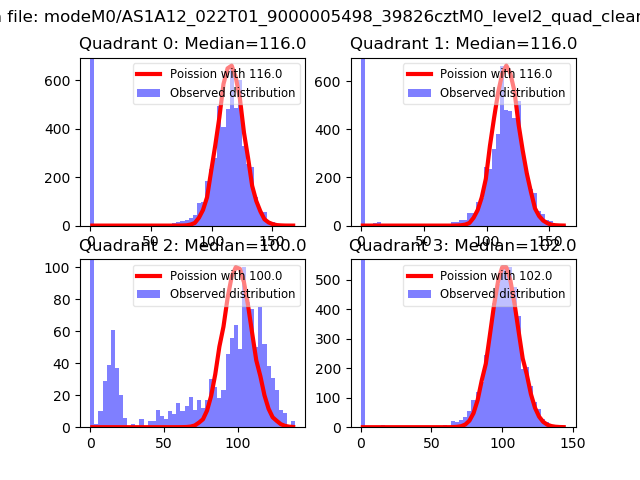 |
 |
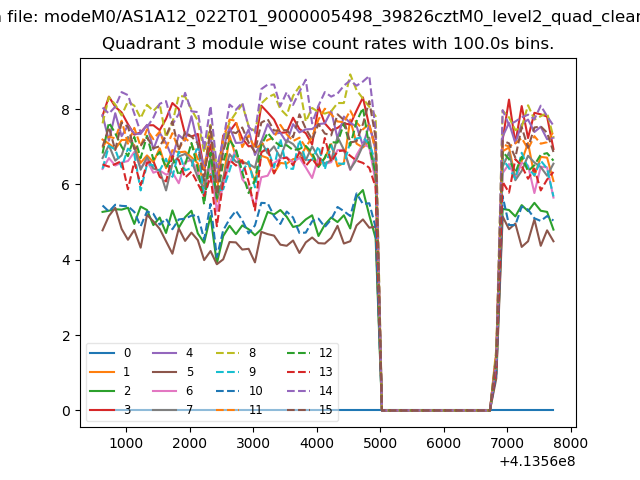
| Quadrant-wise count rates Data is divided into 100 sec bins |
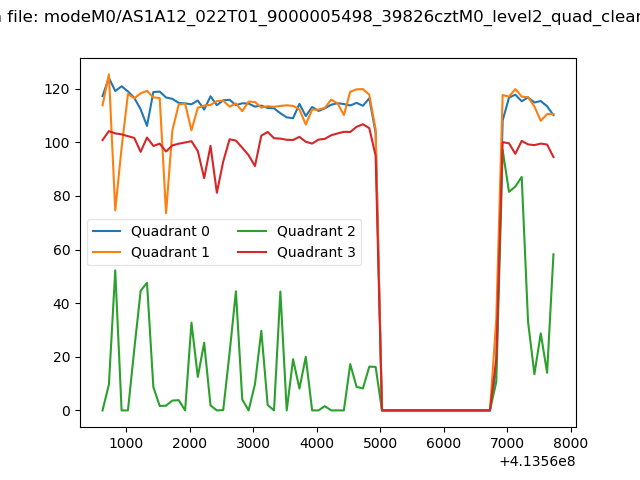 |
|
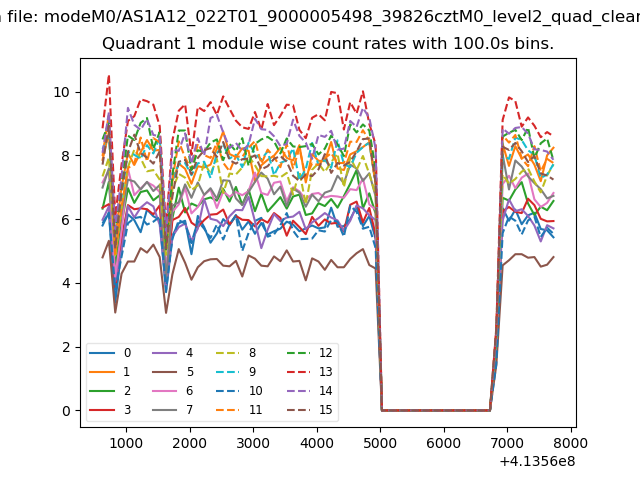
| Module-wise count rates for Quadrant A Data is divided into 100 sec bins |
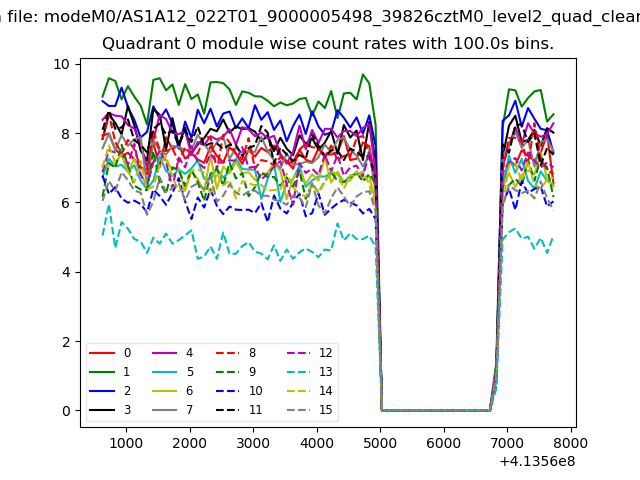 |
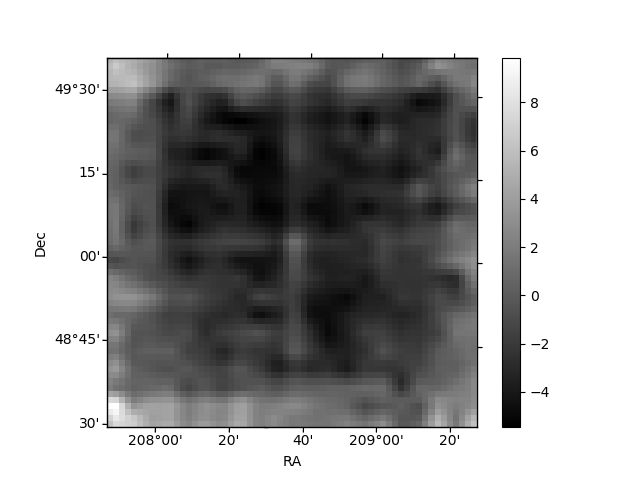 |
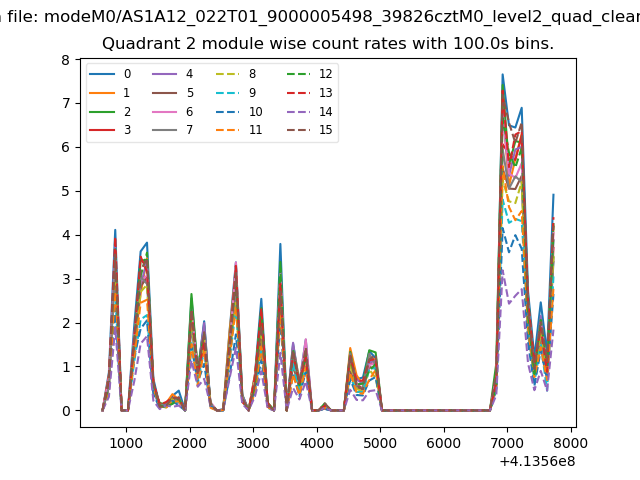
| Module-wise count rates for Quadrant B Data is divided into 100 sec bins |
 |
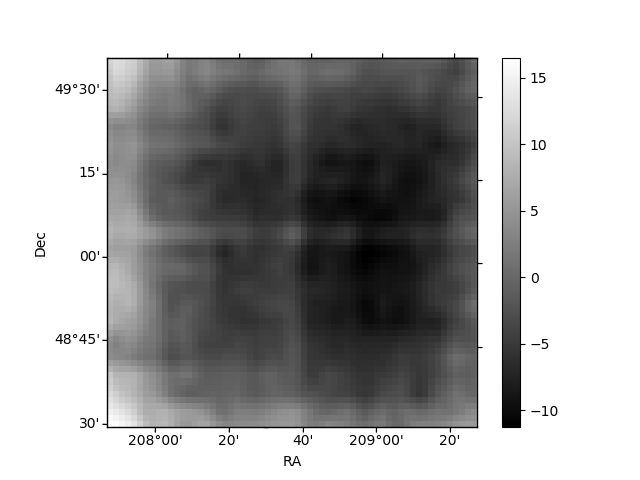 |
| Module-wise count rates for Quadrant C Data is divided into 100 sec bins |
 |
 |
| Module-wise count rates for Quadrant D Data is divided into 100 sec bins |
 |
 |
| Parameter | Plot |
|---|---|
| CZT HV Monitor | 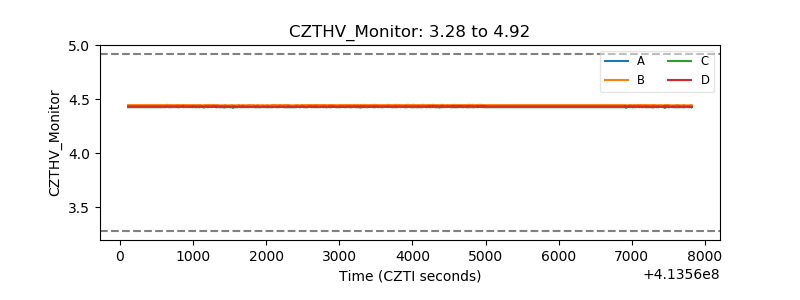 |
| D_VDD | 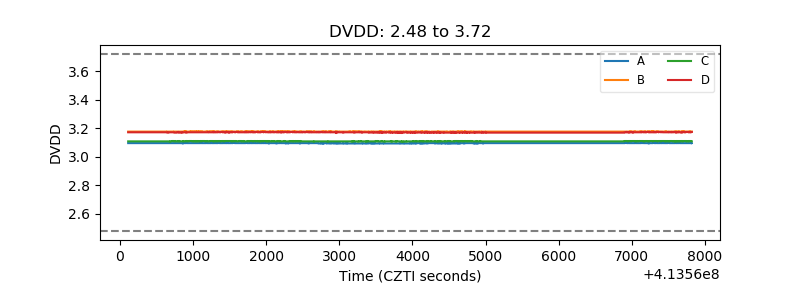 |
| Temperature 1 | 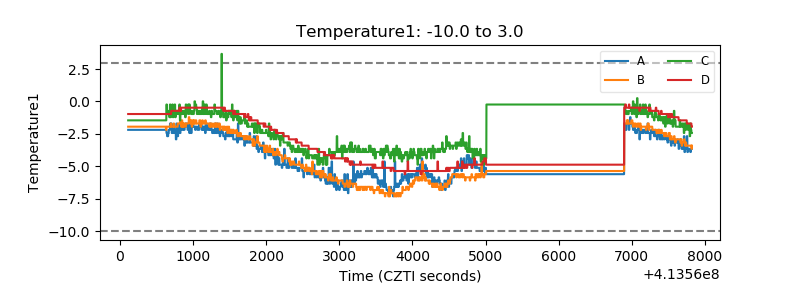 |
| Veto HV Monitor | 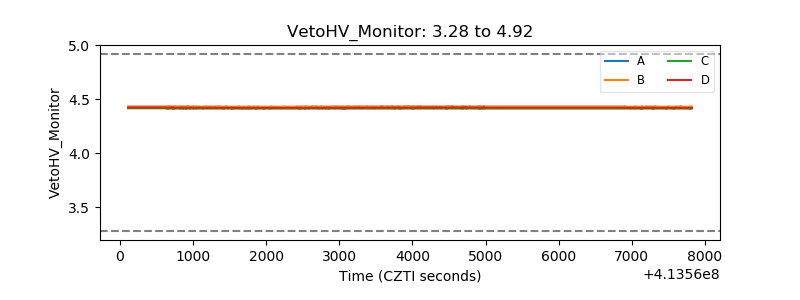 |
| Veto LLD | 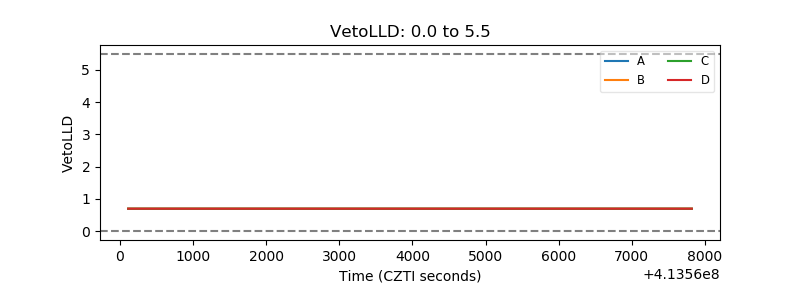 |
| Alpha Counter | 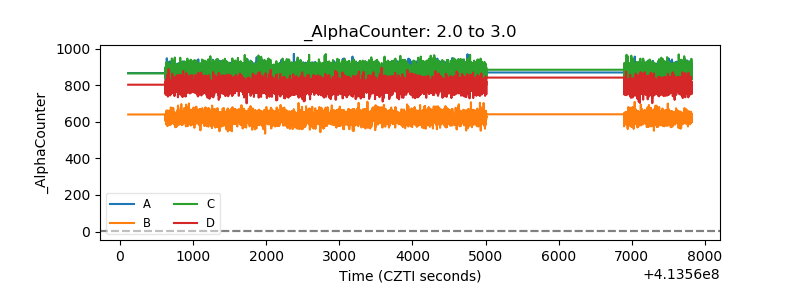 |
| _CPM_Rate | 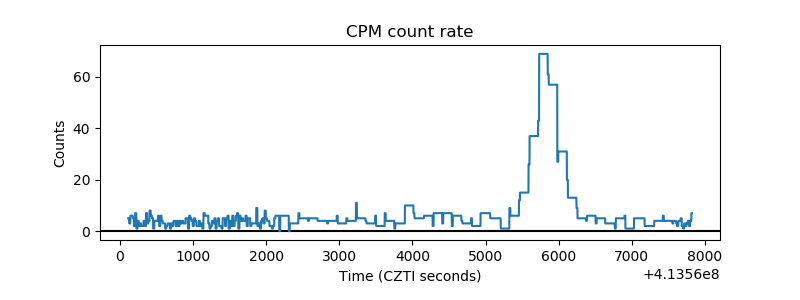 |
| CZT Counter | 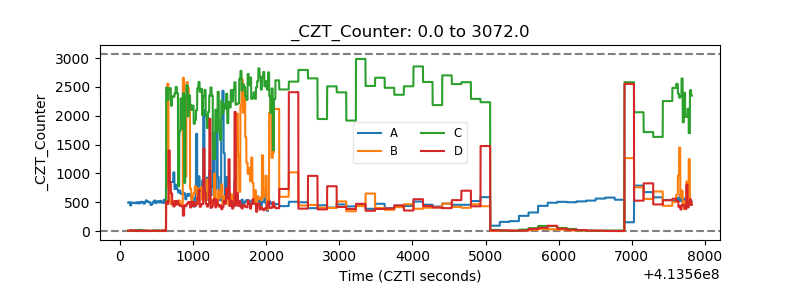 |
| +2.5 Volts monitor | 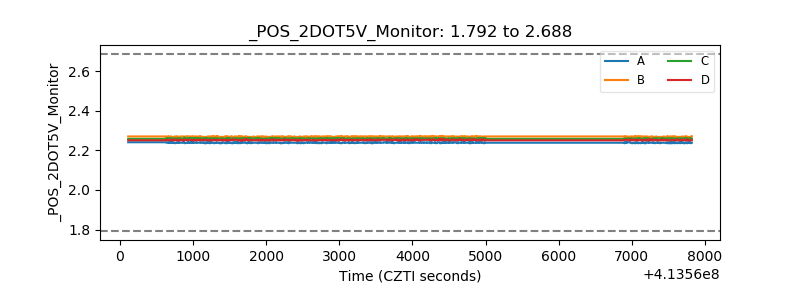 |
| +5 Volts monitor | 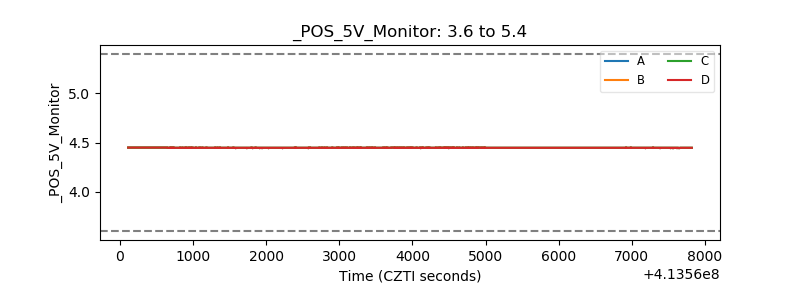 |
| _ROLL_ROT | 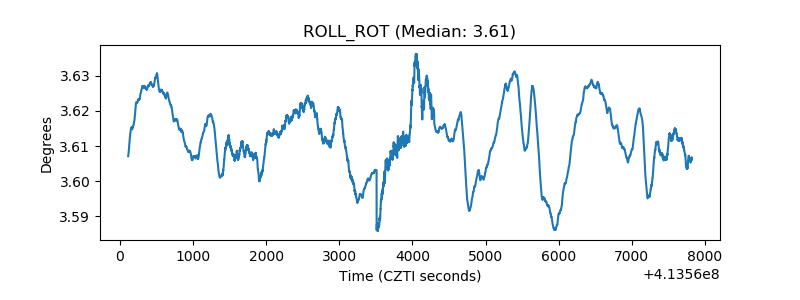 |
| _Roll_DEC | 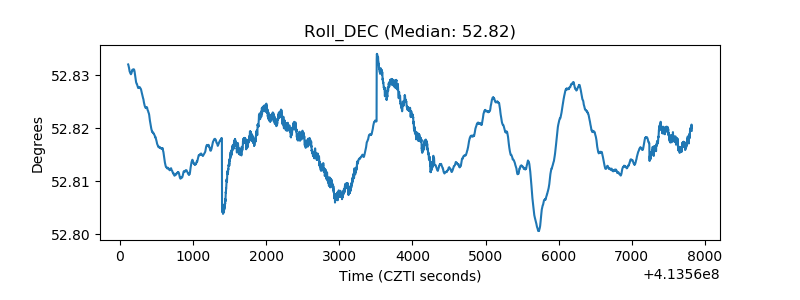 |
| _Roll_RA | 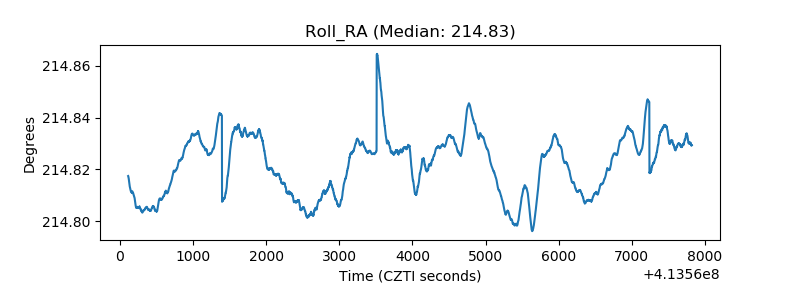 |
| Veto Counter | 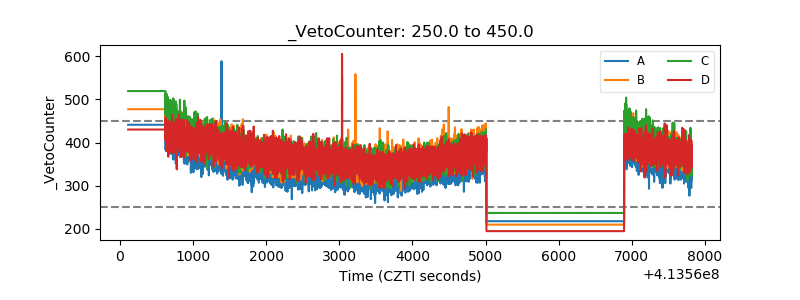 |