| Param | Original file | Final file |
|---|---|---|
| Filename | modeM0/AS1A12_022T01_9000005498_39827cztM0_level2.fits | modeM0/AS1A12_022T01_9000005498_39827cztM0_level2_quad_clean.evt |
| Size (bytes) | 627,108,480 | 76,556,160 |
| Size | 598.1 MB | 73.0 MB |
| Events in quadrant A | 3,542,652 | 618,928 |
| Events in quadrant B | 3,379,017 | 615,309 |
| Events in quadrant C | 12,709,245 | 148,619 |
| Events in quadrant D | 3,149,809 | 546,092 |
| Mode M0 | |||
|---|---|---|---|
| Quadrant | BADHDUFLAG | Total packets | Discarded packets |
| A | 0 | 14062 | 3 |
| B | 0 | 13877 | 2 |
| C | 0 | 41564 | 2 |
| D | 0 | 13447 | 2 |
| Mode M9 | |||
|---|---|---|---|
| Quadrant | BADHDUFLAG | Total packets | Discarded packets |
| A | 0 | 25 | 0 |
| B | 0 | 25 | 0 |
| C | 0 | 25 | 0 |
| D | 0 | 26 | 0 |
| Mode SS | |||
|---|---|---|---|
| Quadrant | BADHDUFLAG | Total packets | Discarded packets |
| A | 0 | 112 | 0 |
| B | 0 | 112 | 0 |
| C | 0 | 112 | 0 |
| D | 0 | 112 | 0 |
| Quadrant | Total seconds | Saturated seconds | Saturation percentage |
|---|---|---|---|
| A | 5563 | 85 | 1.527953% |
| B | 5563 | 176 | 3.163761% |
| C | 5563 | 4457 | 80.118641% |
| D | 5563 | 150 | 2.696387% |
Noise dominated data is calculated using 1-second bins in cleaned event files. If a bin has >2000 counts, and if more than 50% of those come from <1% of pixels, then it is considered to be noise-dominated and hence unusable.
| Quadrant | # 1 sec bins | Bins with >0 counts | Bins with >2000 counts | High rate bins dominated by noise | Noise dominated (total time) | Noise dominated (detector-on time) | Marked lightcurve |
|---|---|---|---|---|---|---|---|
| A | 7116 | 5564 | 73 | 73 | 1.03% | 1.31% | 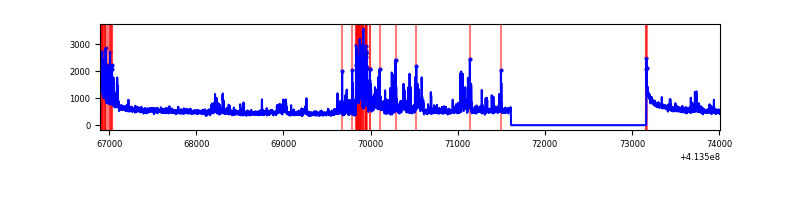 |
| B | 7116 | 5564 | 107 | 107 | 1.50% | 1.92% | 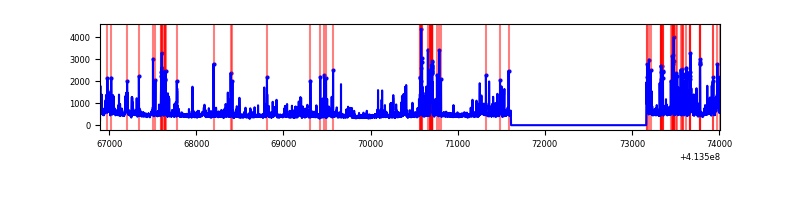 |
| C | 7116 | 5564 | 4145 | 4145 | 58.25% | 74.50% | 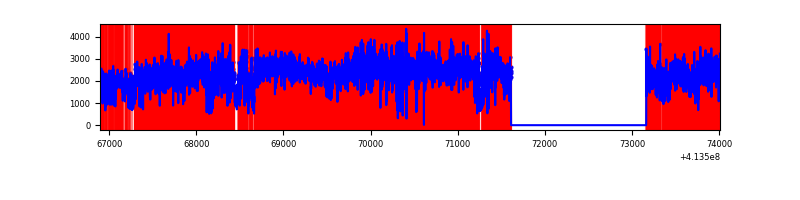 |
| D | 7116 | 5564 | 123 | 123 | 1.73% | 2.21% | 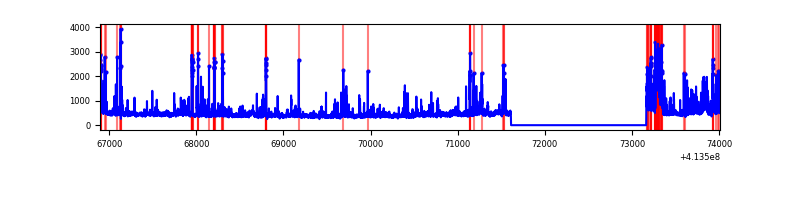 |
Top three noisy pixels from each quadrant. If the there are fewer than three noisy pixels in the level2.evt file, extra rows are filled as -1
| Pixel properties | Quadrant properties | ||||||
|---|---|---|---|---|---|---|---|
| Quadrant | DetID | PixID | Counts | Sigma | Mean | Median | Sigma |
| A | 14 | 235 | 558405 | 4577.5 | 601 | 590 | 121.9 |
| A | 10 | 83 | 486608 | 3988.32 | 601 | 590 | 121.9 |
| A | 13 | 248 | 116080 | 947.73 | 601 | 590 | 121.9 |
| B | 4 | 171 | 317264 | 2774.34 | 592 | 577 | 114.1 |
| B | 5 | 172 | 238310 | 2082.66 | 592 | 577 | 114.1 |
| B | 0 | 229 | 178594 | 1559.52 | 592 | 577 | 114.1 |
| C | 9 | 187 | 9547830 | 113473.6 | 359 | 362 | 84.1 |
| C | 15 | 208 | 1439673 | 17106.5 | 359 | 362 | 84.1 |
| C | 15 | 214 | 150518 | 1784.63 | 359 | 362 | 84.1 |
| D | 2 | 249 | 336438 | 2327.56 | 584 | 566 | 144.3 |
| D | 12 | 227 | 269390 | 1862.92 | 584 | 566 | 144.3 |
| D | 13 | 249 | 108267 | 746.36 | 584 | 566 | 144.3 |
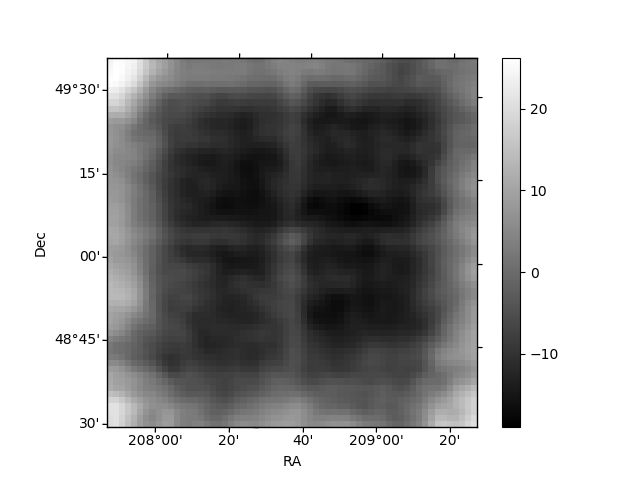
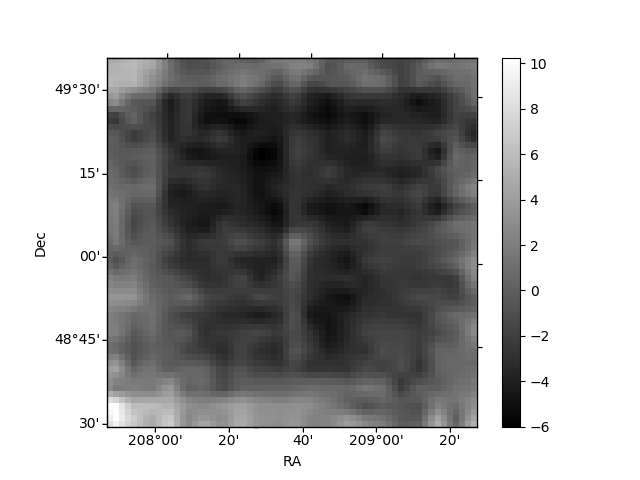
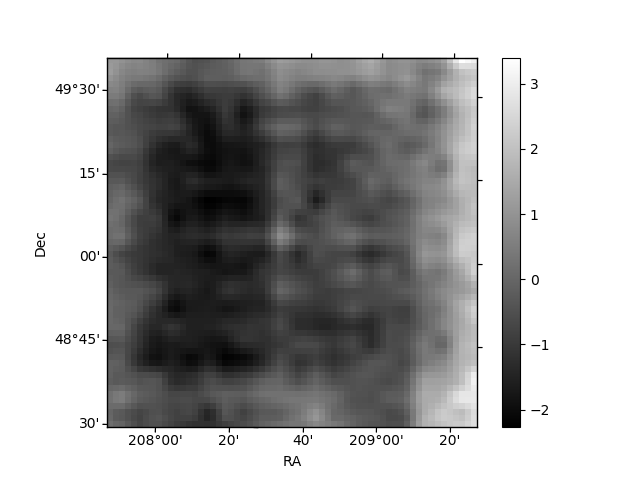
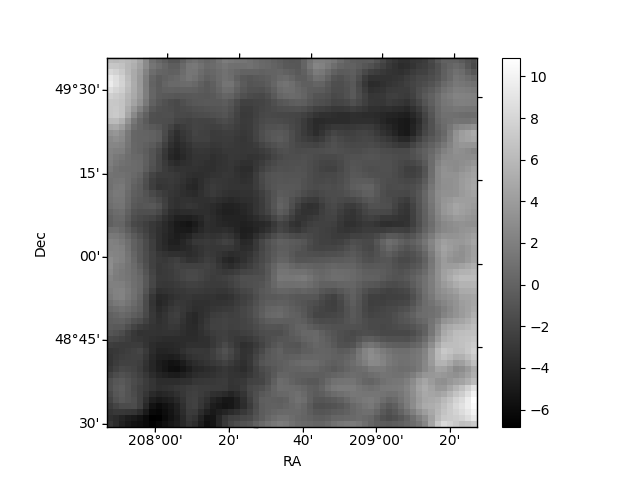
Histogram calculated using DETX and DETY for each event in the final _common_clean file
| Quadrant A | 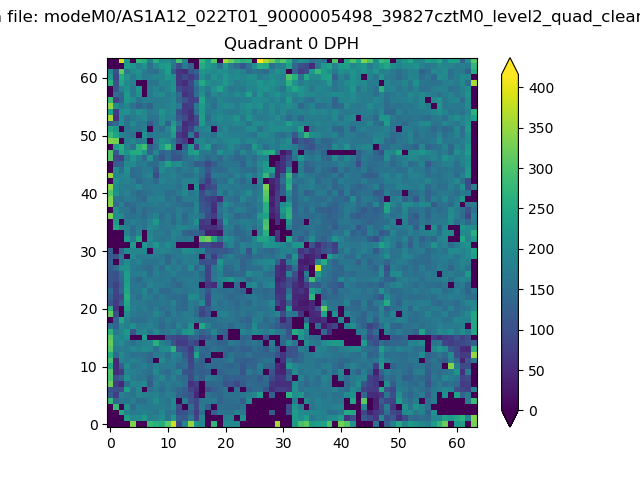 |
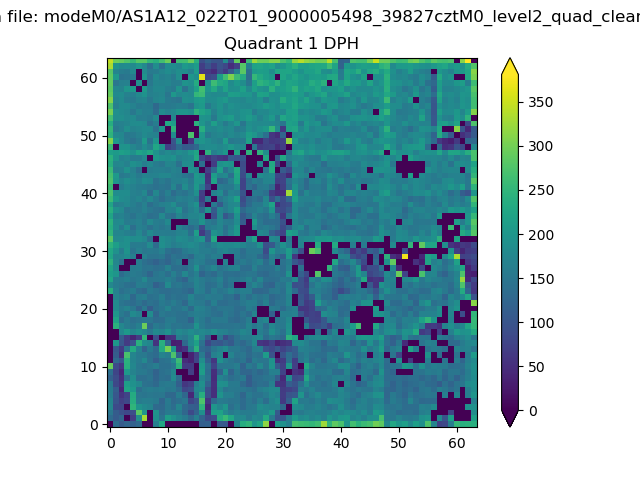 |
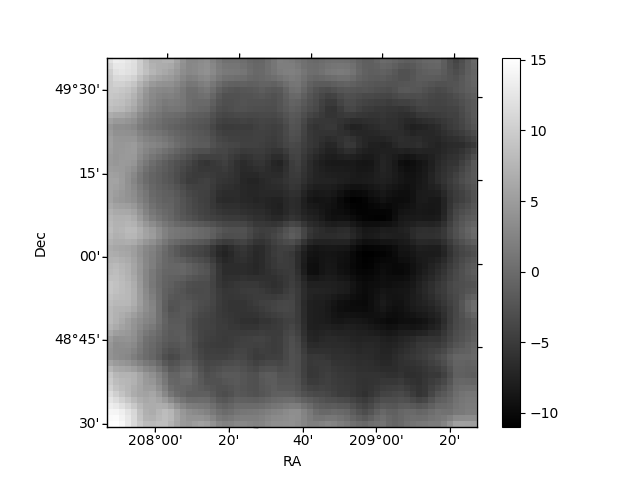
Quadrant B |
|---|---|---|---|
| Quadrant D | 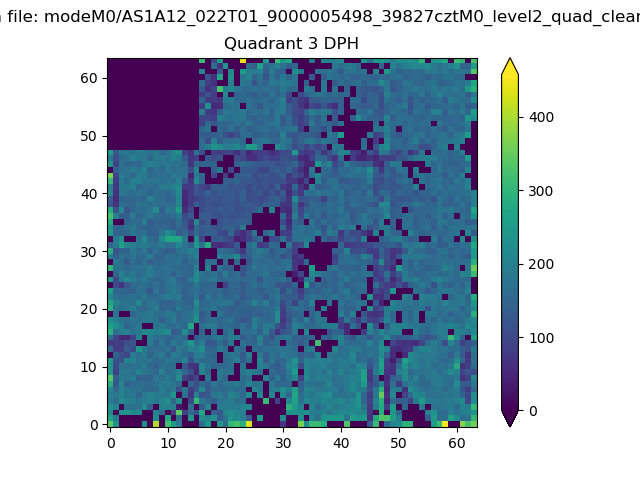 |
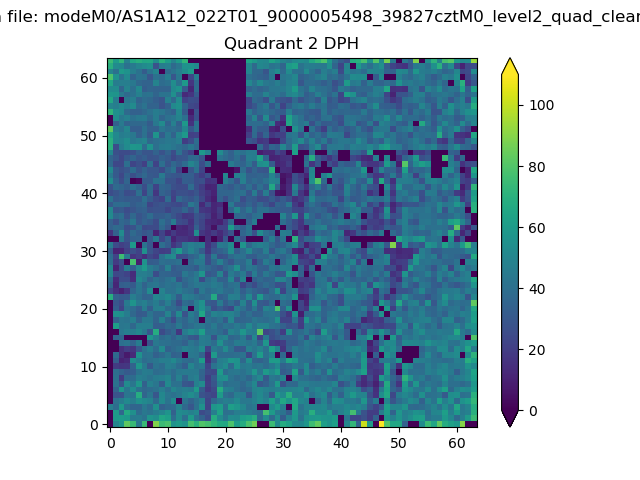 |
Quadrant C |
| Plot type | Count rate plots | Images |
|---|---|---|
| Comparison with Poisson distribution Blue bars denote a histogram of data divided into 1 sec bins. Red curve is a Poisson curve with rate = median count rate of data. |
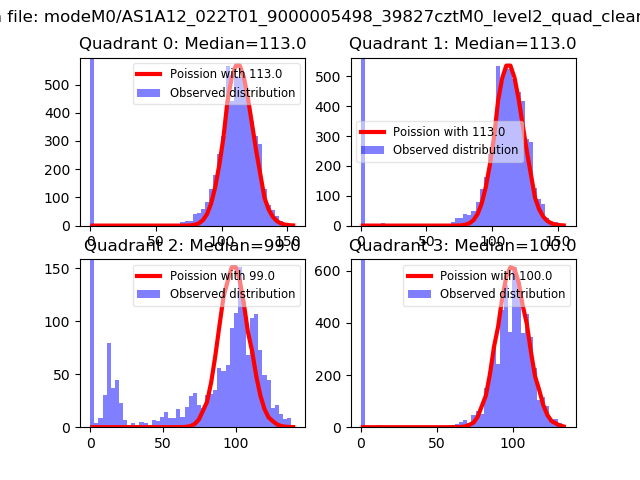 |
 |
| Quadrant-wise count rates Data is divided into 100 sec bins |
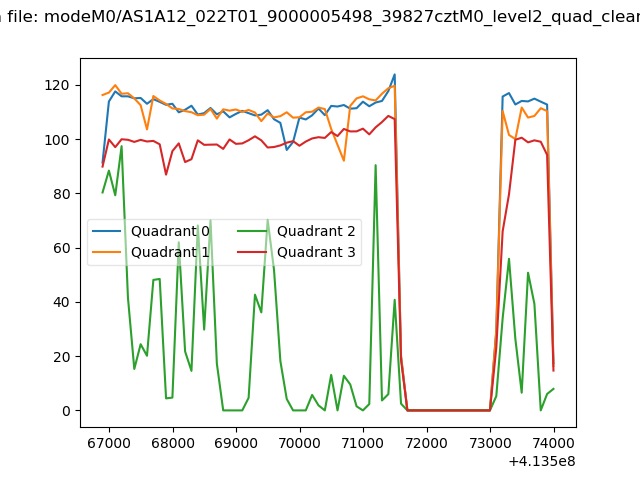 |
|
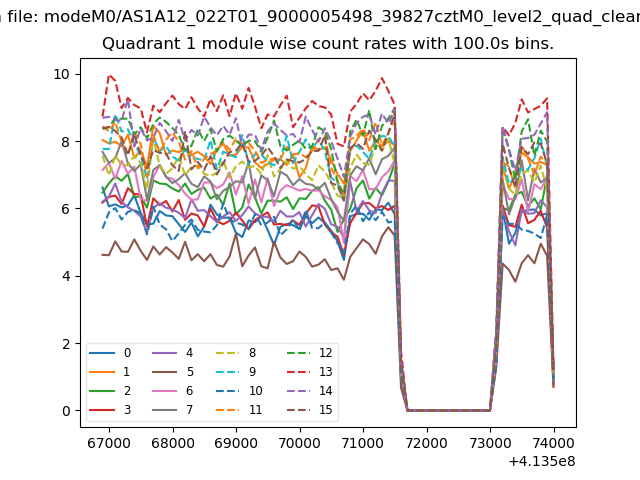
| Module-wise count rates for Quadrant A Data is divided into 100 sec bins |
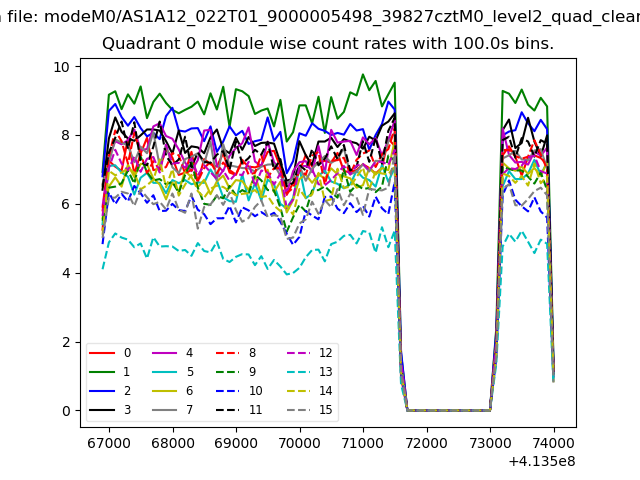 |
 |
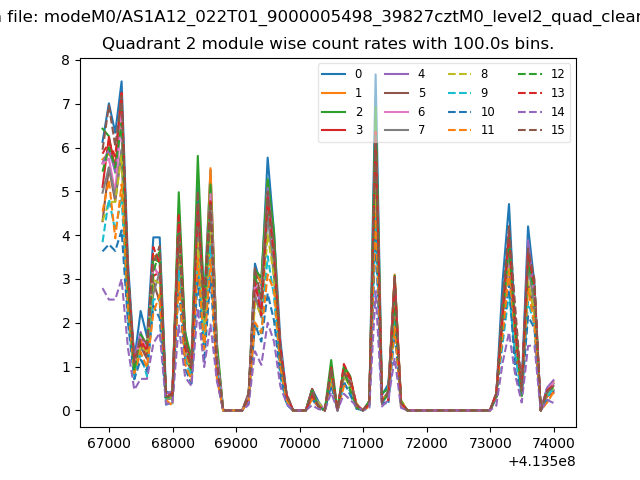
| Module-wise count rates for Quadrant B Data is divided into 100 sec bins |
 |
 |
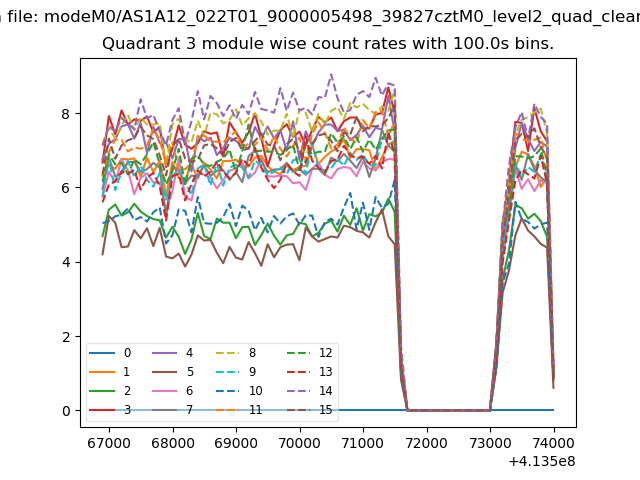
| Module-wise count rates for Quadrant C Data is divided into 100 sec bins |
 |
 |
| Module-wise count rates for Quadrant D Data is divided into 100 sec bins |
 |
 |
| Parameter | Plot |
|---|---|
| CZT HV Monitor | 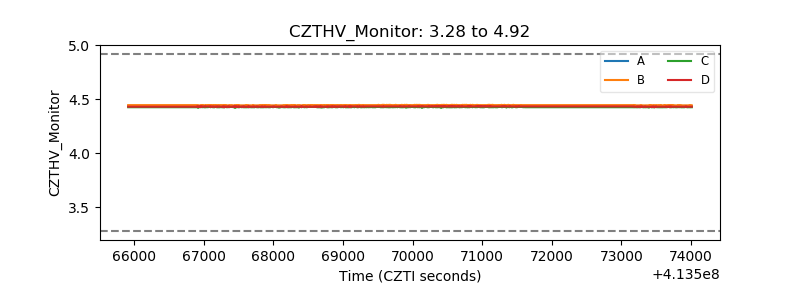 |
| D_VDD | 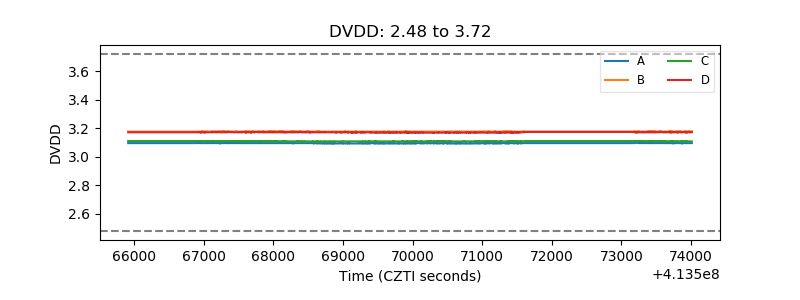 |
| Temperature 1 | 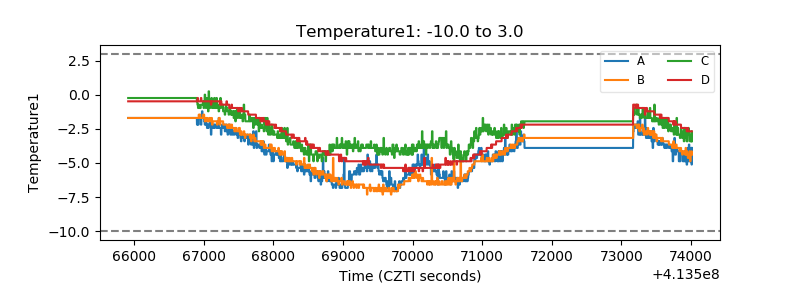 |
| Veto HV Monitor | 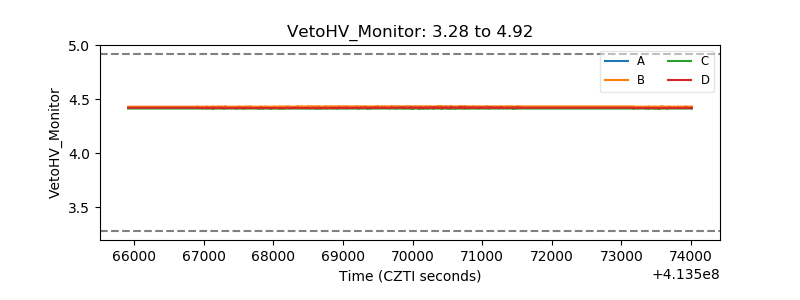 |
| Veto LLD | 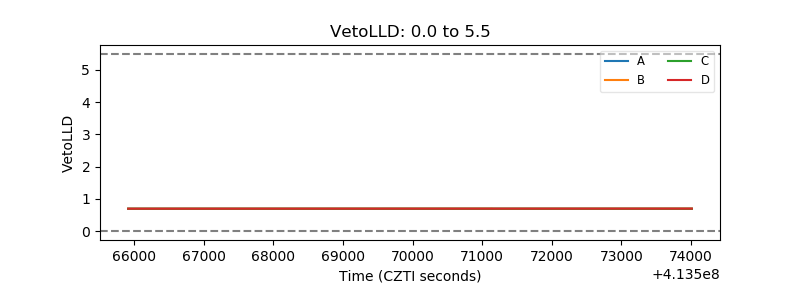 |
| Alpha Counter | 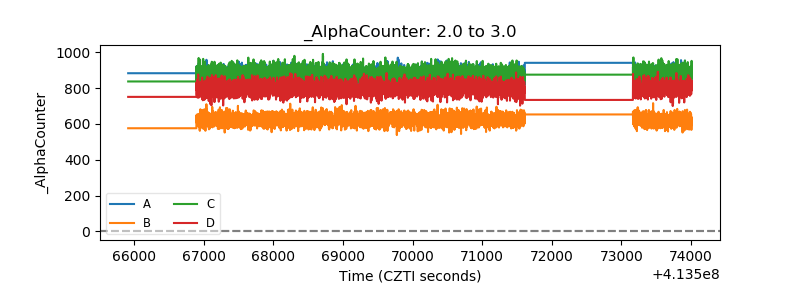 |
| _CPM_Rate | 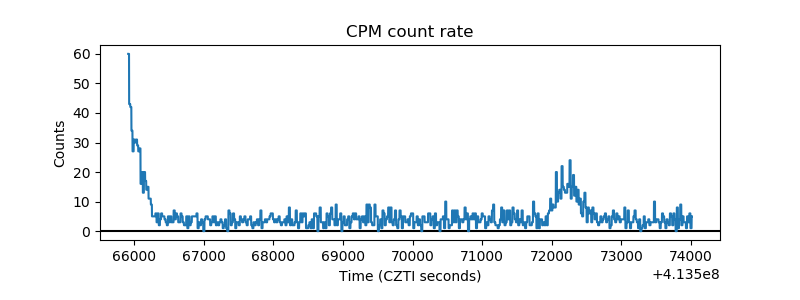 |
| CZT Counter | 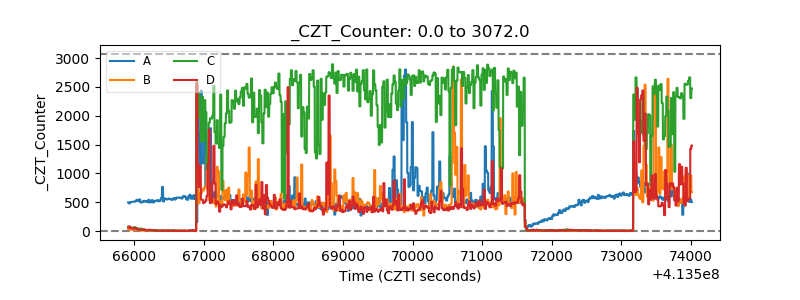 |
| +2.5 Volts monitor | 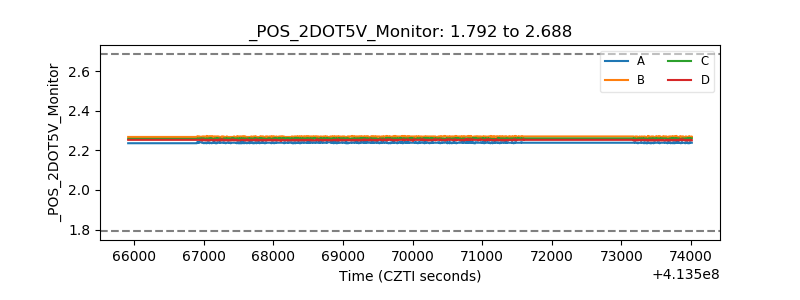 |
| +5 Volts monitor | 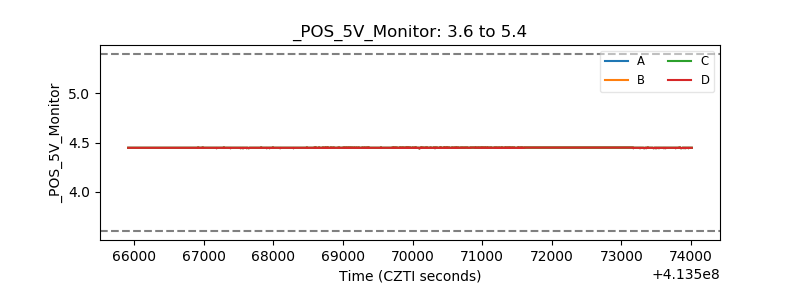 |
| _ROLL_ROT | 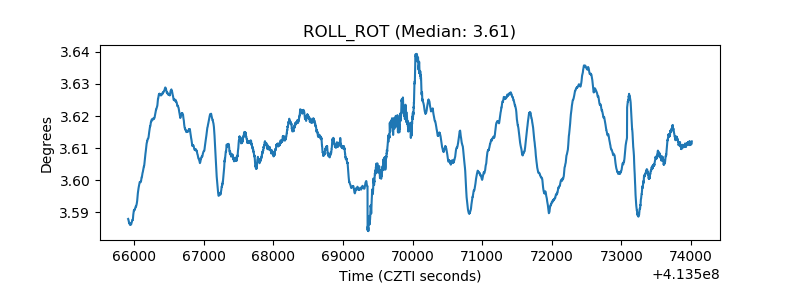 |
| _Roll_DEC | 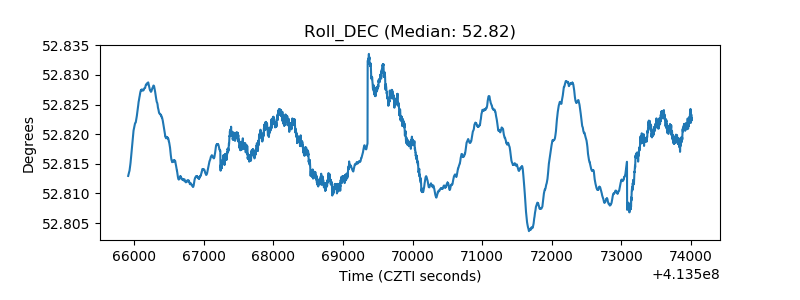 |
| _Roll_RA | 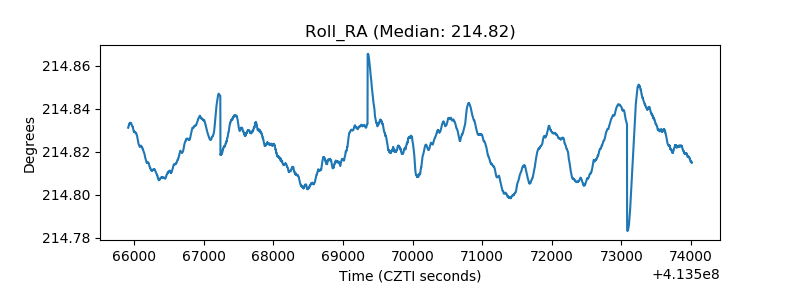 |
| Veto Counter | 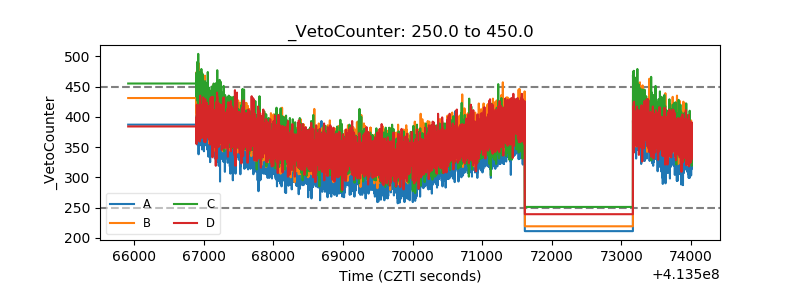 |