| Param | Original file | Final file |
|---|---|---|
| Filename | modeM0/AS1A12_022T01_9000005498_39828cztM0_level2.fits | modeM0/AS1A12_022T01_9000005498_39828cztM0_level2_quad_clean.evt |
| Size (bytes) | 643,366,080 | 80,398,080 |
| Size | 613.6 MB | 76.7 MB |
| Events in quadrant A | 3,217,561 | 640,900 |
| Events in quadrant B | 3,599,110 | 639,108 |
| Events in quadrant C | 12,906,415 | 177,803 |
| Events in quadrant D | 3,638,706 | 568,601 |
| Mode M0 | |||
|---|---|---|---|
| Quadrant | BADHDUFLAG | Total packets | Discarded packets |
| A | 0 | 13363 | 3 |
| B | 0 | 14745 | 2 |
| C | 0 | 42320 | 8 |
| D | 0 | 15012 | 4 |
| Mode M9 | |||
|---|---|---|---|
| Quadrant | BADHDUFLAG | Total packets | Discarded packets |
| A | 0 | 14 | 0 |
| B | 0 | 14 | 0 |
| C | 0 | 14 | 0 |
| D | 0 | 14 | 0 |
| Mode SS | |||
|---|---|---|---|
| Quadrant | BADHDUFLAG | Total packets | Discarded packets |
| A | 0 | 118 | 0 |
| B | 0 | 118 | 0 |
| C | 0 | 118 | 0 |
| D | 0 | 118 | 0 |
| Quadrant | Total seconds | Saturated seconds | Saturation percentage |
|---|---|---|---|
| A | 5834 | 63 | 1.079877% |
| B | 5834 | 214 | 3.668152% |
| C | 5833 | 4447 | 76.238642% |
| D | 5833 | 179 | 3.068747% |
Noise dominated data is calculated using 1-second bins in cleaned event files. If a bin has >2000 counts, and if more than 50% of those come from <1% of pixels, then it is considered to be noise-dominated and hence unusable.
| Quadrant | # 1 sec bins | Bins with >0 counts | Bins with >2000 counts | High rate bins dominated by noise | Noise dominated (total time) | Noise dominated (detector-on time) | Marked lightcurve |
|---|---|---|---|---|---|---|---|
| A | 7177 | 5835 | 51 | 51 | 0.71% | 0.87% | 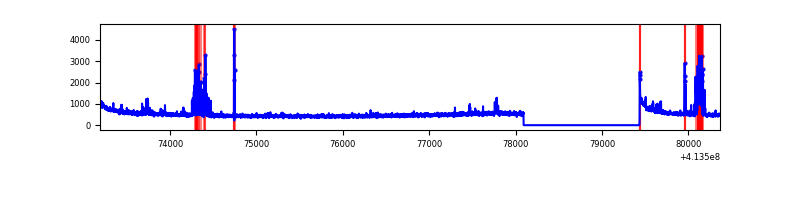 |
| B | 7177 | 5835 | 143 | 143 | 1.99% | 2.45% | 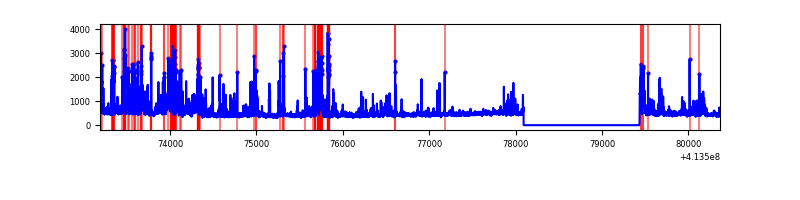 |
| C | 7177 | 5835 | 3997 | 3997 | 55.69% | 68.50% | 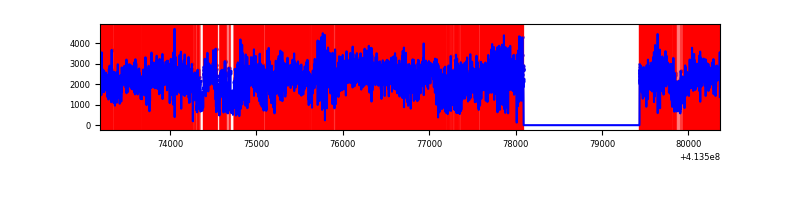 |
| D | 7177 | 5835 | 148 | 148 | 2.06% | 2.54% | 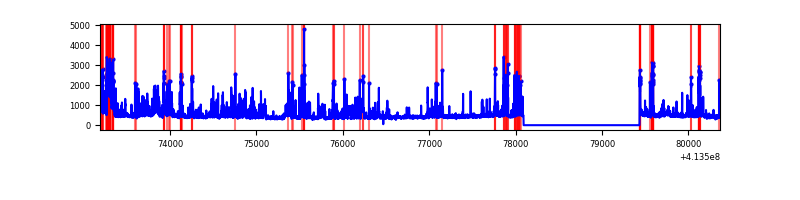 |
Top three noisy pixels from each quadrant. If the there are fewer than three noisy pixels in the level2.evt file, extra rows are filled as -1
| Pixel properties | Quadrant properties | ||||||
|---|---|---|---|---|---|---|---|
| Quadrant | DetID | PixID | Counts | Sigma | Mean | Median | Sigma |
| A | 10 | 83 | 473894 | 3705.96 | 628 | 616 | 127.7 |
| A | 13 | 248 | 253736 | 1982.03 | 628 | 616 | 127.7 |
| A | 3 | 1 | 21135 | 160.67 | 628 | 616 | 127.7 |
| B | 4 | 171 | 433524 | 3641.06 | 617 | 601 | 118.9 |
| B | 0 | 229 | 355134 | 2981.77 | 617 | 601 | 118.9 |
| B | 5 | 32 | 104607 | 874.73 | 617 | 601 | 118.9 |
| C | 9 | 187 | 9905258 | 107796.0 | 390 | 391 | 91.9 |
| C | 15 | 208 | 1198243 | 13036.38 | 390 | 391 | 91.9 |
| C | 15 | 214 | 161081 | 1748.81 | 390 | 391 | 91.9 |
| D | 12 | 227 | 439046 | 2960.64 | 607 | 589 | 148.1 |
| D | 2 | 249 | 347970 | 2345.66 | 607 | 589 | 148.1 |
| D | 13 | 249 | 145920 | 981.33 | 607 | 589 | 148.1 |
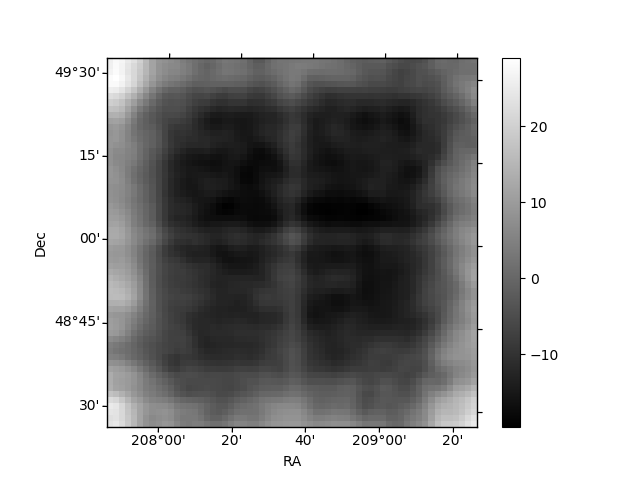
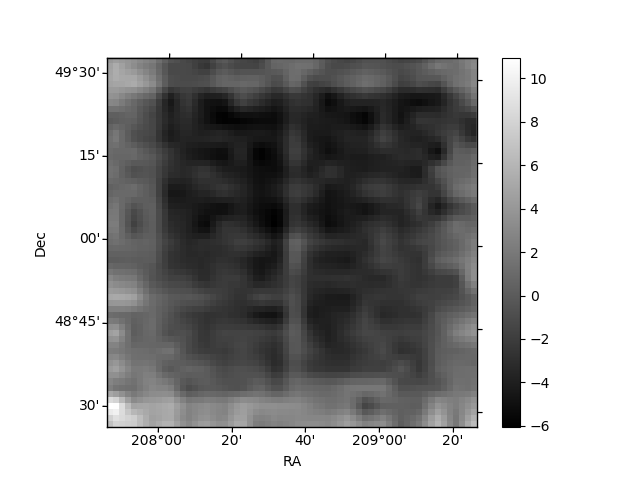
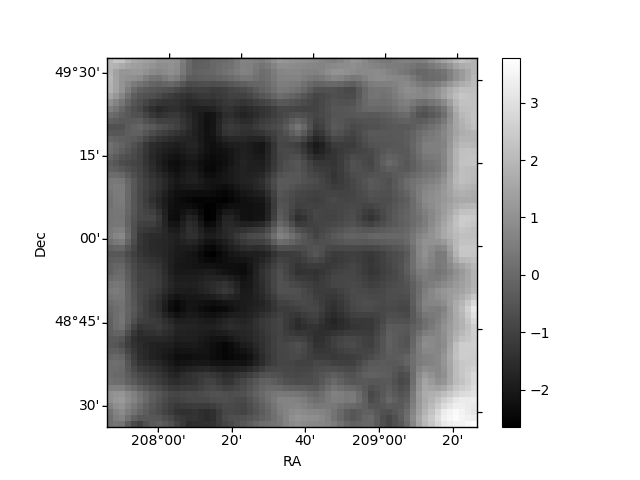
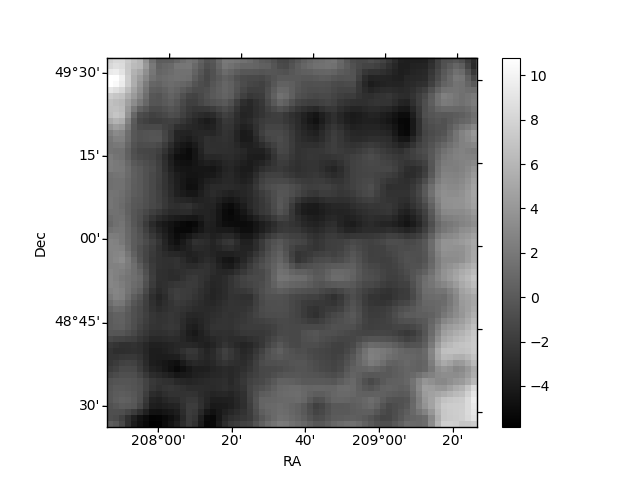
Histogram calculated using DETX and DETY for each event in the final _common_clean file
| Quadrant A | 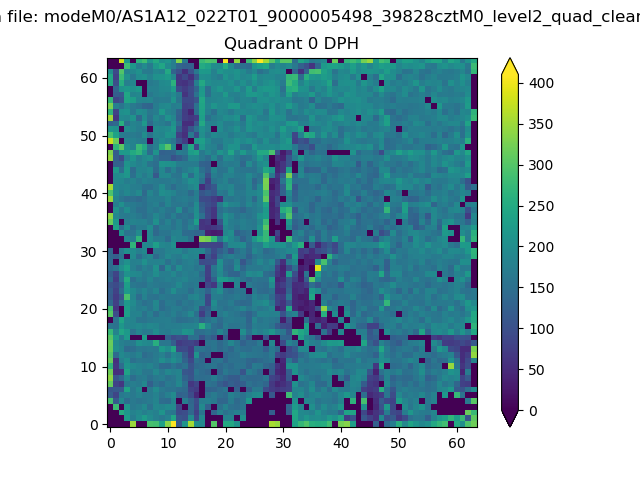 |
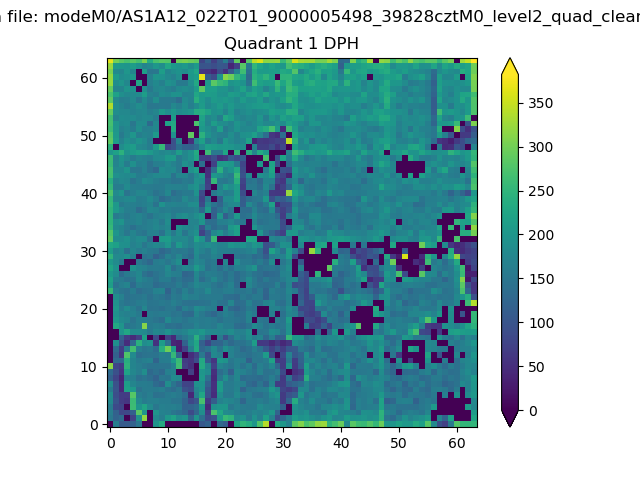 |
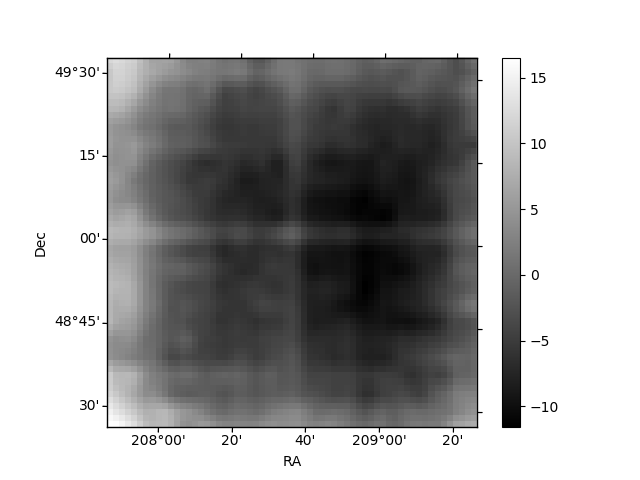
Quadrant B |
|---|---|---|---|
| Quadrant D | 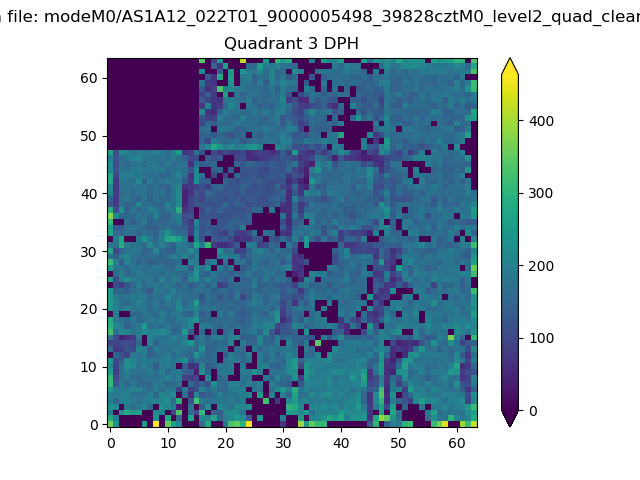 |
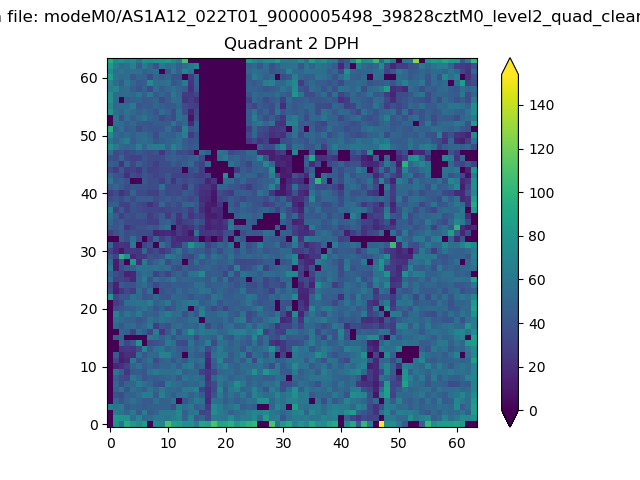 |
Quadrant C |
| Plot type | Count rate plots | Images |
|---|---|---|
| Comparison with Poisson distribution Blue bars denote a histogram of data divided into 1 sec bins. Red curve is a Poisson curve with rate = median count rate of data. |
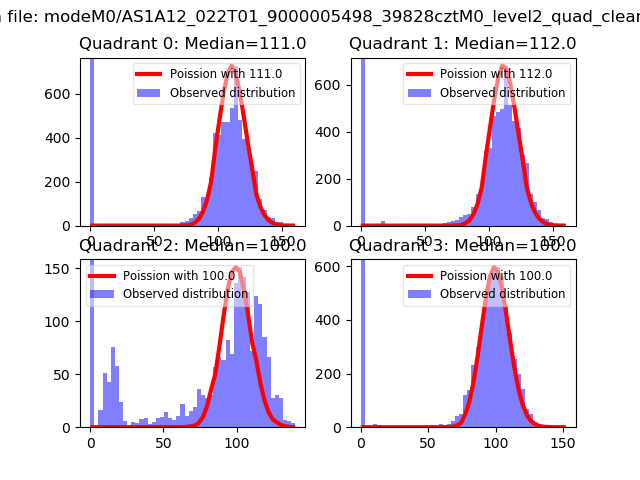 |
 |
| Quadrant-wise count rates Data is divided into 100 sec bins |
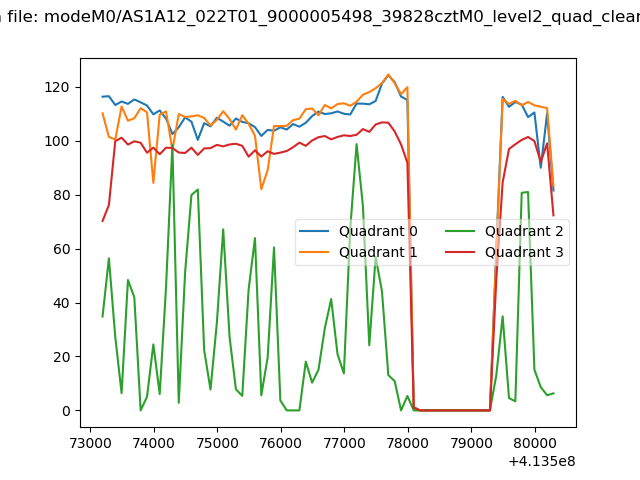 |
|
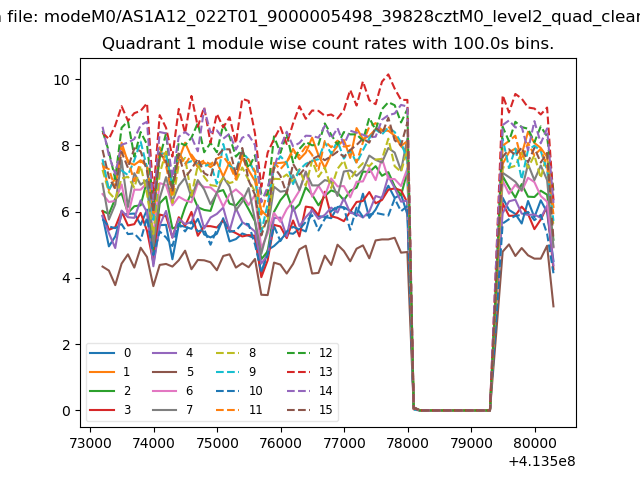
| Module-wise count rates for Quadrant A Data is divided into 100 sec bins |
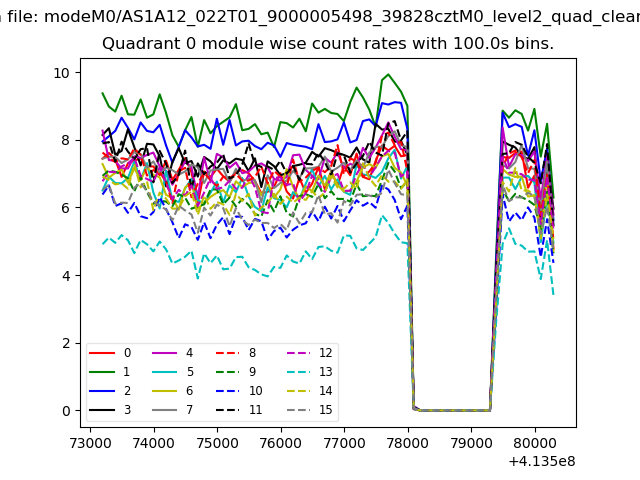 |
 |
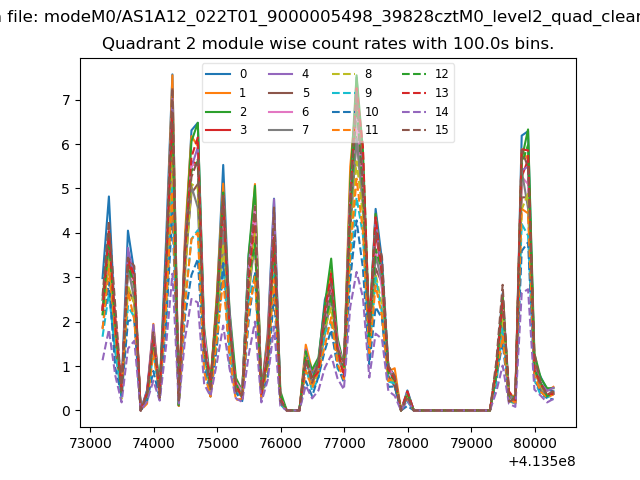
| Module-wise count rates for Quadrant B Data is divided into 100 sec bins |
 |
 |
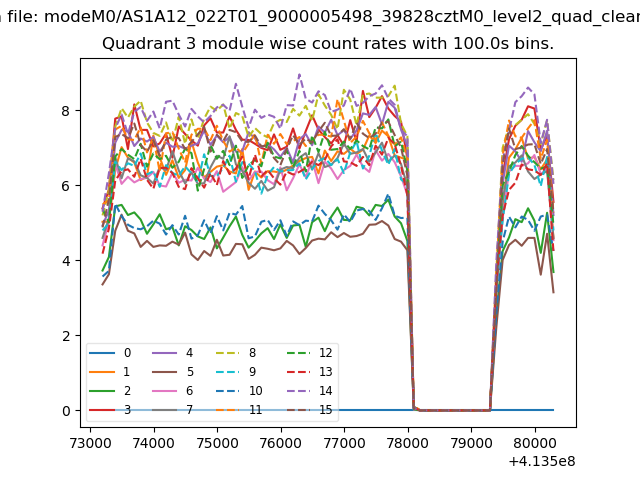
| Module-wise count rates for Quadrant C Data is divided into 100 sec bins |
 |
 |
| Module-wise count rates for Quadrant D Data is divided into 100 sec bins |
 |
 |
| Parameter | Plot |
|---|---|
| CZT HV Monitor | 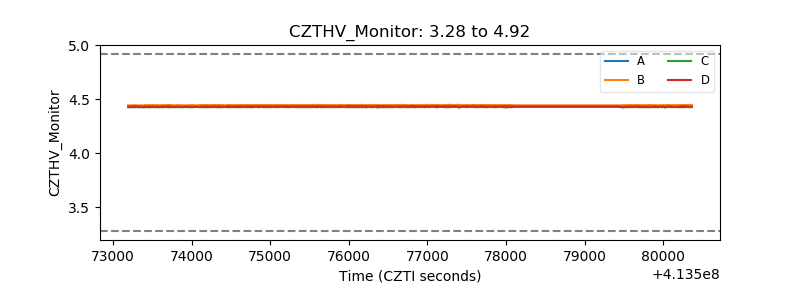 |
| D_VDD | 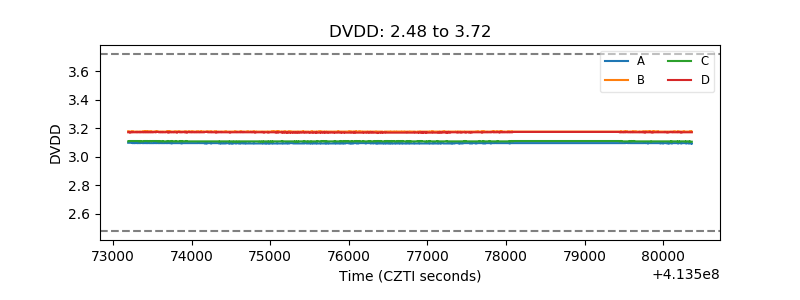 |
| Temperature 1 | 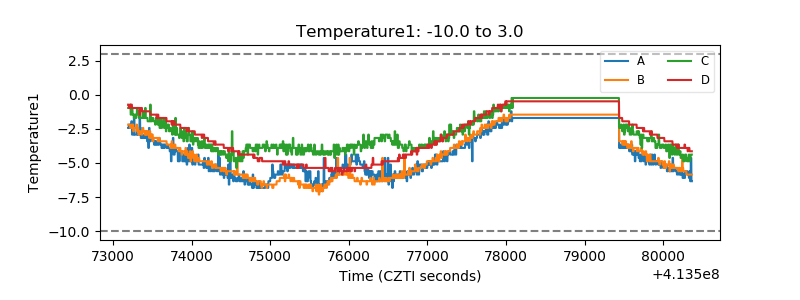 |
| Veto HV Monitor |  |
| Veto LLD | 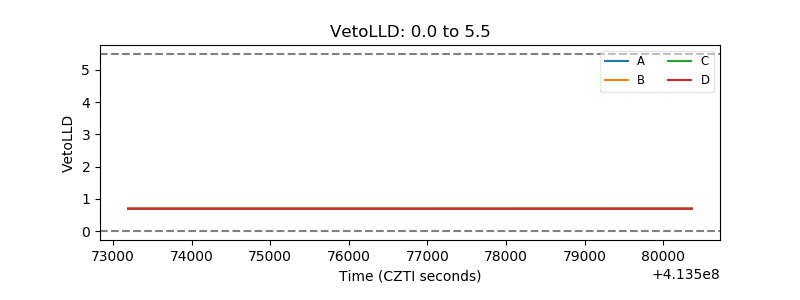 |
| Alpha Counter | 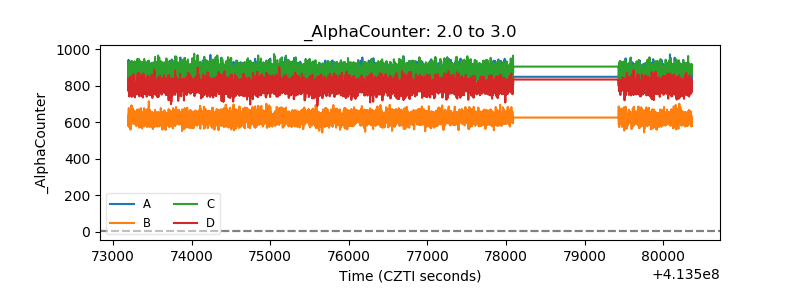 |
| _CPM_Rate | 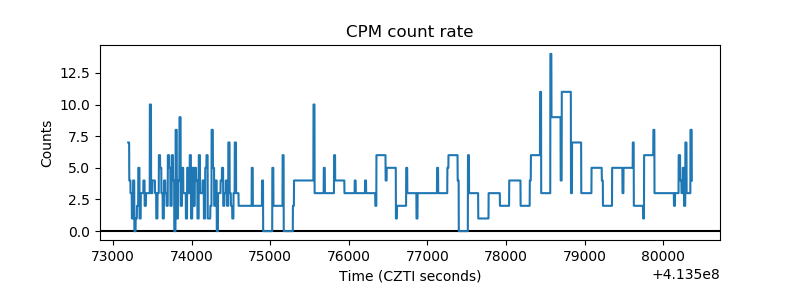 |
| CZT Counter | 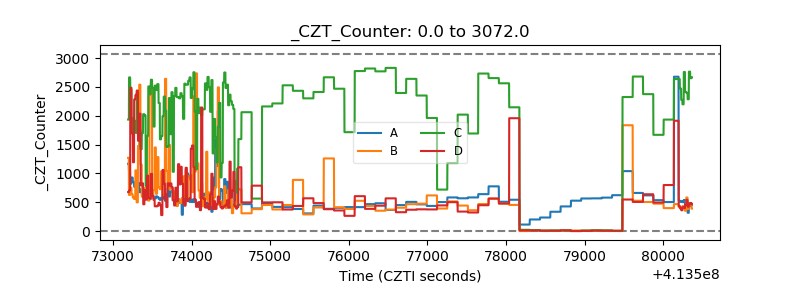 |
| +2.5 Volts monitor | 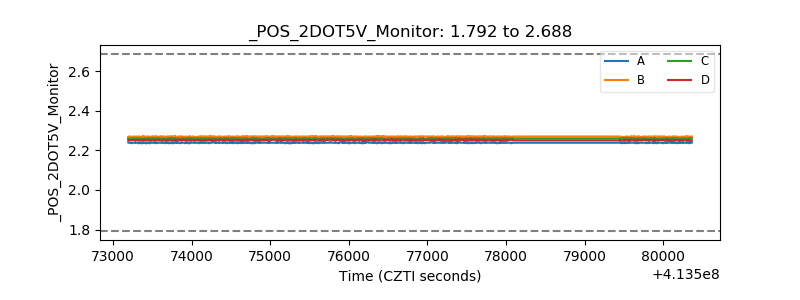 |
| +5 Volts monitor | 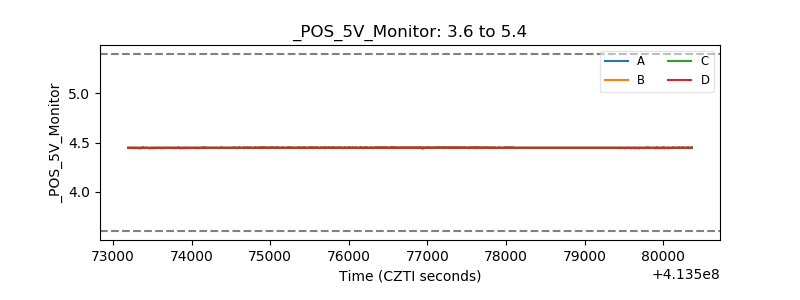 |
| _ROLL_ROT | 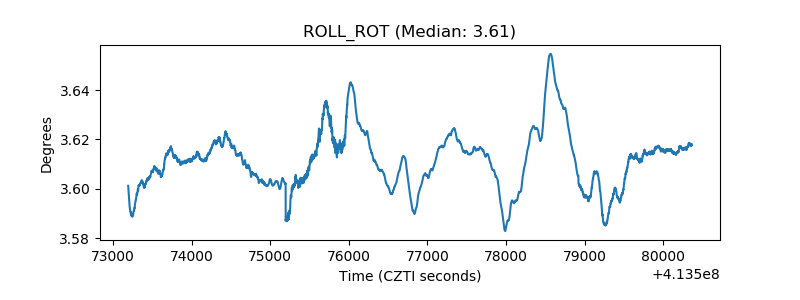 |
| _Roll_DEC | 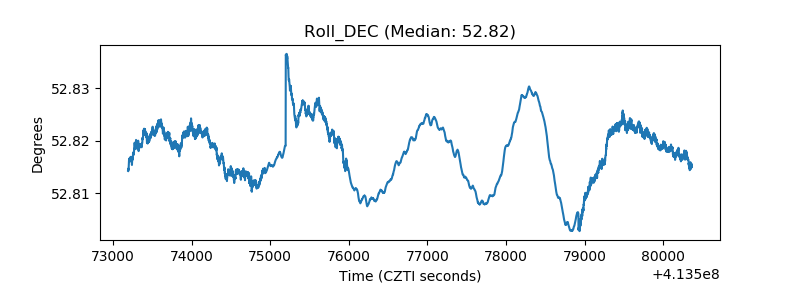 |
| _Roll_RA | 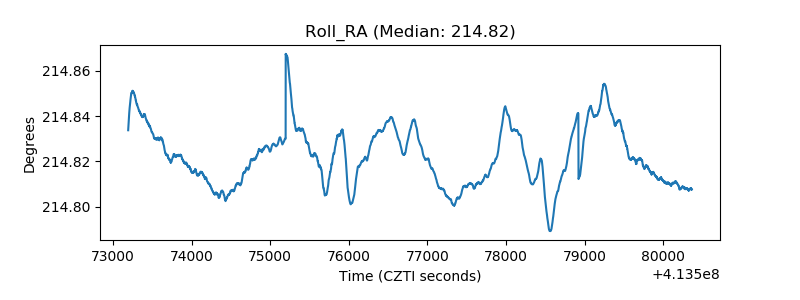 |
| Veto Counter | 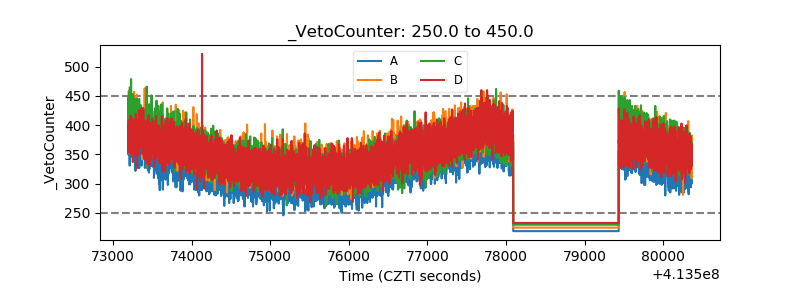 |