| Param | Original file | Final file |
|---|---|---|
| Filename | modeM0/AS1A12_022T01_9000005498_39841cztM0_level2.fits | modeM0/AS1A12_022T01_9000005498_39841cztM0_level2_quad_clean.evt |
| Size (bytes) | 1,136,966,400 | 193,429,440 |
| Size | 1.1 GB | 184.5 MB |
| Events in quadrant A | 6,999,602 | 1,367,513 |
| Events in quadrant B | 7,819,894 | 1,334,364 |
| Events in quadrant C | 18,503,721 | 1,052,862 |
| Events in quadrant D | 7,765,430 | 1,208,694 |
| Mode M0 | |||
|---|---|---|---|
| Quadrant | BADHDUFLAG | Total packets | Discarded packets |
| A | 0 | 28990 | 233 |
| B | 0 | 32483 | 240 |
| C | 0 | 64984 | 974 |
| D | 0 | 32859 | 650 |
| Mode M9 | |||
|---|---|---|---|
| Quadrant | BADHDUFLAG | Total packets | Discarded packets |
| A | 0 | 59 | 2 |
| B | 0 | 59 | 1 |
| C | 0 | 59 | 2 |
| D | 0 | 59 | 1 |
| Mode SS | |||
|---|---|---|---|
| Quadrant | BADHDUFLAG | Total packets | Discarded packets |
| A | 0 | 268 | 4 |
| B | 0 | 266 | 2 |
| C | 0 | 268 | 4 |
| D | 0 | 267 | 3 |
| Quadrant | Total seconds | Saturated seconds | Saturation percentage |
|---|---|---|---|
| A | 12923 | 61 | 0.472027% |
| B | 12934 | 552 | 4.267821% |
| C | 12909 | 2971 | 23.014951% |
| D | 12920 | 307 | 2.376161% |
Noise dominated data is calculated using 1-second bins in cleaned event files. If a bin has >2000 counts, and if more than 50% of those come from <1% of pixels, then it is considered to be noise-dominated and hence unusable.
| Quadrant | # 1 sec bins | Bins with >0 counts | Bins with >2000 counts | High rate bins dominated by noise | Noise dominated (total time) | Noise dominated (detector-on time) | Marked lightcurve |
|---|---|---|---|---|---|---|---|
| A | 18841 | 12949 | 31 | 31 | 0.16% | 0.24% | 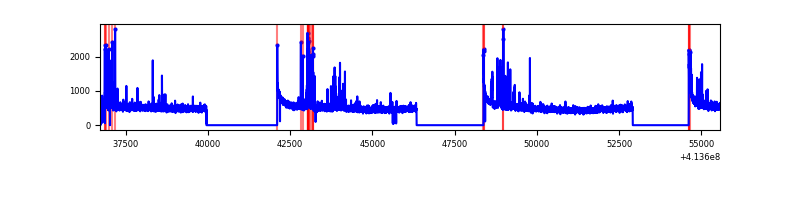 |
| B | 18848 | 12955 | 432 | 432 | 2.29% | 3.33% | 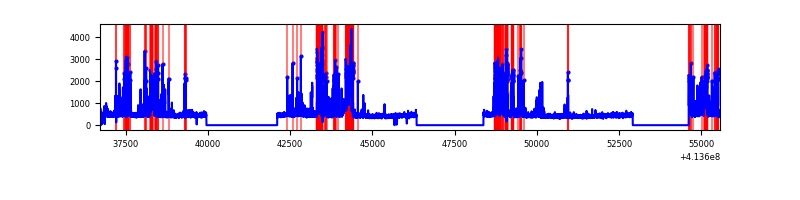 |
| C | 18843 | 12943 | 3002 | 3002 | 15.93% | 23.19% | 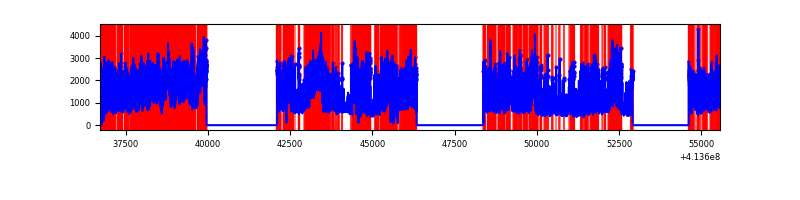 |
| D | 18839 | 12949 | 268 | 268 | 1.42% | 2.07% | 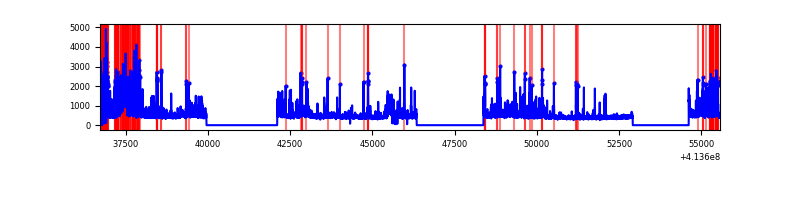 |
Top three noisy pixels from each quadrant. If the there are fewer than three noisy pixels in the level2.evt file, extra rows are filled as -1
| Pixel properties | Quadrant properties | ||||||
|---|---|---|---|---|---|---|---|
| Quadrant | DetID | PixID | Counts | Sigma | Mean | Median | Sigma |
| A | 10 | 83 | 1010343 | 3531.25 | 1418 | 1392 | 285.7 |
| A | 13 | 248 | 366566 | 1278.08 | 1418 | 1392 | 285.7 |
| A | 2 | 79 | 110111 | 380.51 | 1418 | 1392 | 285.7 |
| B | 5 | 32 | 1685278 | 6386.48 | 1387 | 1347 | 263.7 |
| B | 5 | 172 | 423209 | 1599.96 | 1387 | 1347 | 263.7 |
| B | 0 | 230 | 75037 | 279.48 | 1387 | 1347 | 263.7 |
| C | 9 | 187 | 9601210 | 32884.35 | 1269 | 1277 | 291.9 |
| C | 15 | 208 | 3309773 | 11333.18 | 1269 | 1277 | 291.9 |
| C | 15 | 214 | 499245 | 1705.78 | 1269 | 1277 | 291.9 |
| D | 12 | 233 | 877653 | 2632.99 | 1372 | 1332 | 332.8 |
| D | 12 | 227 | 593309 | 1778.65 | 1372 | 1332 | 332.8 |
| D | 1 | 52 | 247417 | 739.39 | 1372 | 1332 | 332.8 |
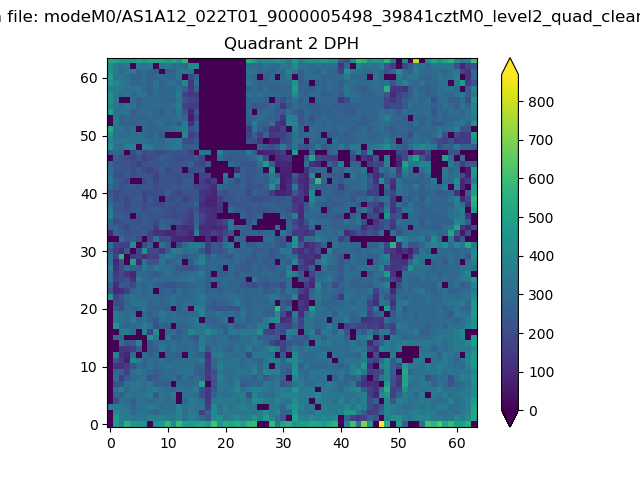
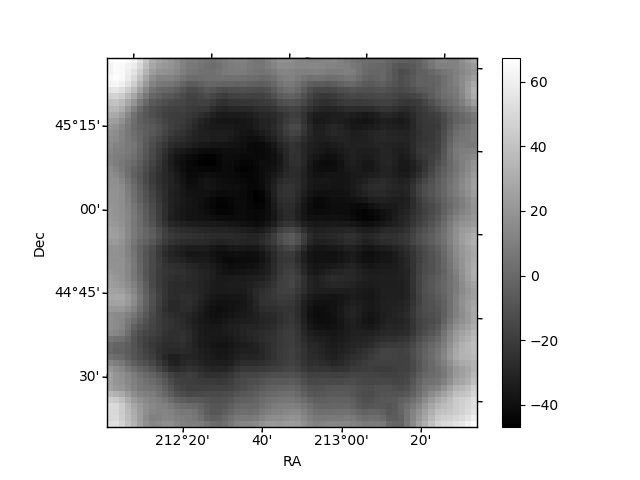
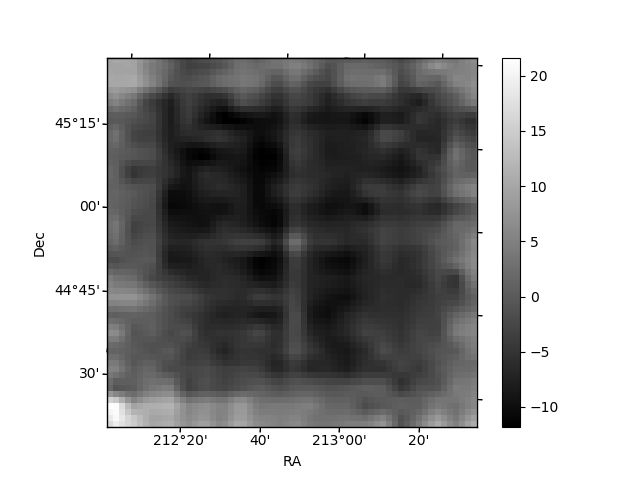
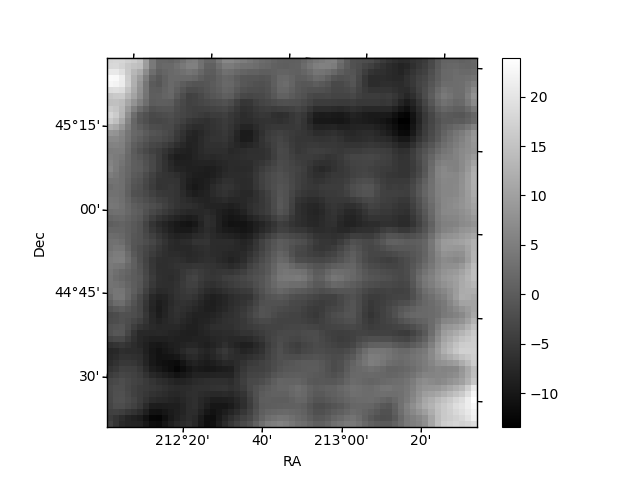
Histogram calculated using DETX and DETY for each event in the final _common_clean file
| Quadrant A | 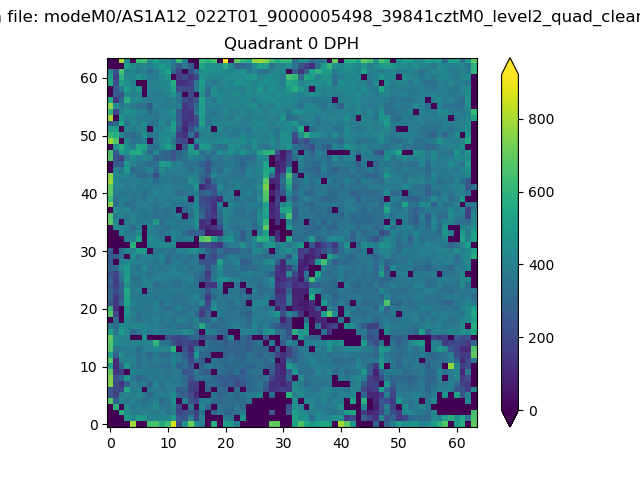 |
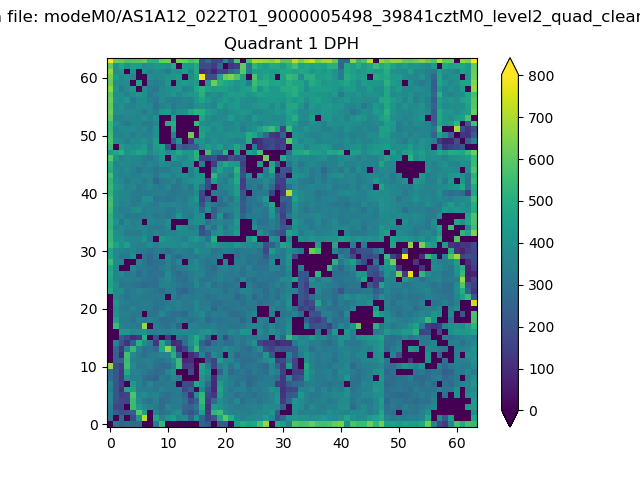 |
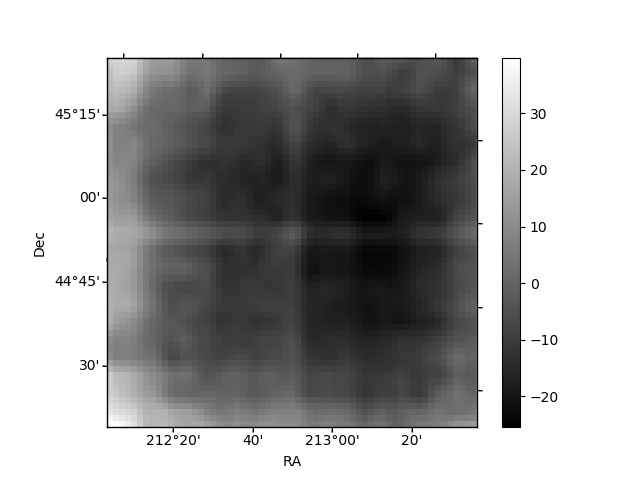
Quadrant B |
|---|---|---|---|
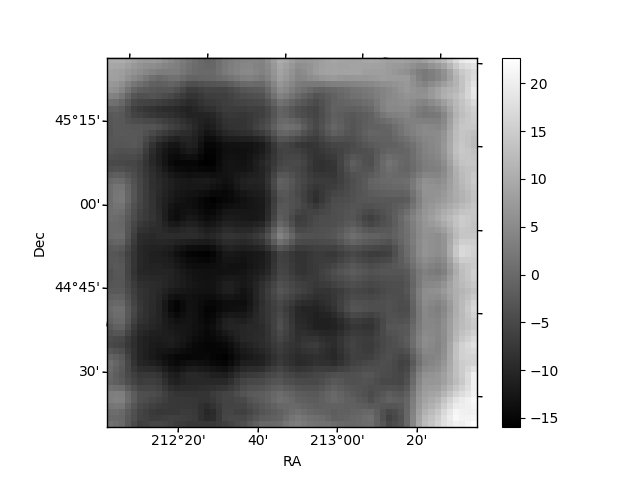
| Quadrant D | 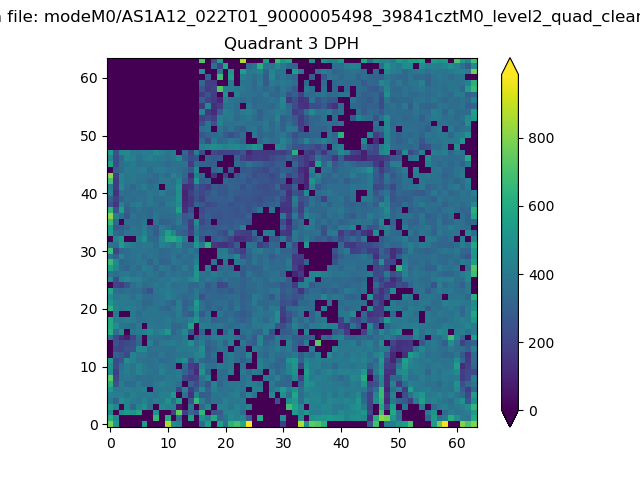 |
 |
Quadrant C |
| Plot type | Count rate plots | Images |
|---|---|---|
| Comparison with Poisson distribution Blue bars denote a histogram of data divided into 1 sec bins. Red curve is a Poisson curve with rate = median count rate of data. |
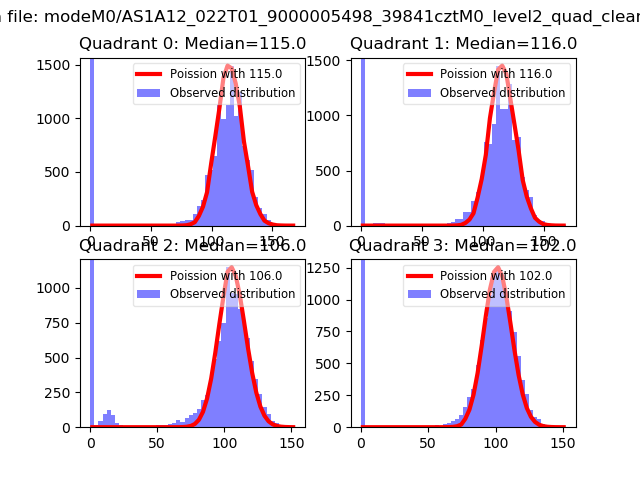 |
 |
| Quadrant-wise count rates Data is divided into 100 sec bins |
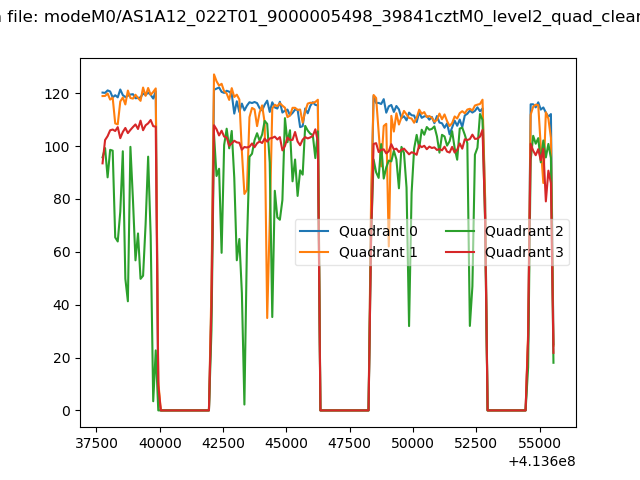 |
|
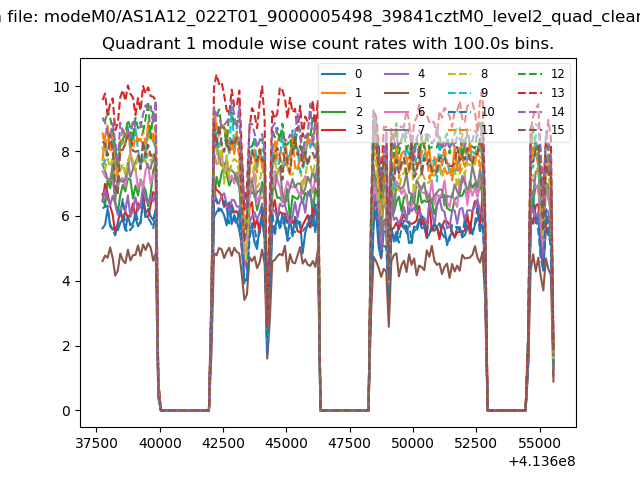
| Module-wise count rates for Quadrant A Data is divided into 100 sec bins |
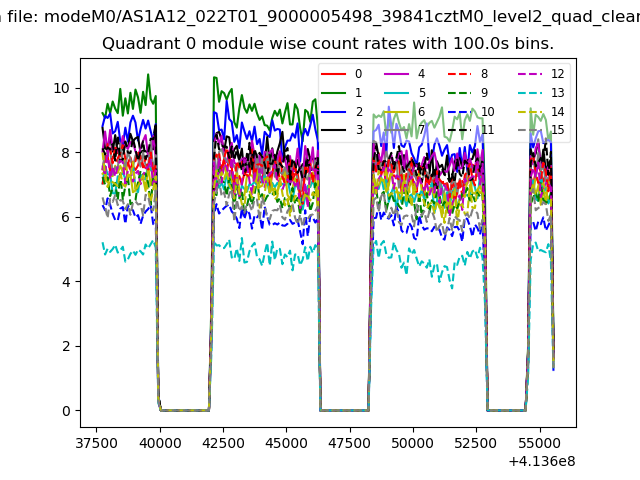 |
 |
| Module-wise count rates for Quadrant B Data is divided into 100 sec bins |
 |
 |
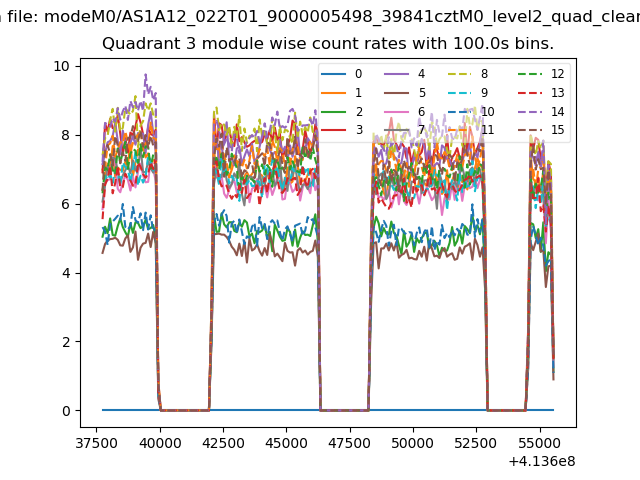
| Module-wise count rates for Quadrant C Data is divided into 100 sec bins |
 |
 |
| Module-wise count rates for Quadrant D Data is divided into 100 sec bins |
 |
 |
| Parameter | Plot |
|---|---|
| CZT HV Monitor | 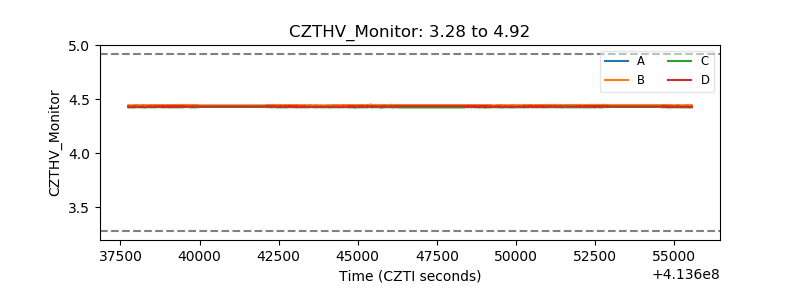 |
| D_VDD | 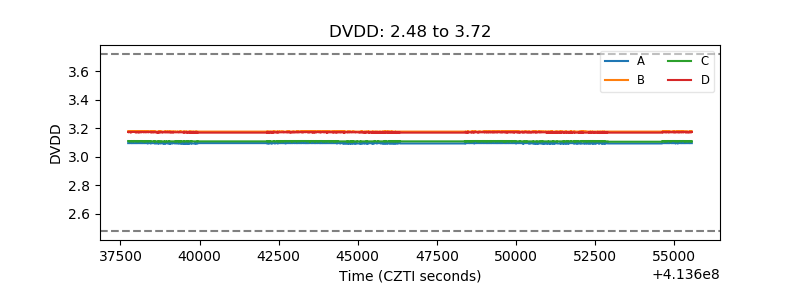 |
| Temperature 1 | 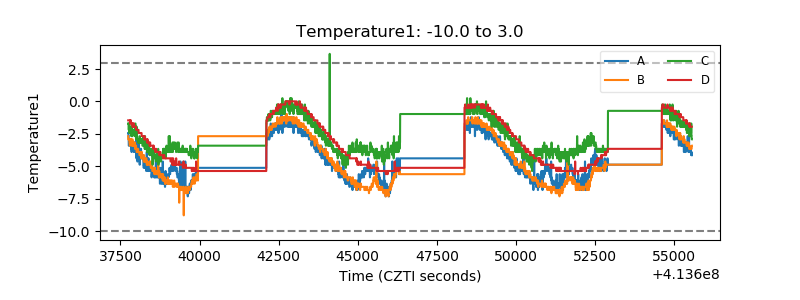 |
| Veto HV Monitor | 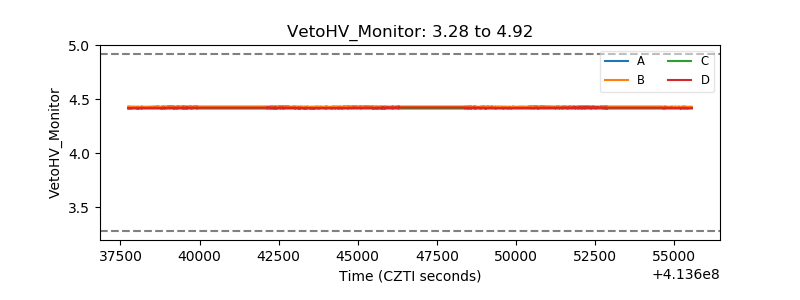 |
| Veto LLD | 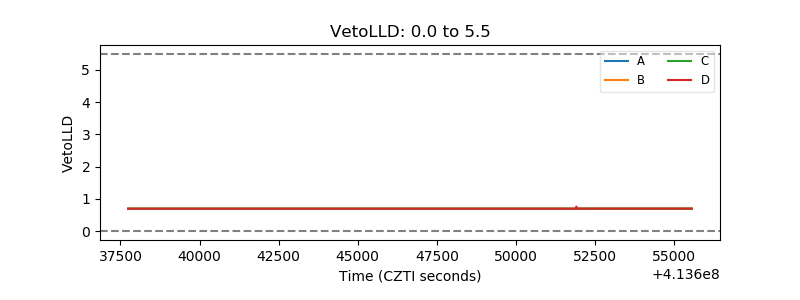 |
| Alpha Counter | 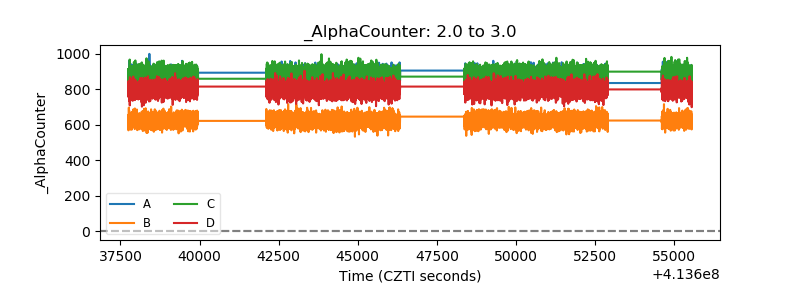 |
| _CPM_Rate | 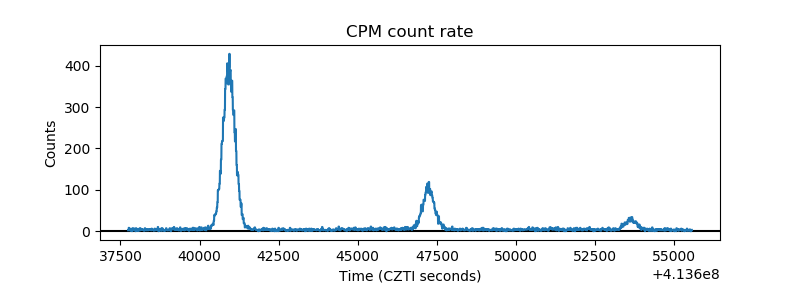 |
| CZT Counter | 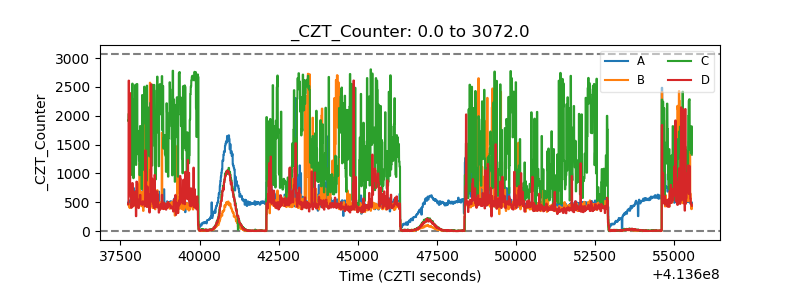 |
| +2.5 Volts monitor | 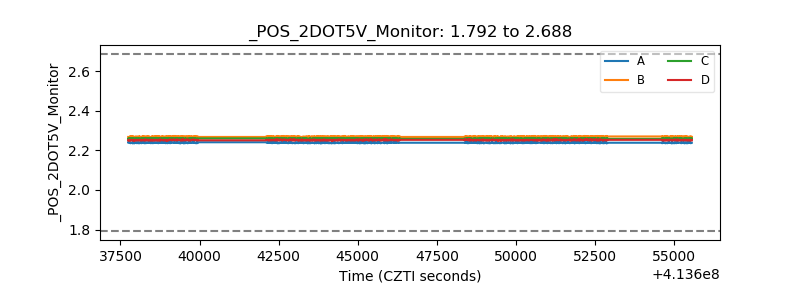 |
| +5 Volts monitor | 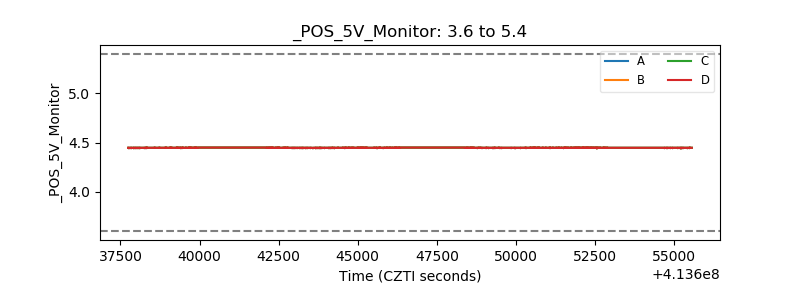 |
| _ROLL_ROT | 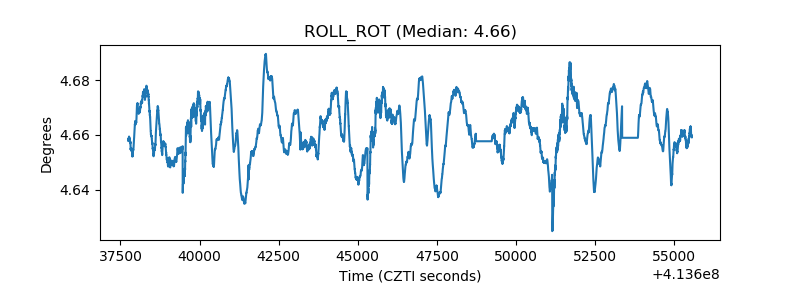 |
| _Roll_DEC | 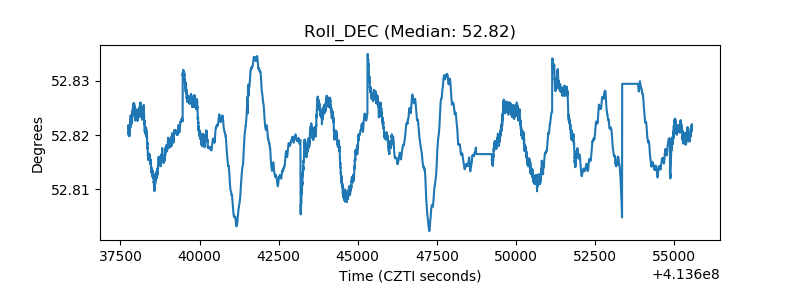 |
| _Roll_RA | 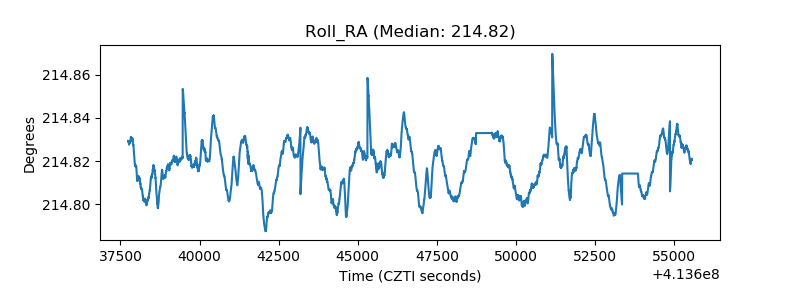 |
| Veto Counter | 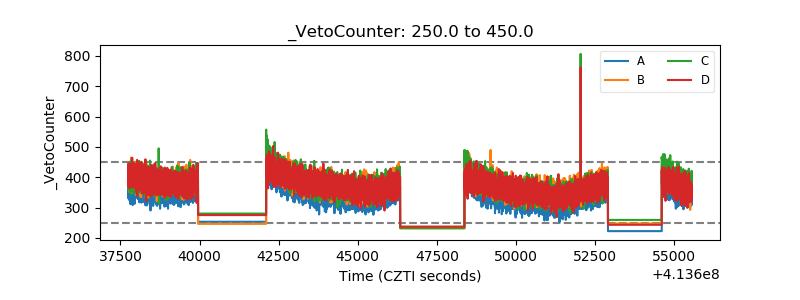 |