| Param | Original file | Final file |
|---|---|---|
| Filename | modeM0/AS1A12_022T01_9000005498_39842cztM0_level2.fits | modeM0/AS1A12_022T01_9000005498_39842cztM0_level2_quad_clean.evt |
| Size (bytes) | 445,112,640 | 91,776,960 |
| Size | 424.5 MB | 87.5 MB |
| Events in quadrant A | 3,084,023 | 627,224 |
| Events in quadrant B | 3,637,363 | 617,580 |
| Events in quadrant C | 6,135,688 | 575,254 |
| Events in quadrant D | 3,178,197 | 561,319 |
| Mode M0 | |||
|---|---|---|---|
| Quadrant | BADHDUFLAG | Total packets | Discarded packets |
| A | 0 | 12966 | 180 |
| B | 0 | 15031 | 131 |
| C | 0 | 22555 | 352 |
| D | 0 | 13563 | 95 |
| Mode M9 | |||
|---|---|---|---|
| Quadrant | BADHDUFLAG | Total packets | Discarded packets |
| A | 0 | 21 | 0 |
| B | 0 | 21 | 0 |
| C | 0 | 21 | 0 |
| D | 0 | 22 | 0 |
| Mode SS | |||
|---|---|---|---|
| Quadrant | BADHDUFLAG | Total packets | Discarded packets |
| A | 0 | 116 | 2 |
| B | 0 | 116 | 0 |
| C | 0 | 116 | 0 |
| D | 0 | 116 | 2 |
| Quadrant | Total seconds | Saturated seconds | Saturation percentage |
|---|---|---|---|
| A | 5683 | 22 | 0.387119% |
| B | 5695 | 266 | 4.670764% |
| C | 5662 | 418 | 7.382550% |
| D | 5701 | 82 | 1.438344% |
Noise dominated data is calculated using 1-second bins in cleaned event files. If a bin has >2000 counts, and if more than 50% of those come from <1% of pixels, then it is considered to be noise-dominated and hence unusable.
| Quadrant | # 1 sec bins | Bins with >0 counts | Bins with >2000 counts | High rate bins dominated by noise | Noise dominated (total time) | Noise dominated (detector-on time) | Marked lightcurve |
|---|---|---|---|---|---|---|---|
| A | 7146 | 5729 | 12 | 12 | 0.17% | 0.21% | 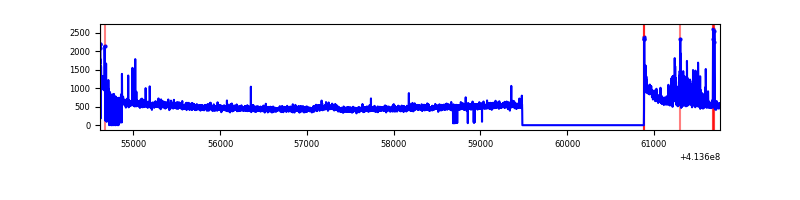 |
| B | 7146 | 5735 | 196 | 196 | 2.74% | 3.42% | 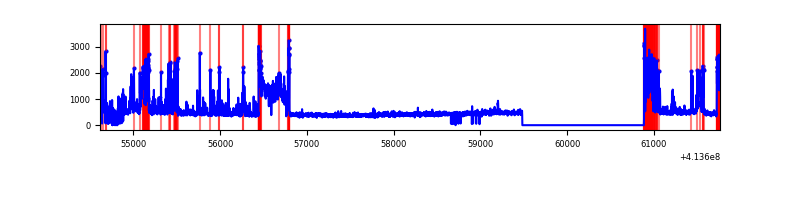 |
| C | 7146 | 5723 | 426 | 426 | 5.96% | 7.44% | 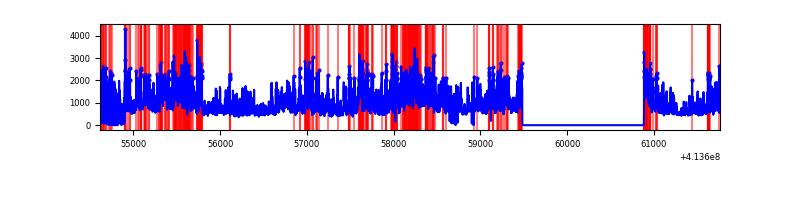 |
| D | 7146 | 5739 | 62 | 62 | 0.87% | 1.08% | 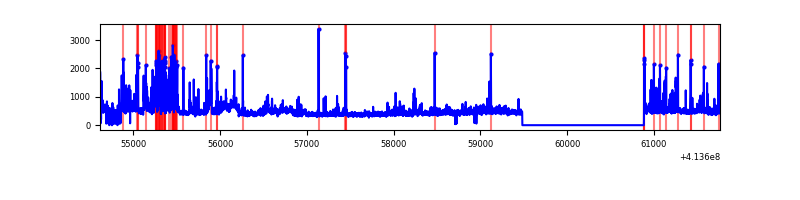 |
Top three noisy pixels from each quadrant. If the there are fewer than three noisy pixels in the level2.evt file, extra rows are filled as -1
| Pixel properties | Quadrant properties | ||||||
|---|---|---|---|---|---|---|---|
| Quadrant | DetID | PixID | Counts | Sigma | Mean | Median | Sigma |
| A | 10 | 83 | 492347 | 3924.55 | 613 | 601 | 125.3 |
| A | 13 | 248 | 170487 | 1355.83 | 613 | 601 | 125.3 |
| A | 15 | 222 | 27788 | 216.98 | 613 | 601 | 125.3 |
| B | 5 | 32 | 650679 | 5546.64 | 602 | 585 | 117.2 |
| B | 5 | 172 | 443181 | 3776.26 | 602 | 585 | 117.2 |
| B | 4 | 67 | 69837 | 590.86 | 602 | 585 | 117.2 |
| C | 9 | 187 | 2487796 | 18206.2 | 582 | 585 | 136.6 |
| C | 15 | 208 | 1061453 | 7765.48 | 582 | 585 | 136.6 |
| C | 15 | 214 | 233639 | 1705.94 | 582 | 585 | 136.6 |
| D | 13 | 171 | 285173 | 1918.97 | 598 | 578 | 148.3 |
| D | 2 | 249 | 165832 | 1114.27 | 598 | 578 | 148.3 |
| D | 12 | 233 | 77283 | 517.2 | 598 | 578 | 148.3 |
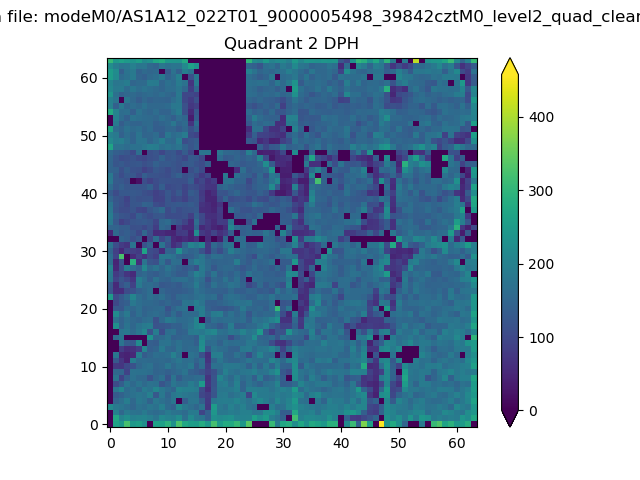
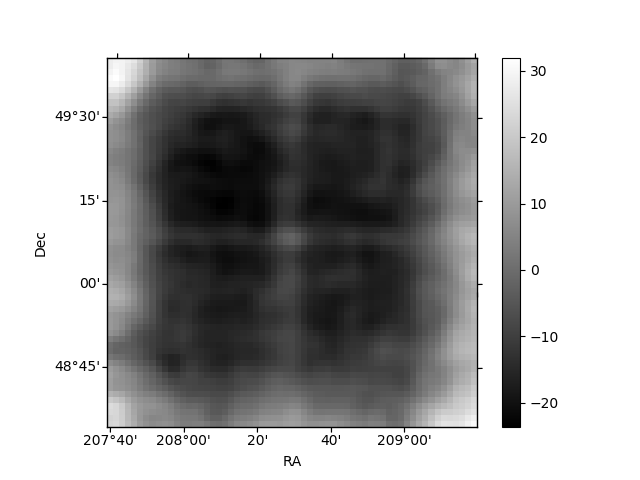
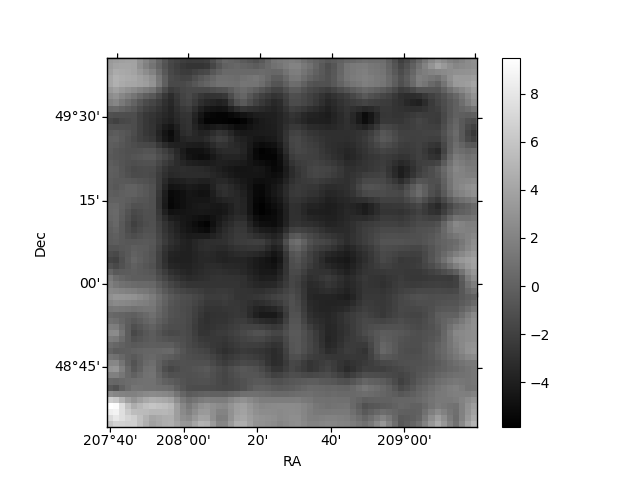
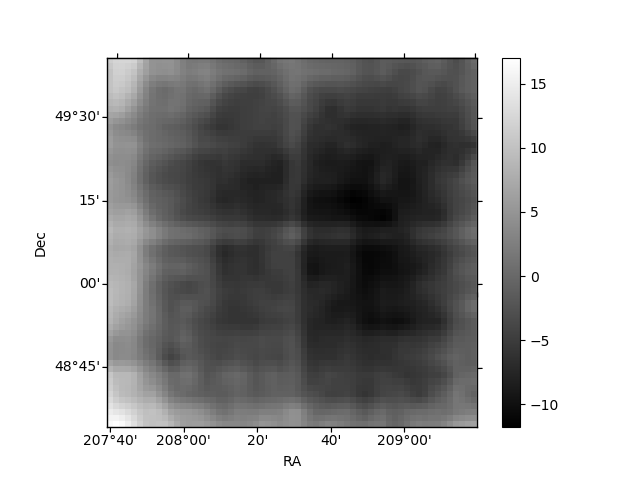
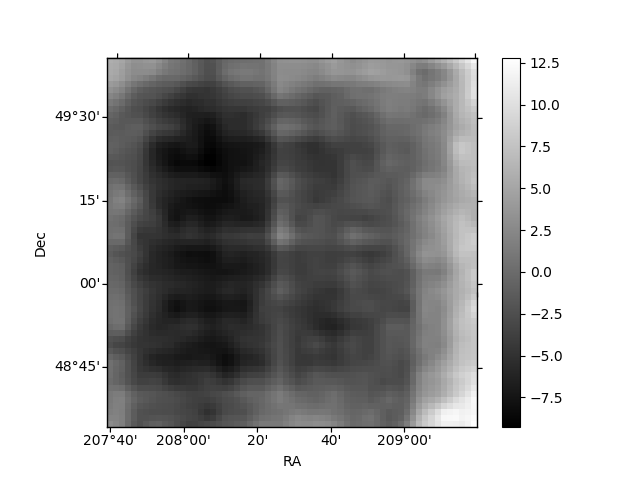
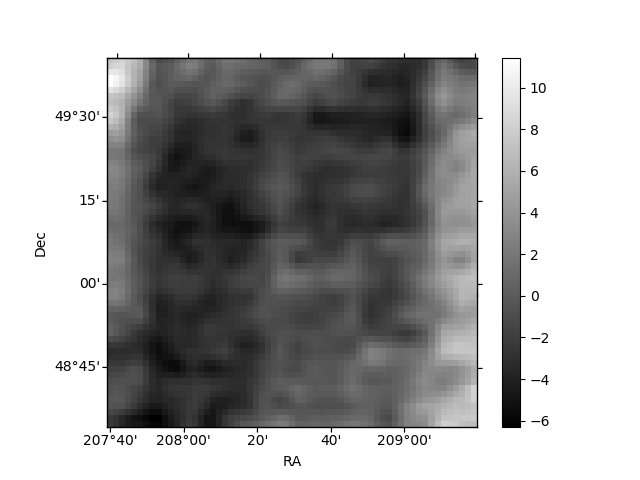
Histogram calculated using DETX and DETY for each event in the final _common_clean file
| Quadrant A | 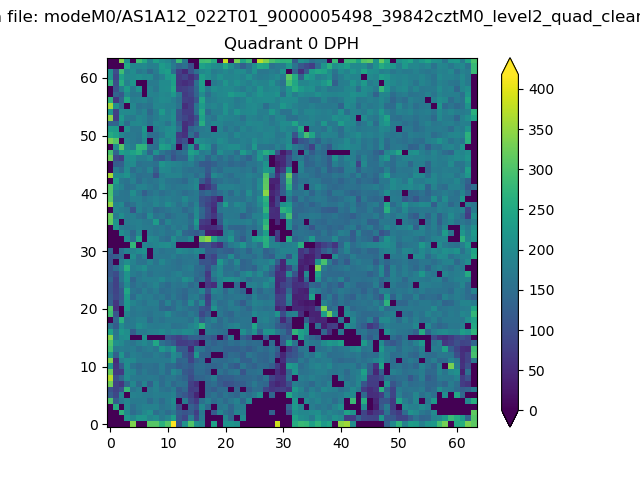 |
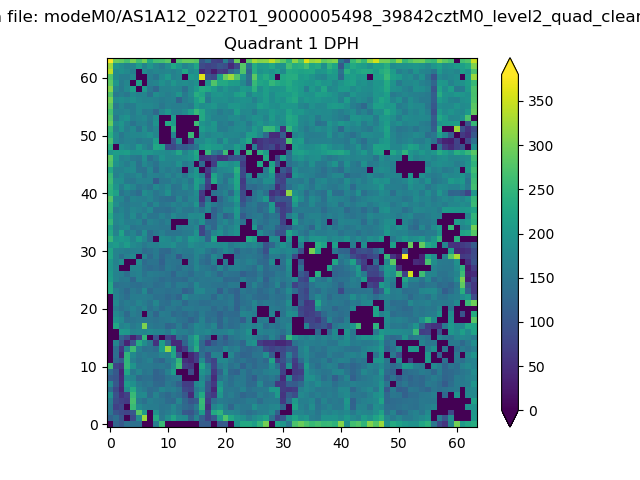 |
Quadrant B |
|---|---|---|---|
| Quadrant D | 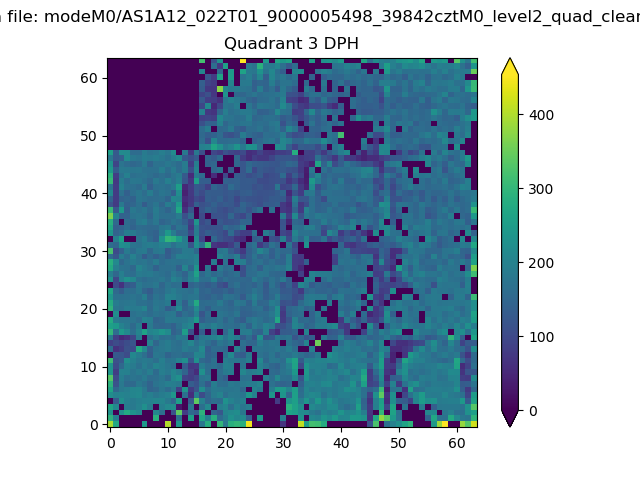 |
 |
Quadrant C |
| Plot type | Count rate plots | Images |
|---|---|---|
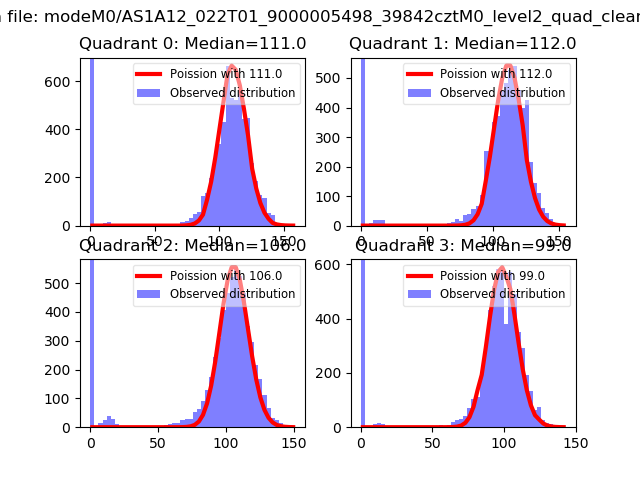
| Comparison with Poisson distribution Blue bars denote a histogram of data divided into 1 sec bins. Red curve is a Poisson curve with rate = median count rate of data. |
 |
 |
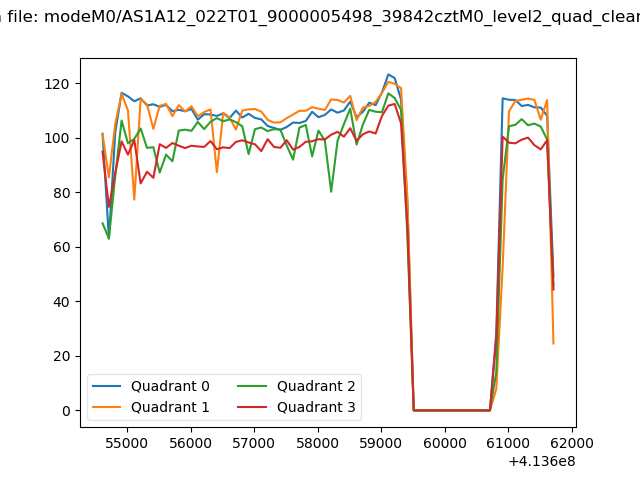
| Quadrant-wise count rates Data is divided into 100 sec bins |
 |
|
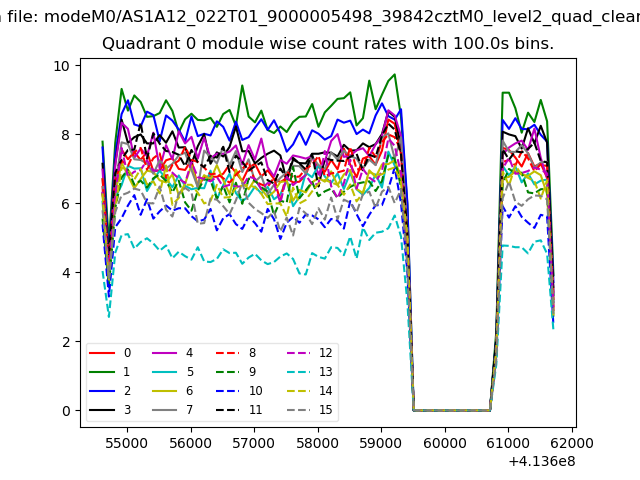
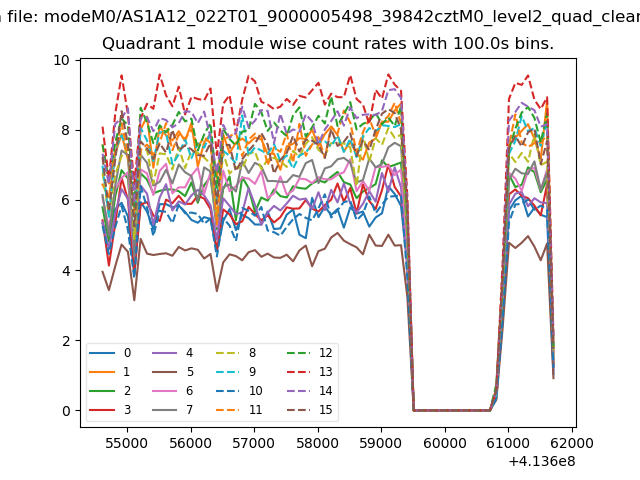
| Module-wise count rates for Quadrant A Data is divided into 100 sec bins |
 |
 |
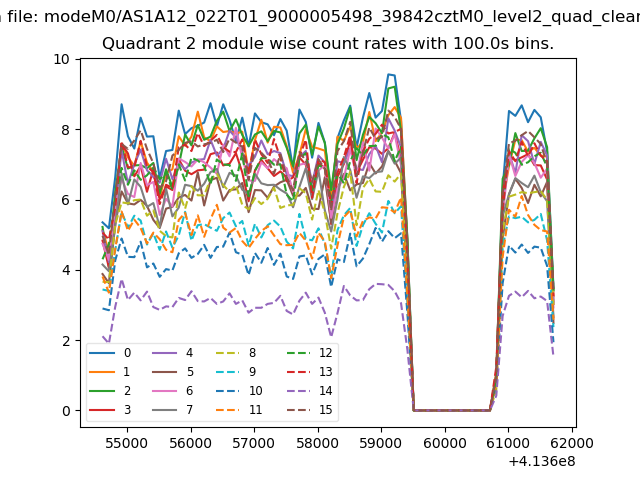
| Module-wise count rates for Quadrant B Data is divided into 100 sec bins |
 |
 |
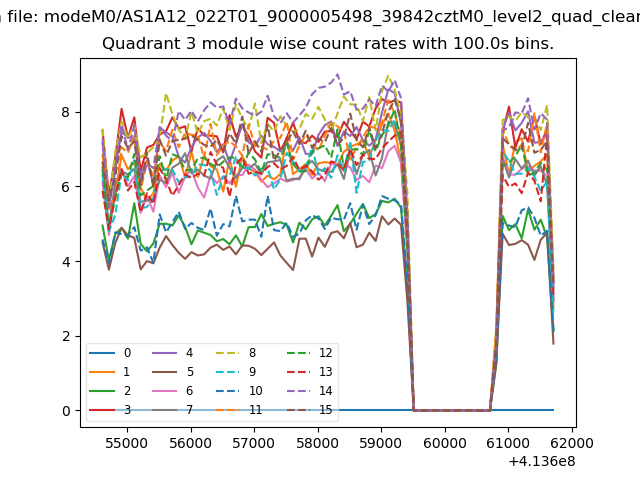
| Module-wise count rates for Quadrant C Data is divided into 100 sec bins |
 |
 |
| Module-wise count rates for Quadrant D Data is divided into 100 sec bins |
 |
 |
| Parameter | Plot |
|---|---|
| CZT HV Monitor | 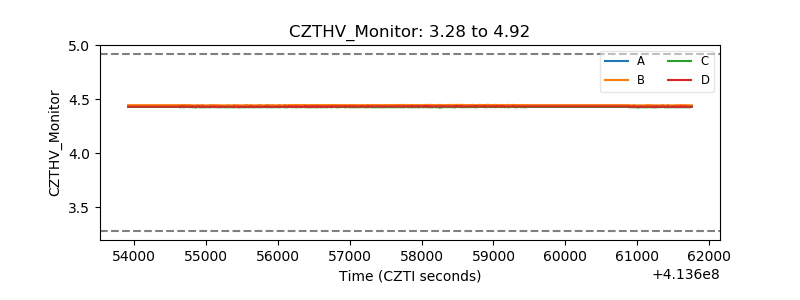 |
| D_VDD | 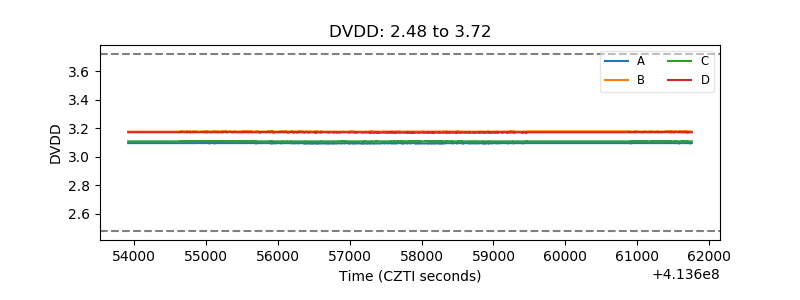 |
| Temperature 1 | 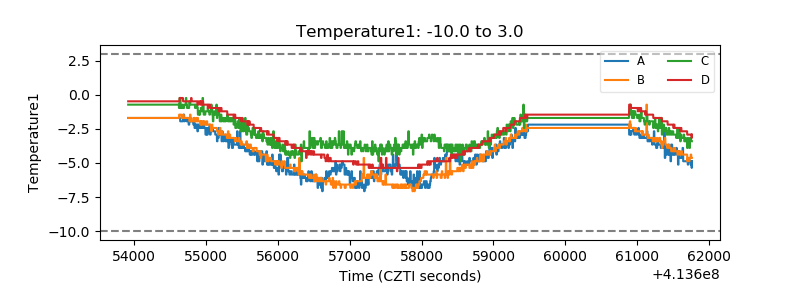 |
| Veto HV Monitor | 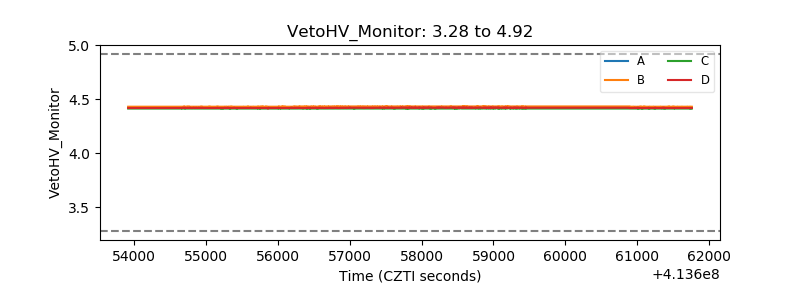 |
| Veto LLD | 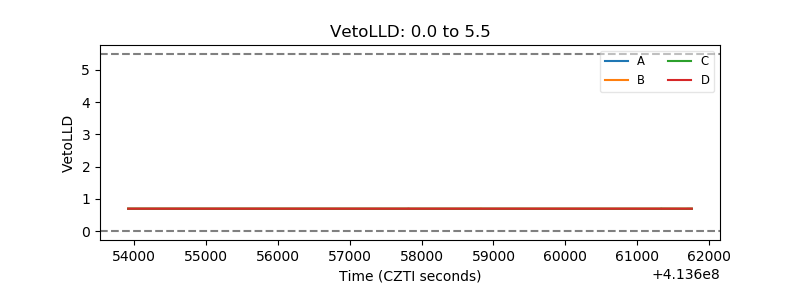 |
| Alpha Counter | 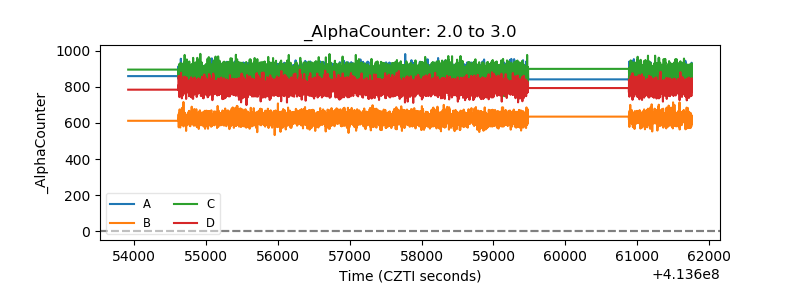 |
| _CPM_Rate | 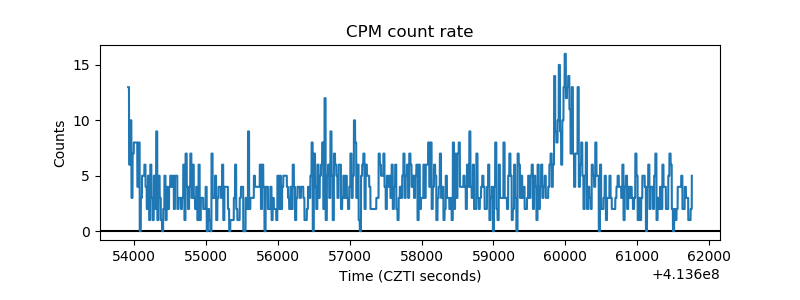 |
| CZT Counter | 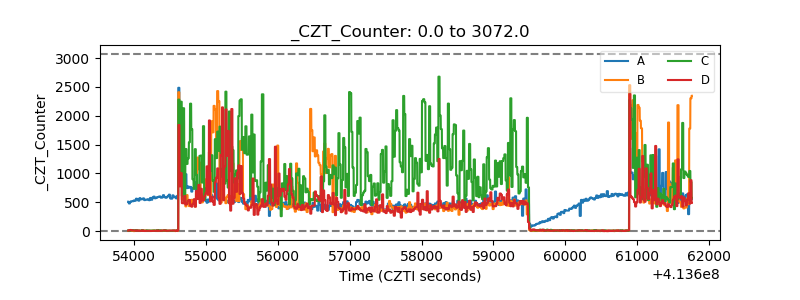 |
| +2.5 Volts monitor | 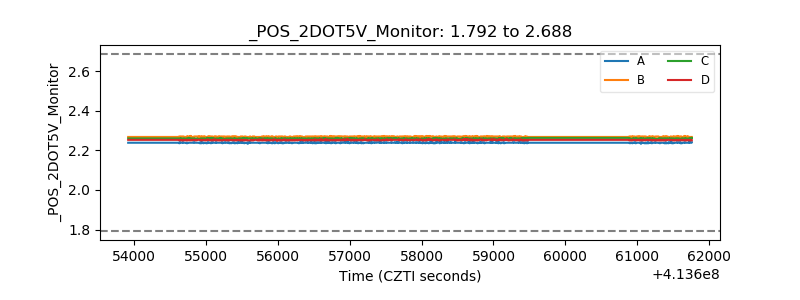 |
| +5 Volts monitor |  |
| _ROLL_ROT | 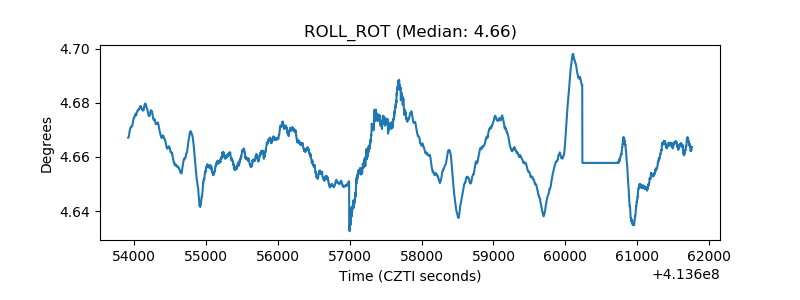 |
| _Roll_DEC | 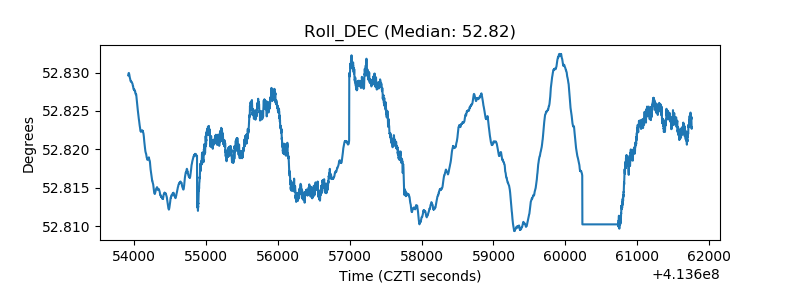 |
| _Roll_RA | 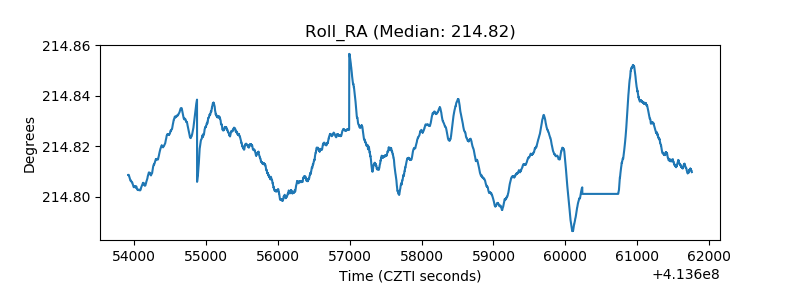 |
| Veto Counter | 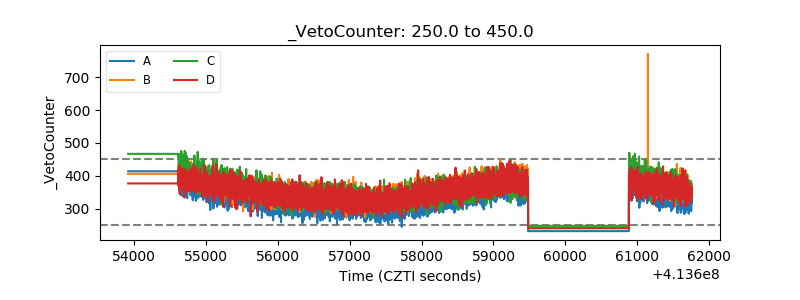 |