| Param | Original file | Final file |
|---|---|---|
| Filename | modeM0/AS1A12_022T01_9000005498_39843cztM0_level2.fits | modeM0/AS1A12_022T01_9000005498_39843cztM0_level2_quad_clean.evt |
| Size (bytes) | 441,820,800 | 94,466,880 |
| Size | 421.4 MB | 90.1 MB |
| Events in quadrant A | 3,179,955 | 642,888 |
| Events in quadrant B | 3,074,394 | 639,404 |
| Events in quadrant C | 5,817,798 | 598,820 |
| Events in quadrant D | 3,827,464 | 569,350 |
| Mode M0 | |||
|---|---|---|---|
| Quadrant | BADHDUFLAG | Total packets | Discarded packets |
| A | 0 | 13299 | 3 |
| B | 0 | 13393 | 4 |
| C | 0 | 21403 | 2 |
| D | 0 | 15334 | 2 |
| Mode M9 | |||
|---|---|---|---|
| Quadrant | BADHDUFLAG | Total packets | Discarded packets |
| A | 0 | 13 | 0 |
| B | 0 | 13 | 0 |
| C | 0 | 13 | 0 |
| D | 0 | 14 | 0 |
| Mode SS | |||
|---|---|---|---|
| Quadrant | BADHDUFLAG | Total packets | Discarded packets |
| A | 0 | 120 | 0 |
| B | 0 | 120 | 0 |
| C | 0 | 120 | 0 |
| D | 0 | 120 | 0 |
| Quadrant | Total seconds | Saturated seconds | Saturation percentage |
|---|---|---|---|
| A | 5862 | 31 | 0.528830% |
| B | 5861 | 177 | 3.019962% |
| C | 5862 | 333 | 5.680655% |
| D | 5862 | 152 | 2.592972% |
Noise dominated data is calculated using 1-second bins in cleaned event files. If a bin has >2000 counts, and if more than 50% of those come from <1% of pixels, then it is considered to be noise-dominated and hence unusable.
| Quadrant | # 1 sec bins | Bins with >0 counts | Bins with >2000 counts | High rate bins dominated by noise | Noise dominated (total time) | Noise dominated (detector-on time) | Marked lightcurve |
|---|---|---|---|---|---|---|---|
| A | 7174 | 5863 | 14 | 14 | 0.20% | 0.24% | 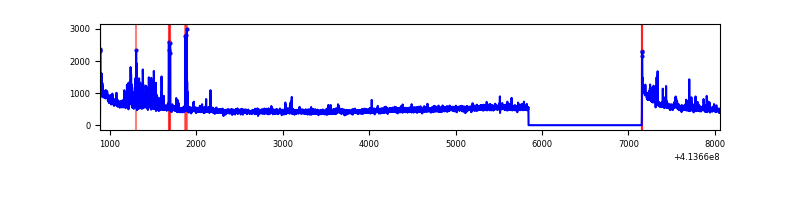 |
| B | 7174 | 5863 | 129 | 129 | 1.80% | 2.20% | 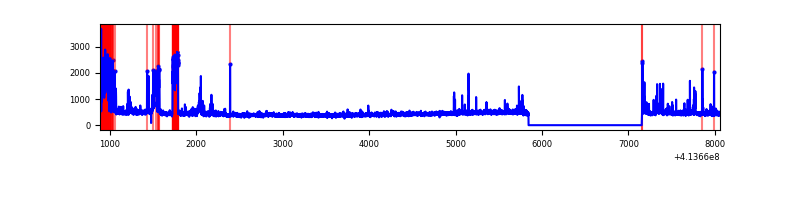 |
| C | 7174 | 5863 | 322 | 322 | 4.49% | 5.49% | 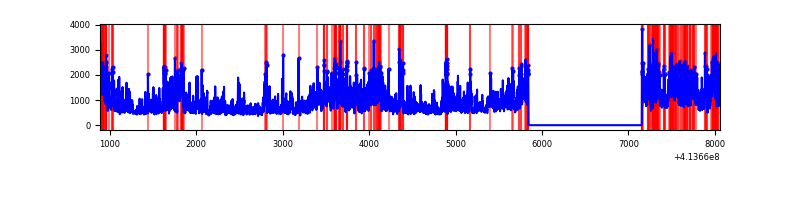 |
| D | 7174 | 5863 | 165 | 165 | 2.30% | 2.81% | 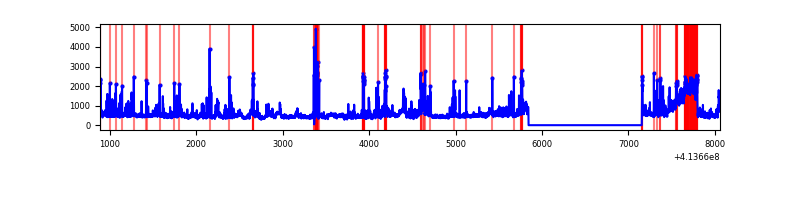 |
Top three noisy pixels from each quadrant. If the there are fewer than three noisy pixels in the level2.evt file, extra rows are filled as -1
| Pixel properties | Quadrant properties | ||||||
|---|---|---|---|---|---|---|---|
| Quadrant | DetID | PixID | Counts | Sigma | Mean | Median | Sigma |
| A | 10 | 83 | 505523 | 3895.92 | 632 | 616 | 129.6 |
| A | 13 | 248 | 198966 | 1530.49 | 632 | 616 | 129.6 |
| A | 2 | 79 | 10395 | 75.45 | 632 | 616 | 129.6 |
| B | 5 | 32 | 326424 | 2673.38 | 623 | 604 | 121.9 |
| B | 4 | 67 | 125751 | 1026.84 | 623 | 604 | 121.9 |
| B | 5 | 172 | 80199 | 653.08 | 623 | 604 | 121.9 |
| C | 9 | 187 | 2421340 | 17128.59 | 604 | 606 | 141.3 |
| C | 15 | 208 | 724725 | 5123.71 | 604 | 606 | 141.3 |
| C | 15 | 214 | 242686 | 1712.91 | 604 | 606 | 141.3 |
| D | 2 | 249 | 691370 | 4627.55 | 610 | 592 | 149.3 |
| D | 7 | 38 | 216692 | 1447.66 | 610 | 592 | 149.3 |
| D | 12 | 233 | 167862 | 1120.55 | 610 | 592 | 149.3 |
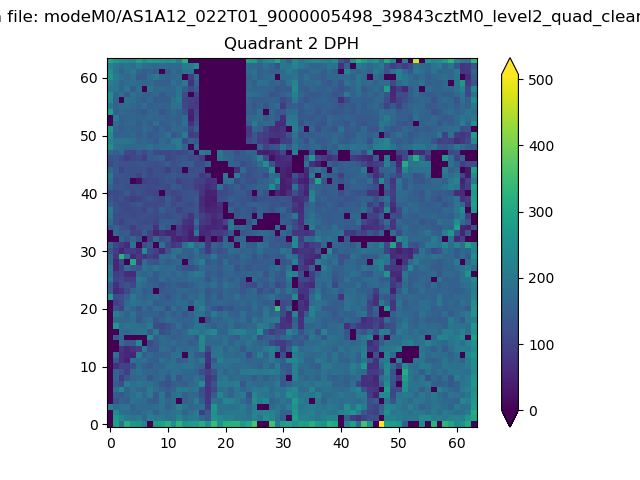
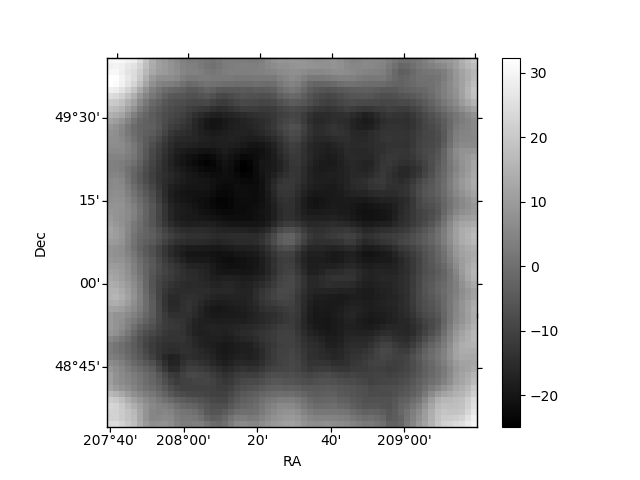
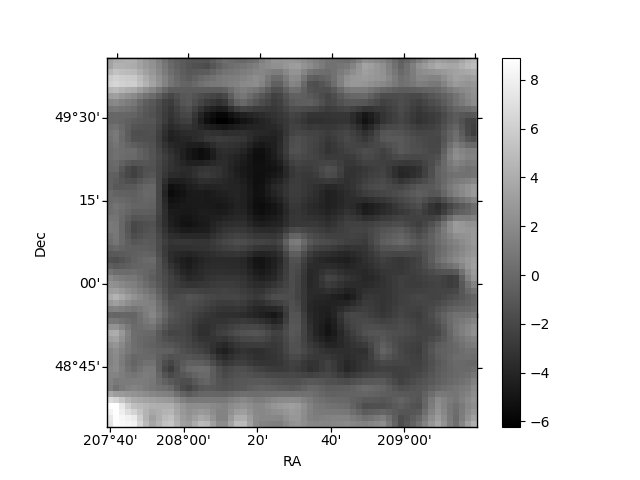
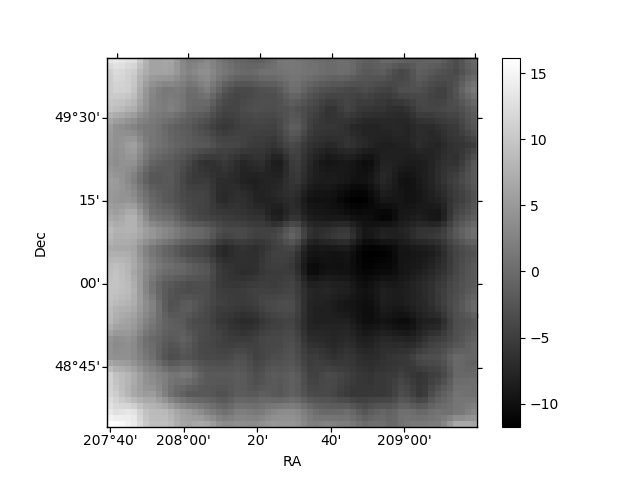
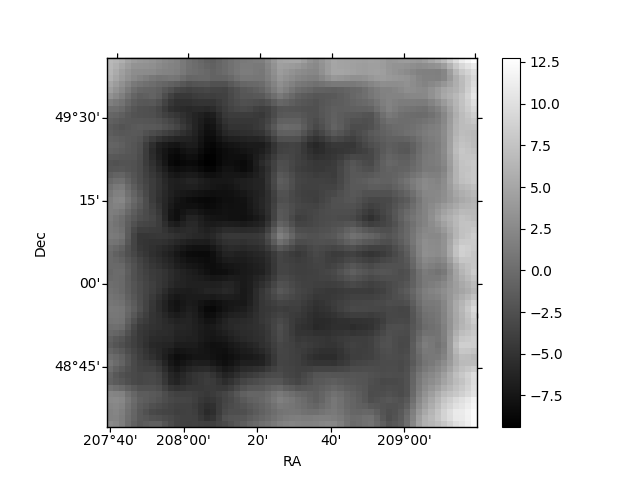
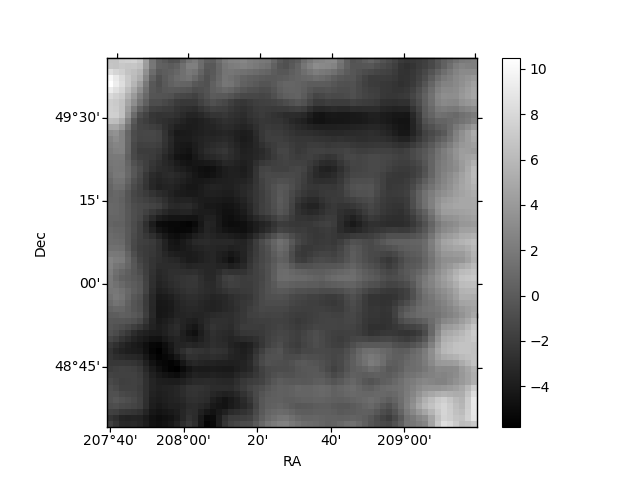
Histogram calculated using DETX and DETY for each event in the final _common_clean file
| Quadrant A | 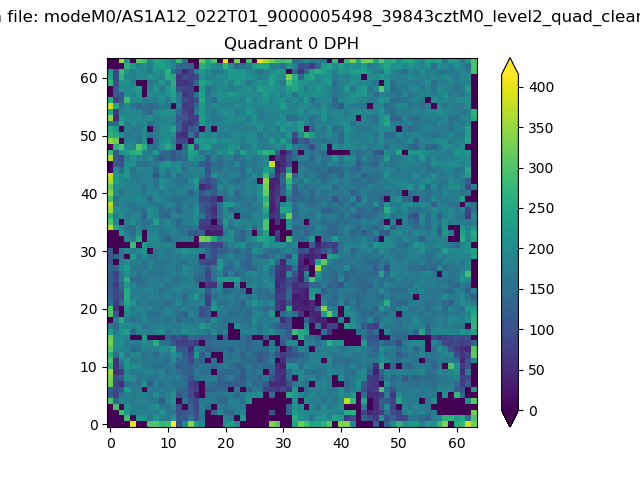 |
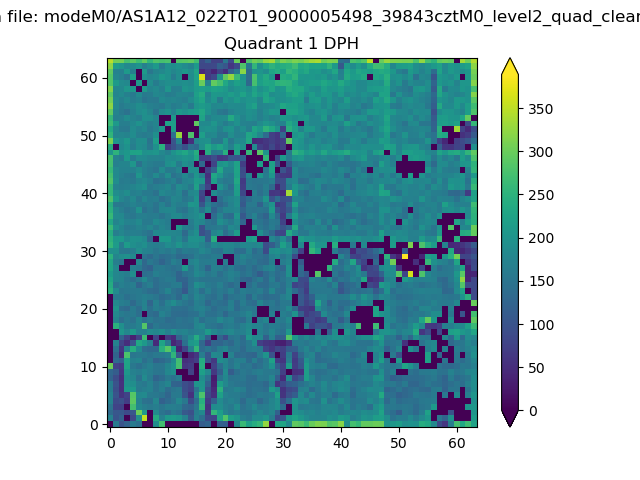 |
Quadrant B |
|---|---|---|---|
| Quadrant D | 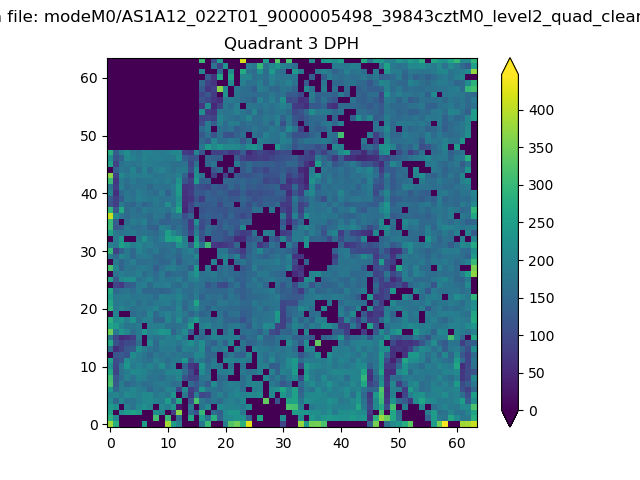 |
 |
Quadrant C |
| Plot type | Count rate plots | Images |
|---|---|---|
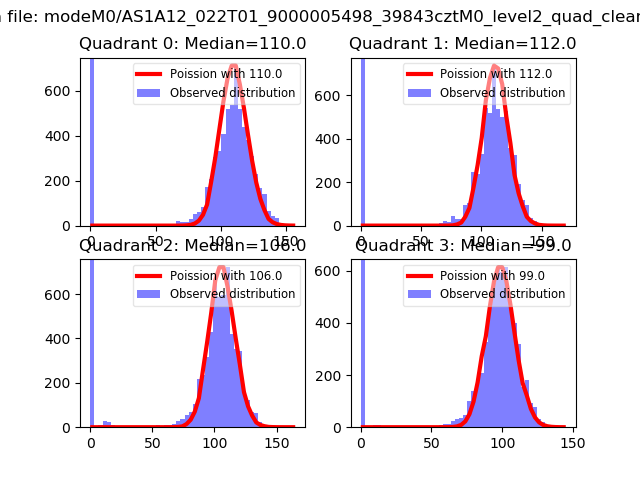
| Comparison with Poisson distribution Blue bars denote a histogram of data divided into 1 sec bins. Red curve is a Poisson curve with rate = median count rate of data. |
 |
 |
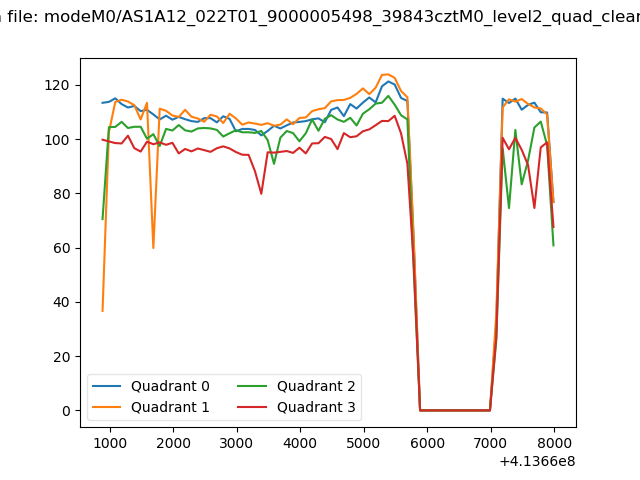
| Quadrant-wise count rates Data is divided into 100 sec bins |
 |
|
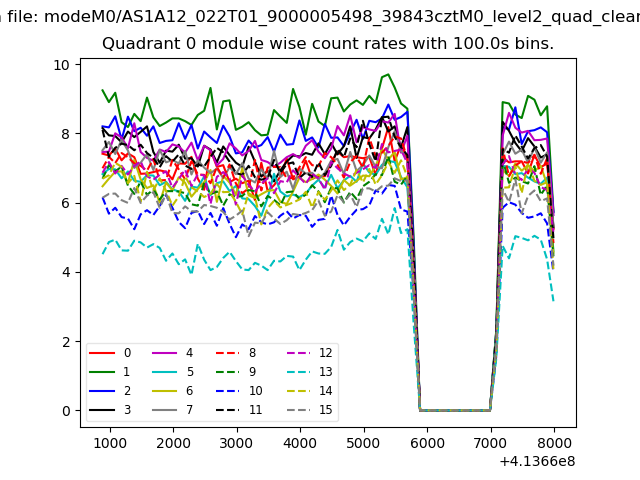
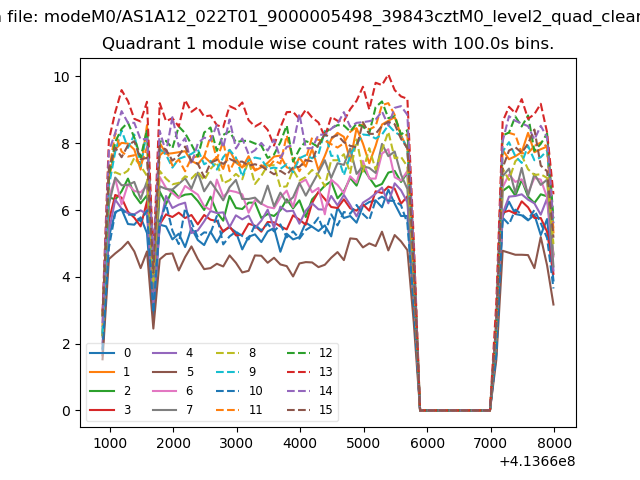
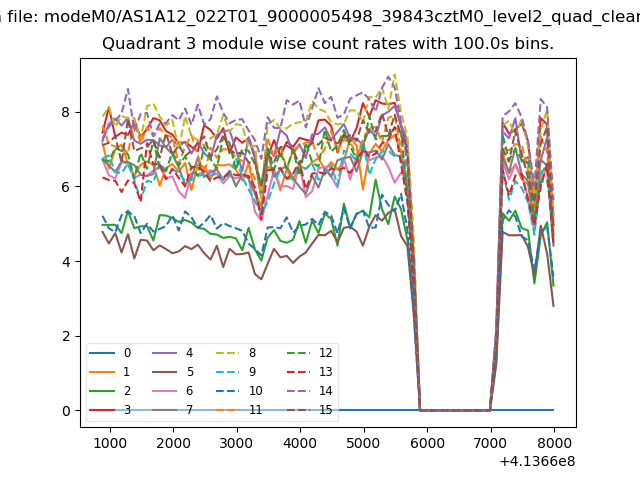
| Module-wise count rates for Quadrant A Data is divided into 100 sec bins |
 |
 |
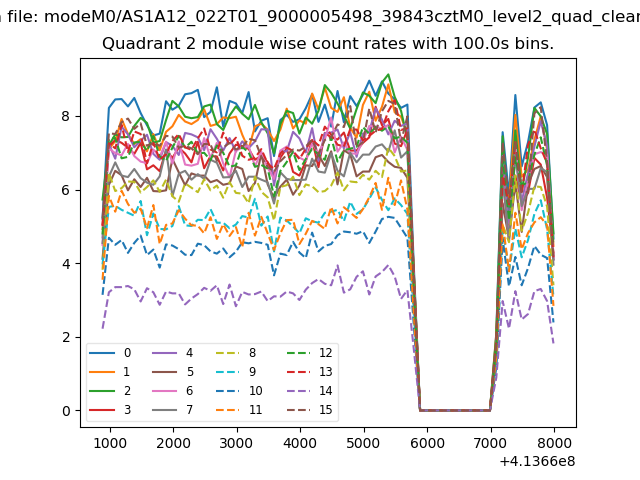
| Module-wise count rates for Quadrant B Data is divided into 100 sec bins |
 |
 |
| Module-wise count rates for Quadrant C Data is divided into 100 sec bins |
 |
 |
| Module-wise count rates for Quadrant D Data is divided into 100 sec bins |
 |
 |
| Parameter | Plot |
|---|---|
| CZT HV Monitor |  |
| D_VDD | 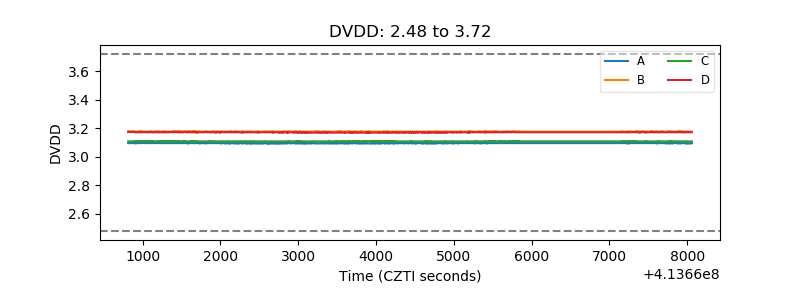 |
| Temperature 1 | 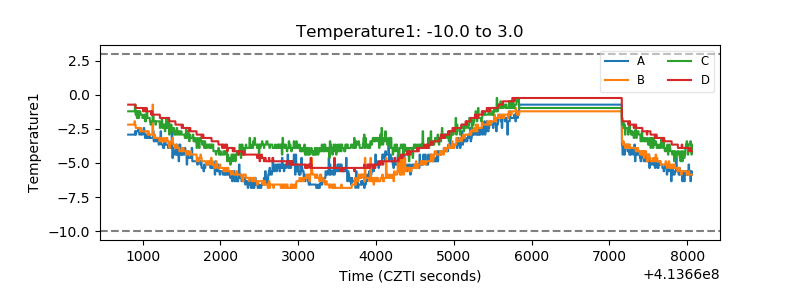 |
| Veto HV Monitor | 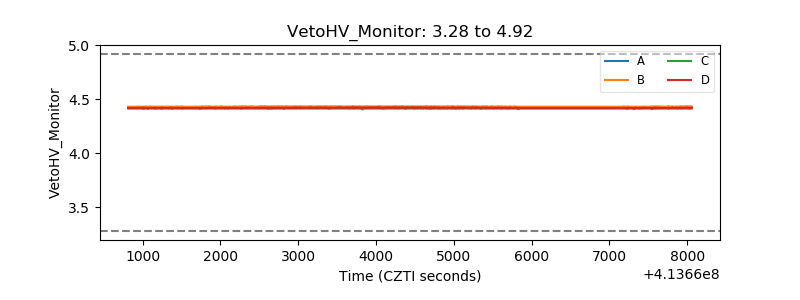 |
| Veto LLD | 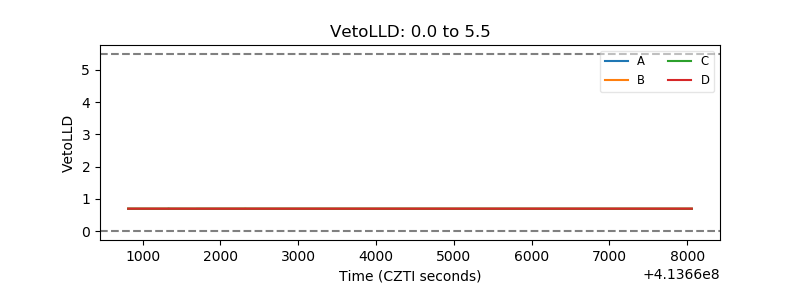 |
| Alpha Counter | 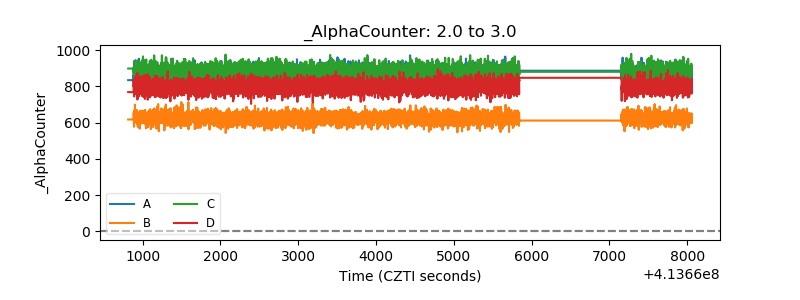 |
| _CPM_Rate | 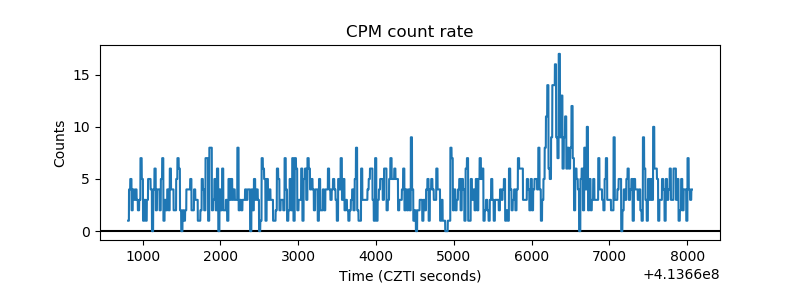 |
| CZT Counter | 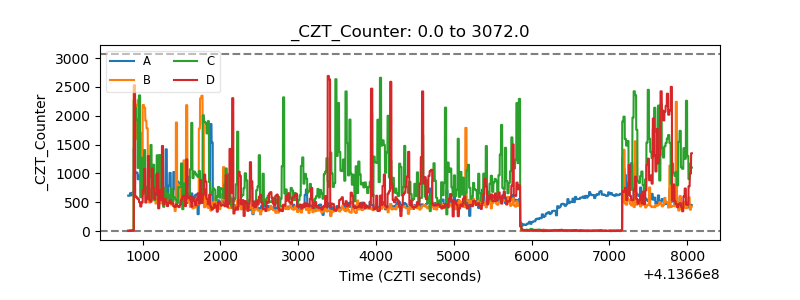 |
| +2.5 Volts monitor | 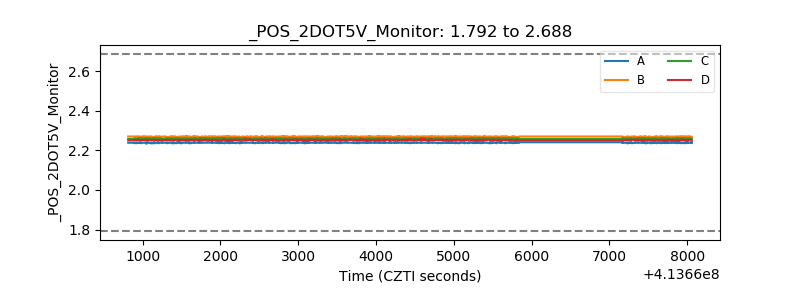 |
| +5 Volts monitor | 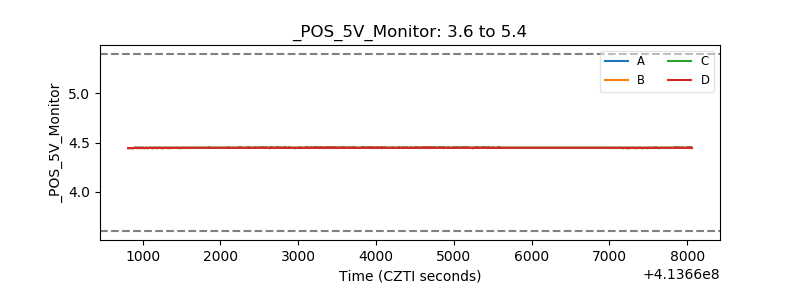 |
| _ROLL_ROT | 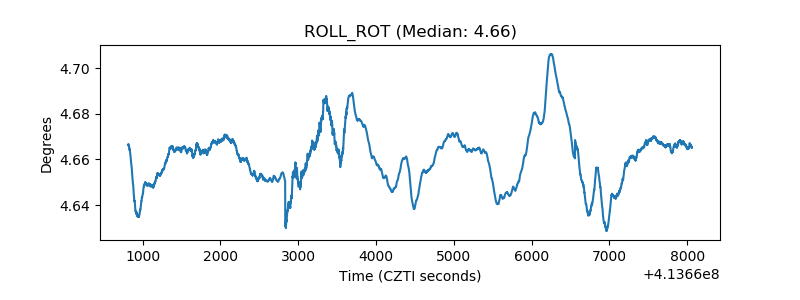 |
| _Roll_DEC | 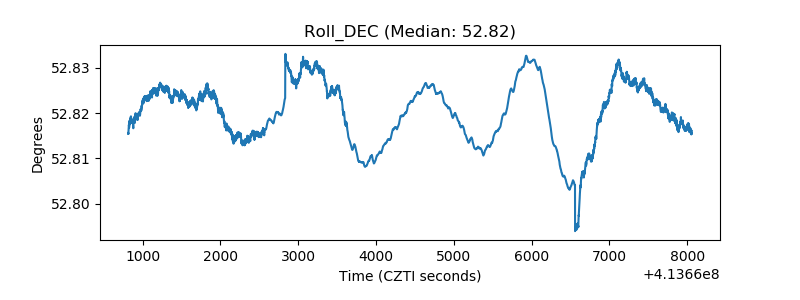 |
| _Roll_RA | 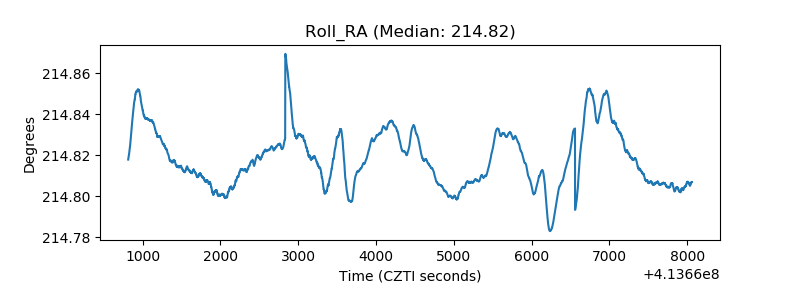 |
| Veto Counter | 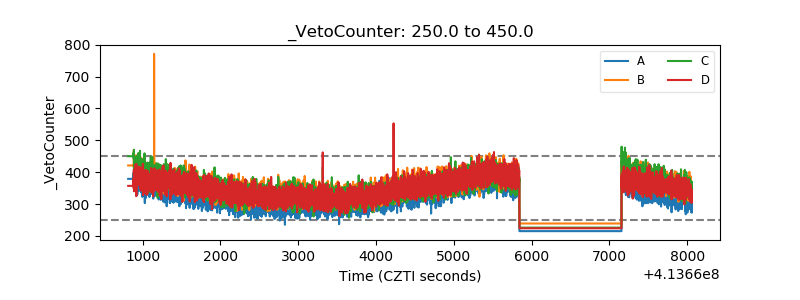 |