| Param | Original file | Final file |
|---|---|---|
| Filename | modeM0/AS1A12_022T01_9000005498_39853cztM0_level2.fits | modeM0/AS1A12_022T01_9000005498_39853cztM0_level2_quad_clean.evt |
| Size (bytes) | 2,094,255,360 | 341,533,440 |
| Size | 2.0 GB | 325.7 MB |
| Events in quadrant A | 11,568,608 | 2,563,713 |
| Events in quadrant B | 26,121,486 | 1,888,929 |
| Events in quadrant C | 25,021,309 | 2,225,436 |
| Events in quadrant D | 13,149,928 | 2,178,708 |
| Mode M0 | |||
|---|---|---|---|
| Quadrant | BADHDUFLAG | Total packets | Discarded packets |
| A | 0 | 46833 | 5 |
| B | 0 | 92734 | 4 |
| C | 0 | 89414 | 4 |
| D | 0 | 54164 | 4 |
| Mode M9 | |||
|---|---|---|---|
| Quadrant | BADHDUFLAG | Total packets | Discarded packets |
| A | 0 | 98 | 0 |
| B | 0 | 98 | 0 |
| C | 0 | 98 | 0 |
| D | 0 | 98 | 0 |
| Mode SS | |||
|---|---|---|---|
| Quadrant | BADHDUFLAG | Total packets | Discarded packets |
| A | 0 | 442 | 0 |
| B | 0 | 442 | 0 |
| C | 0 | 442 | 0 |
| D | 0 | 442 | 0 |
| Quadrant | Total seconds | Saturated seconds | Saturation percentage |
|---|---|---|---|
| A | 21554 | 122 | 0.566020% |
| B | 21554 | 5987 | 27.776747% |
| C | 21554 | 2198 | 10.197643% |
| D | 21554 | 963 | 4.467848% |
Noise dominated data is calculated using 1-second bins in cleaned event files. If a bin has >2000 counts, and if more than 50% of those come from <1% of pixels, then it is considered to be noise-dominated and hence unusable.
| Quadrant | # 1 sec bins | Bins with >0 counts | Bins with >2000 counts | High rate bins dominated by noise | Noise dominated (total time) | Noise dominated (detector-on time) | Marked lightcurve |
|---|---|---|---|---|---|---|---|
| A | 31361 | 21559 | 93 | 93 | 0.30% | 0.43% | 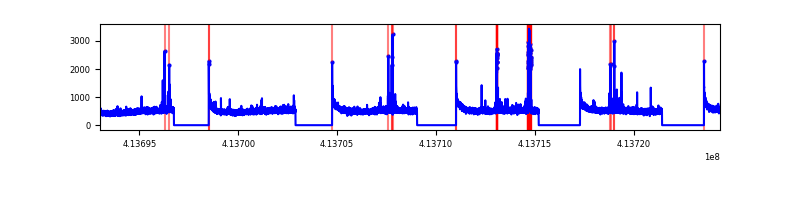 |
| B | 31361 | 21559 | 4925 | 4925 | 15.70% | 22.84% | 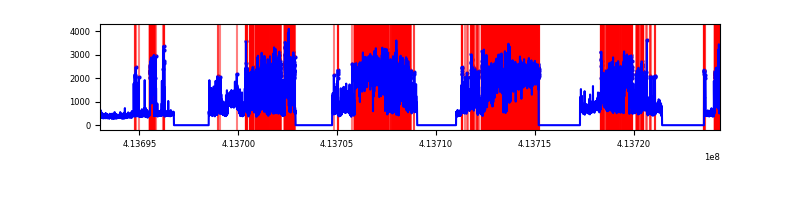 |
| C | 31361 | 21559 | 2268 | 2268 | 7.23% | 10.52% | 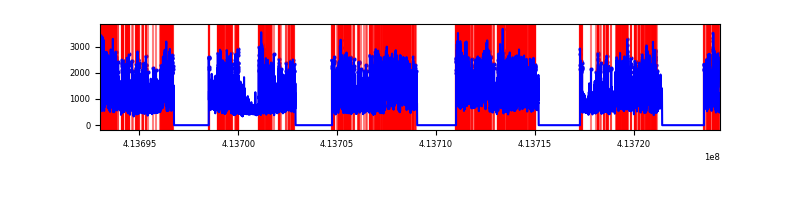 |
| D | 31361 | 21559 | 790 | 790 | 2.52% | 3.66% | 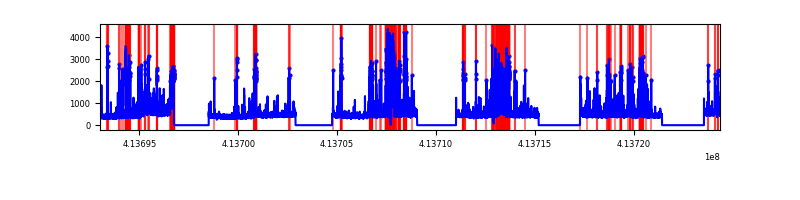 |
Top three noisy pixels from each quadrant. If the there are fewer than three noisy pixels in the level2.evt file, extra rows are filled as -1
| Pixel properties | Quadrant properties | ||||||
|---|---|---|---|---|---|---|---|
| Quadrant | DetID | PixID | Counts | Sigma | Mean | Median | Sigma |
| A | 10 | 83 | 1632355 | 3318.43 | 2442 | 2397 | 491.2 |
| A | 7 | 3 | 208055 | 418.7 | 2442 | 2397 | 491.2 |
| A | 13 | 248 | 163483 | 327.95 | 2442 | 2397 | 491.2 |
| B | 4 | 170 | 17492351 | 44023.63 | 2117 | 2062 | 397.3 |
| B | 5 | 255 | 85862 | 210.93 | 2117 | 2062 | 397.3 |
| B | 15 | 85 | 80318 | 196.97 | 2117 | 2062 | 397.3 |
| C | 9 | 187 | 10807457 | 20840.18 | 2264 | 2278 | 518.5 |
| C | 15 | 208 | 4300266 | 8289.62 | 2264 | 2278 | 518.5 |
| C | 15 | 214 | 882778 | 1698.24 | 2264 | 2278 | 518.5 |
| D | 7 | 38 | 1392828 | 2500.44 | 2306 | 2242 | 556.1 |
| D | 12 | 233 | 1165517 | 2091.7 | 2306 | 2242 | 556.1 |
| D | 2 | 250 | 529463 | 948.0 | 2306 | 2242 | 556.1 |
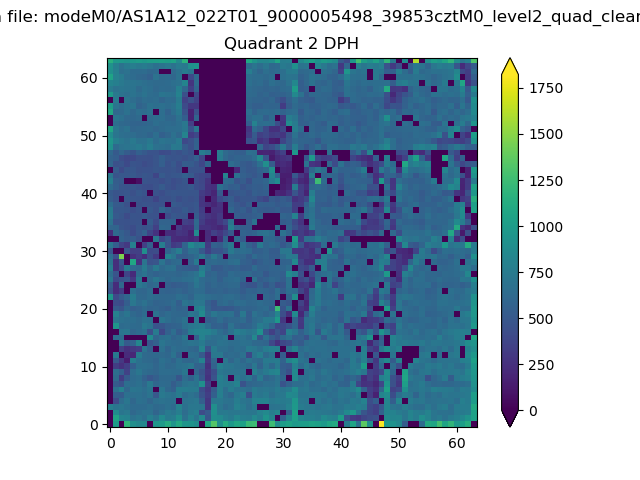
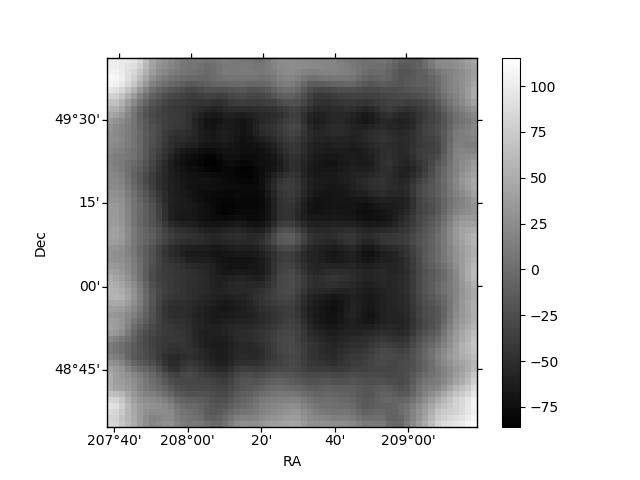
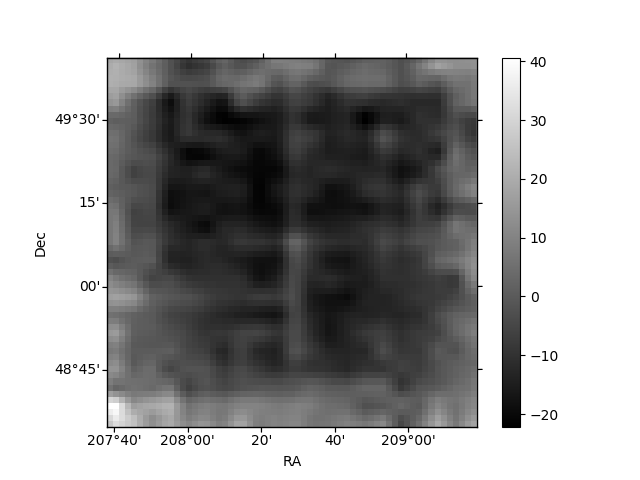
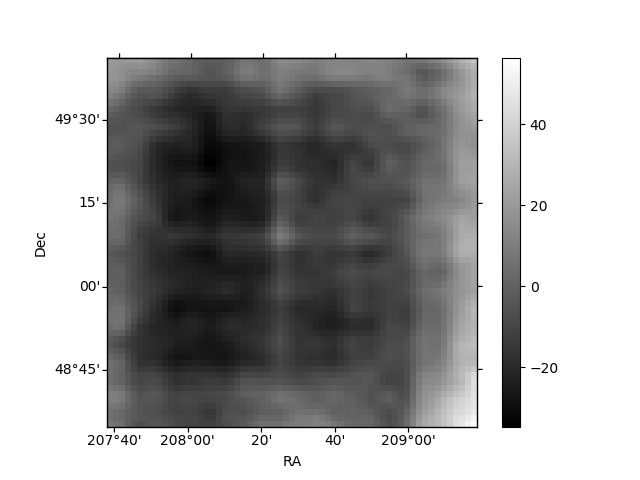
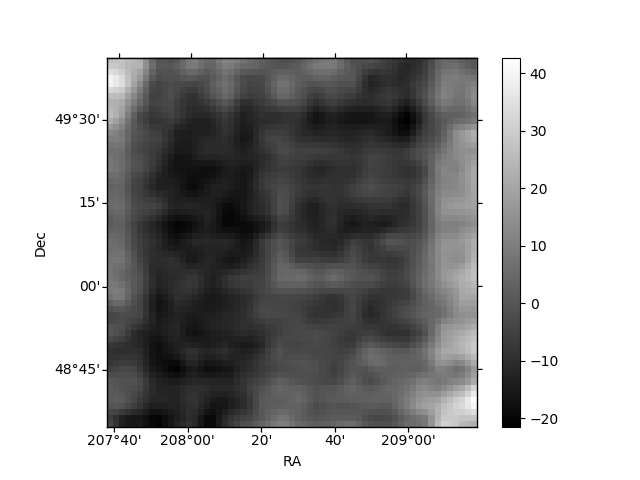
Histogram calculated using DETX and DETY for each event in the final _common_clean file
| Quadrant A | 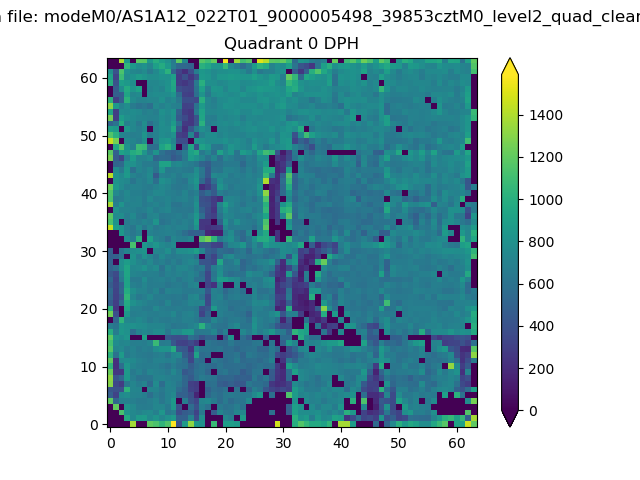 |
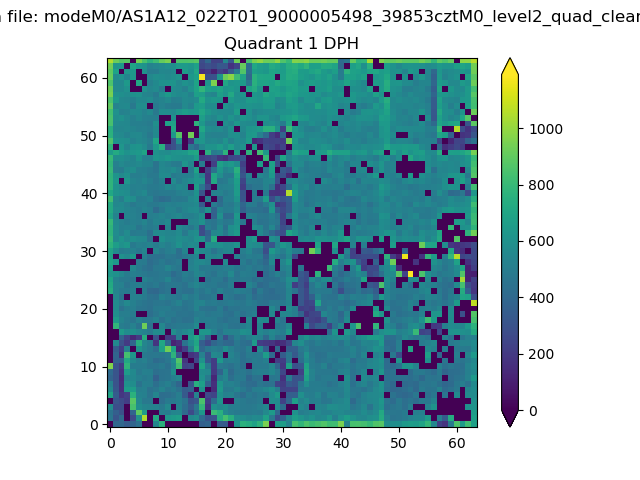 |
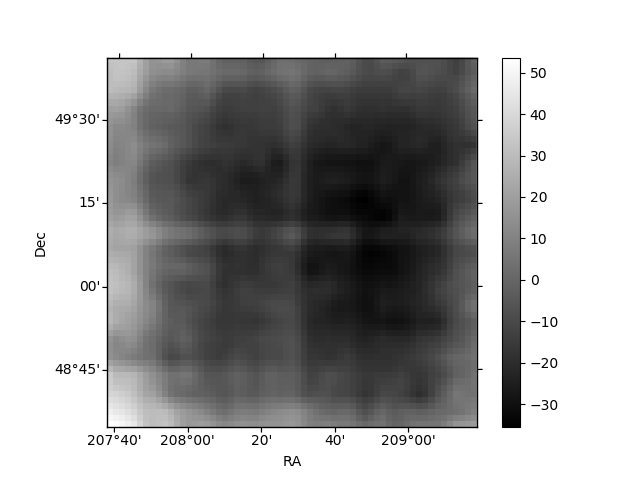
Quadrant B |
|---|---|---|---|
| Quadrant D | 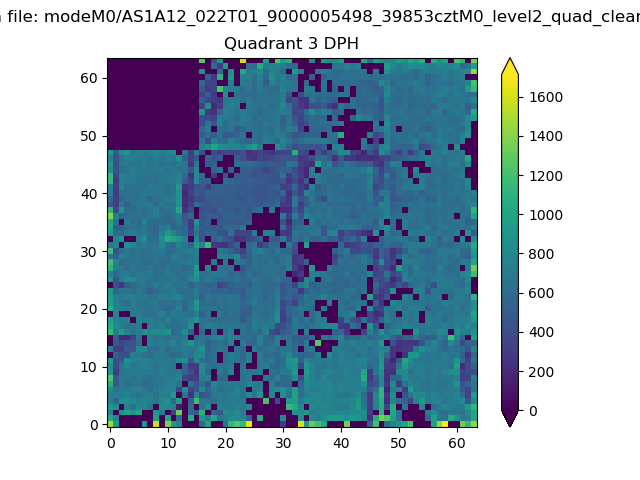 |
 |
Quadrant C |
| Plot type | Count rate plots | Images |
|---|---|---|
| Comparison with Poisson distribution Blue bars denote a histogram of data divided into 1 sec bins. Red curve is a Poisson curve with rate = median count rate of data. |
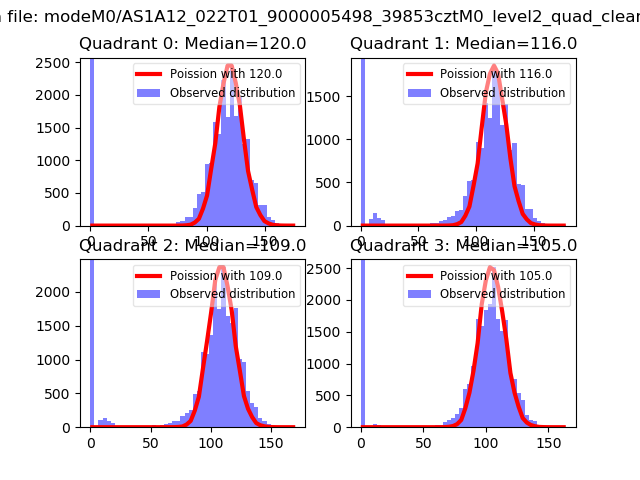 |
 |
| Quadrant-wise count rates Data is divided into 100 sec bins |
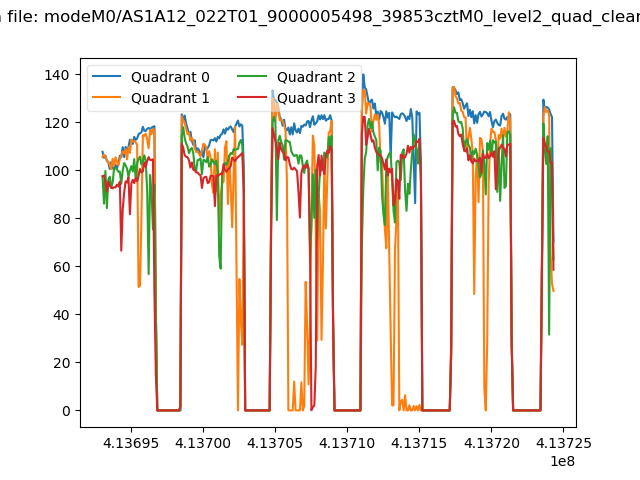 |
|
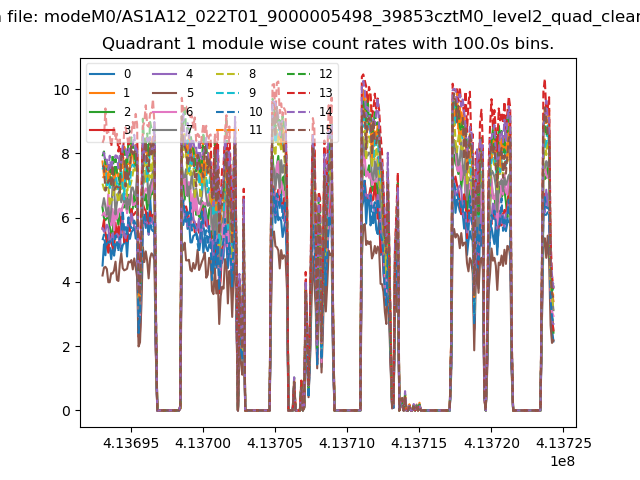
| Module-wise count rates for Quadrant A Data is divided into 100 sec bins |
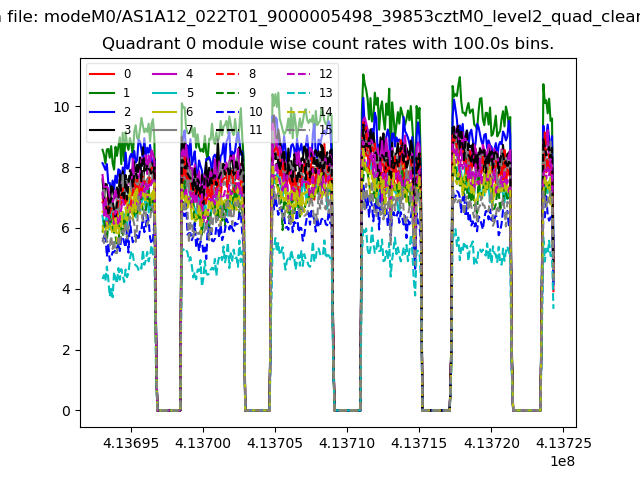 |
 |
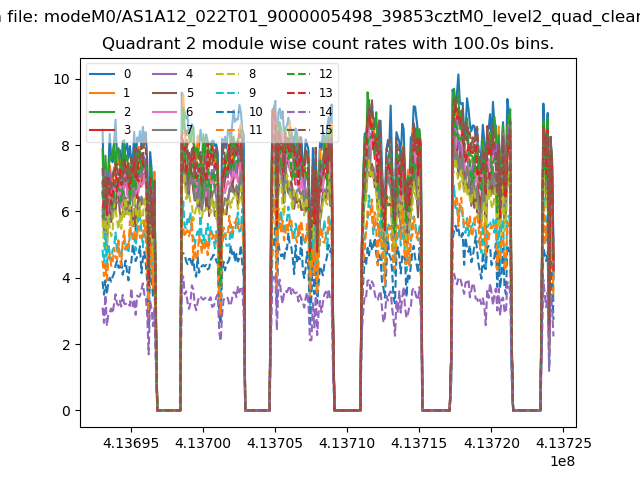
| Module-wise count rates for Quadrant B Data is divided into 100 sec bins |
 |
 |
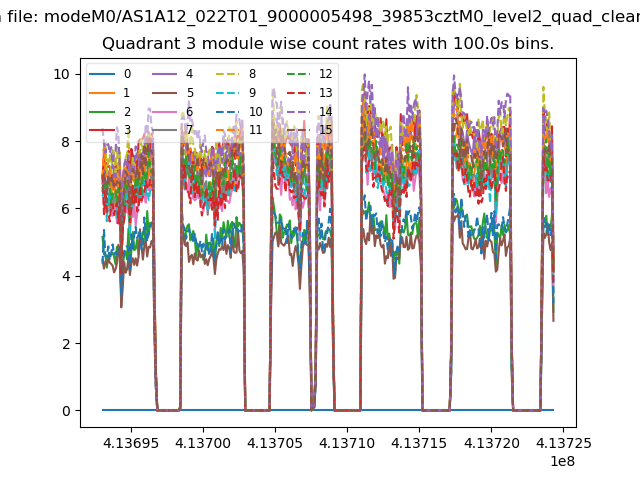
| Module-wise count rates for Quadrant C Data is divided into 100 sec bins |
 |
 |
| Module-wise count rates for Quadrant D Data is divided into 100 sec bins |
 |
 |
| Parameter | Plot |
|---|---|
| CZT HV Monitor | 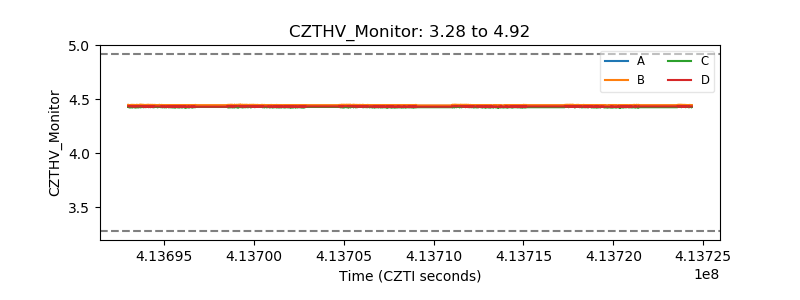 |
| D_VDD | 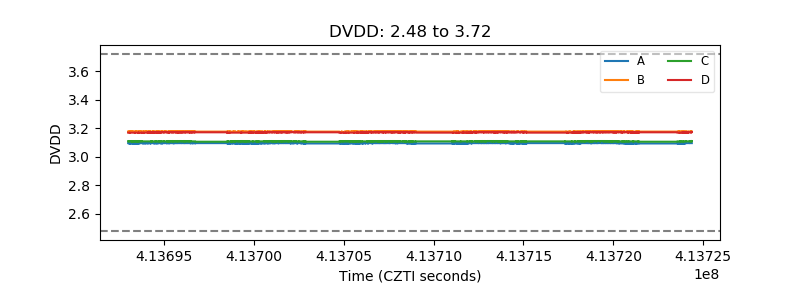 |
| Temperature 1 | 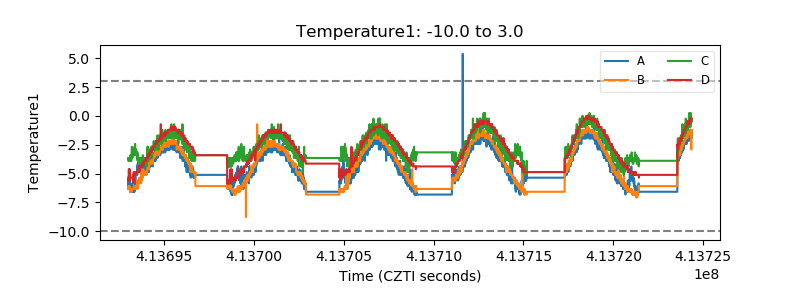 |
| Veto HV Monitor | 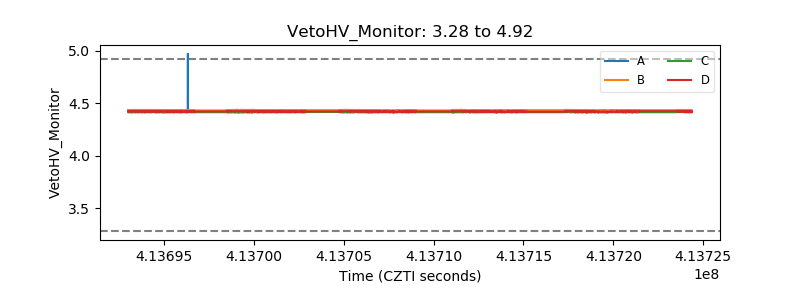 |
| Veto LLD | 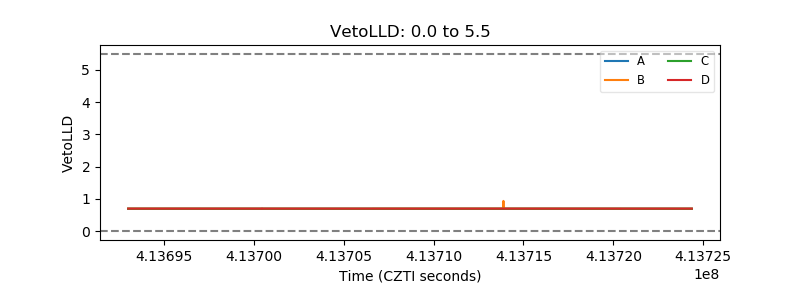 |
| Alpha Counter | 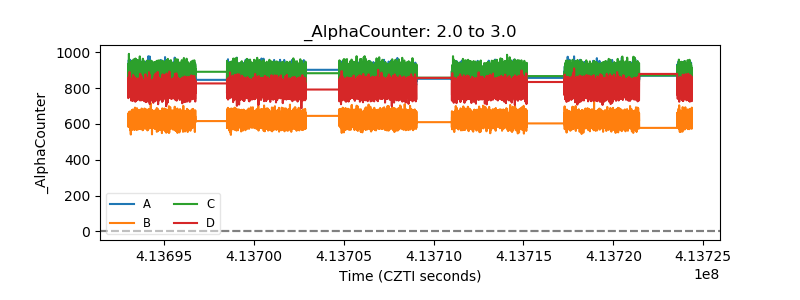 |
| _CPM_Rate | 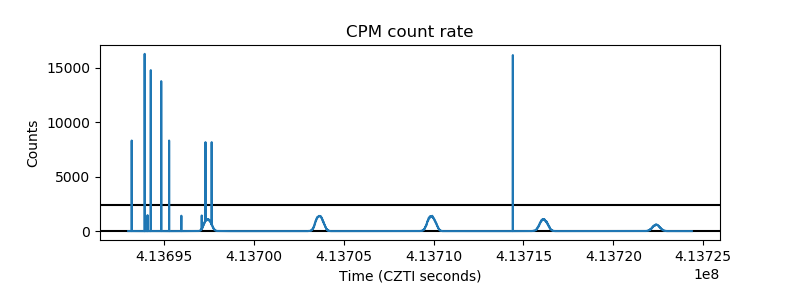 |
| CZT Counter | 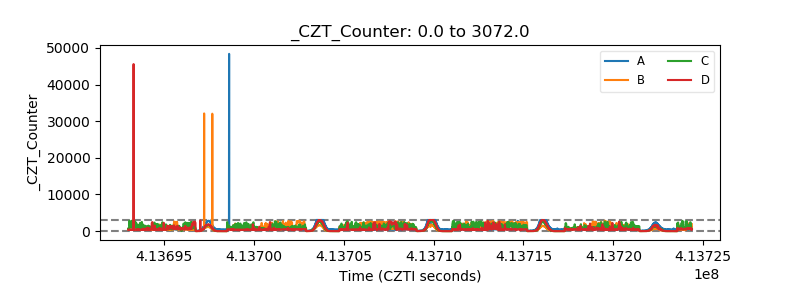 |
| +2.5 Volts monitor | 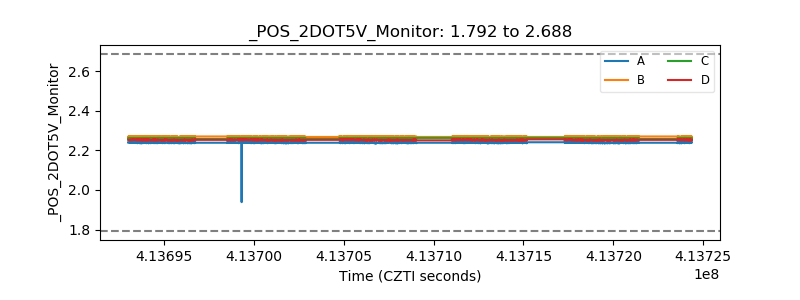 |
| +5 Volts monitor | 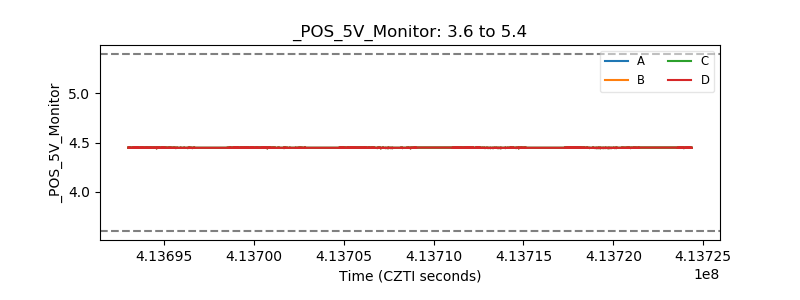 |
| _ROLL_ROT | 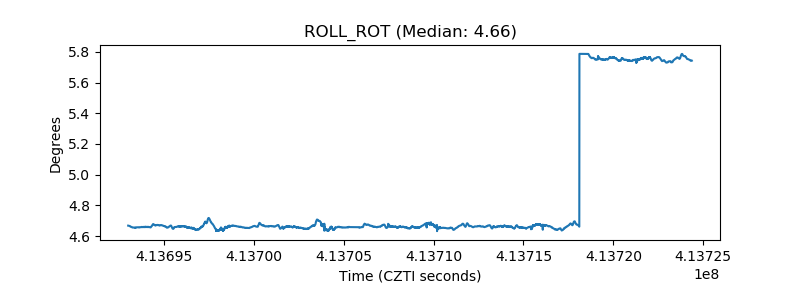 |
| _Roll_DEC | 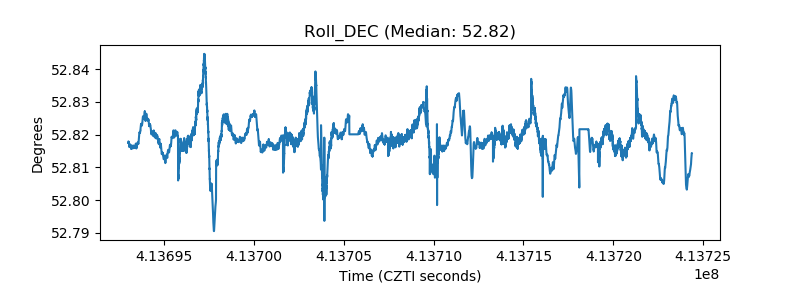 |
| _Roll_RA | 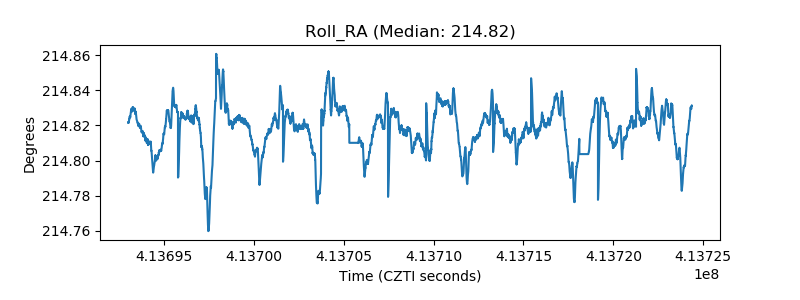 |
| Veto Counter | 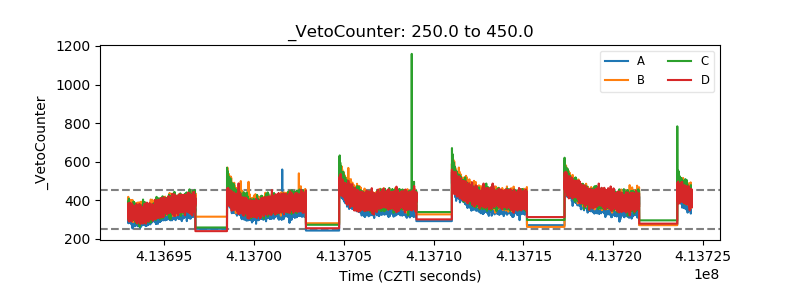 |