| Param | Original file | Final file |
|---|---|---|
| Filename | modeM0/AS1A12_022T01_9000005498_39855cztM0_level2.fits | modeM0/AS1A12_022T01_9000005498_39855cztM0_level2_quad_clean.evt |
| Size (bytes) | 468,486,720 | 86,313,600 |
| Size | 446.8 MB | 82.3 MB |
| Events in quadrant A | 2,919,969 | 612,768 |
| Events in quadrant B | 5,636,496 | 534,038 |
| Events in quadrant C | 4,695,427 | 557,559 |
| Events in quadrant D | 3,672,636 | 532,822 |
| Mode M0 | |||
|---|---|---|---|
| Quadrant | BADHDUFLAG | Total packets | Discarded packets |
| A | 0 | 12025 | 3 |
| B | 0 | 20448 | 2 |
| C | 0 | 17538 | 2 |
| D | 0 | 14699 | 2 |
| Mode M9 | |||
|---|---|---|---|
| Quadrant | BADHDUFLAG | Total packets | Discarded packets |
| A | 0 | 25 | 0 |
| B | 0 | 25 | 0 |
| C | 0 | 25 | 0 |
| D | 0 | 26 | 0 |
| Mode SS | |||
|---|---|---|---|
| Quadrant | BADHDUFLAG | Total packets | Discarded packets |
| A | 0 | 108 | 0 |
| B | 0 | 108 | 0 |
| C | 0 | 108 | 0 |
| D | 0 | 108 | 0 |
| Quadrant | Total seconds | Saturated seconds | Saturation percentage |
|---|---|---|---|
| A | 5378 | 17 | 0.316103% |
| B | 5378 | 933 | 17.348457% |
| C | 5378 | 277 | 5.150614% |
| D | 5378 | 118 | 2.194124% |
Noise dominated data is calculated using 1-second bins in cleaned event files. If a bin has >2000 counts, and if more than 50% of those come from <1% of pixels, then it is considered to be noise-dominated and hence unusable.
| Quadrant | # 1 sec bins | Bins with >0 counts | Bins with >2000 counts | High rate bins dominated by noise | Noise dominated (total time) | Noise dominated (detector-on time) | Marked lightcurve |
|---|---|---|---|---|---|---|---|
| A | 7260 | 5379 | 11 | 11 | 0.15% | 0.20% | 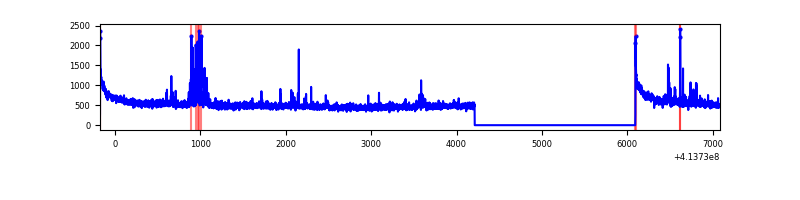 |
| B | 7260 | 5379 | 813 | 813 | 11.20% | 15.11% | 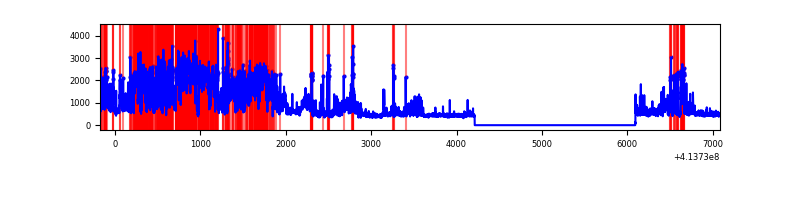 |
| C | 7260 | 5379 | 261 | 261 | 3.60% | 4.85% | 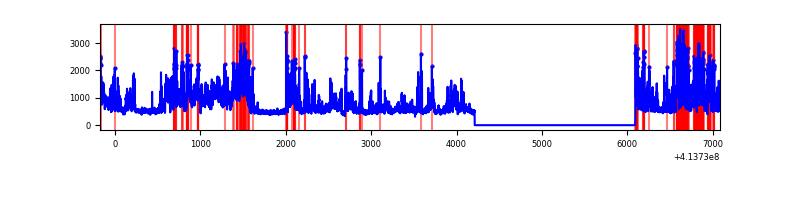 |
| D | 7260 | 5379 | 101 | 101 | 1.39% | 1.88% | 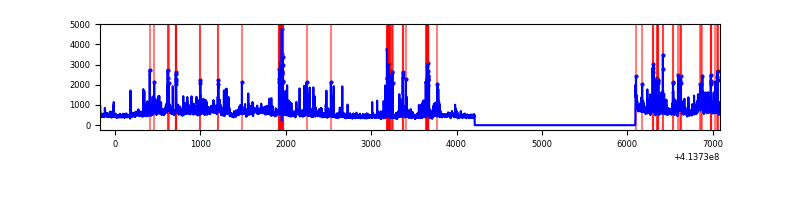 |
Top three noisy pixels from each quadrant. If the there are fewer than three noisy pixels in the level2.evt file, extra rows are filled as -1
| Pixel properties | Quadrant properties | ||||||
|---|---|---|---|---|---|---|---|
| Quadrant | DetID | PixID | Counts | Sigma | Mean | Median | Sigma |
| A | 10 | 83 | 493499 | 4104.51 | 590 | 578 | 120.1 |
| A | 13 | 248 | 107313 | 888.77 | 590 | 578 | 120.1 |
| A | 2 | 79 | 13202 | 105.12 | 590 | 578 | 120.1 |
| B | 4 | 170 | 3293954 | 30750.07 | 553 | 538 | 107.1 |
| B | 0 | 230 | 53038 | 490.18 | 553 | 538 | 107.1 |
| B | 5 | 32 | 32541 | 298.81 | 553 | 538 | 107.1 |
| C | 15 | 208 | 1324235 | 10112.41 | 561 | 564 | 130.9 |
| C | 9 | 187 | 855391 | 6530.6 | 561 | 564 | 130.9 |
| C | 15 | 214 | 225754 | 1720.38 | 561 | 564 | 130.9 |
| D | 1 | 52 | 364371 | 2609.81 | 570 | 553 | 139.4 |
| D | 12 | 227 | 254649 | 1822.73 | 570 | 553 | 139.4 |
| D | 7 | 38 | 216626 | 1549.98 | 570 | 553 | 139.4 |
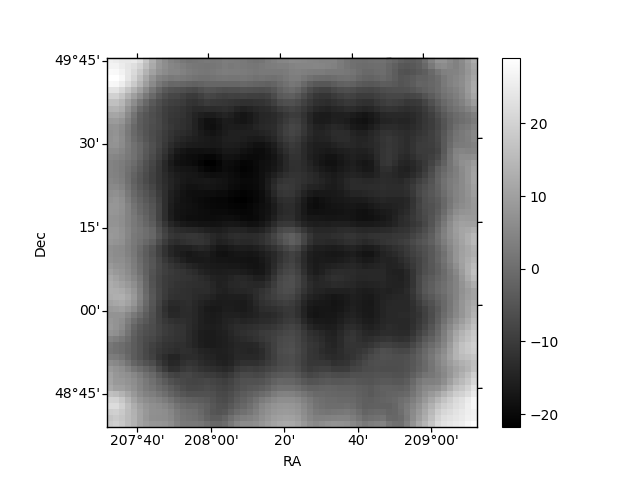
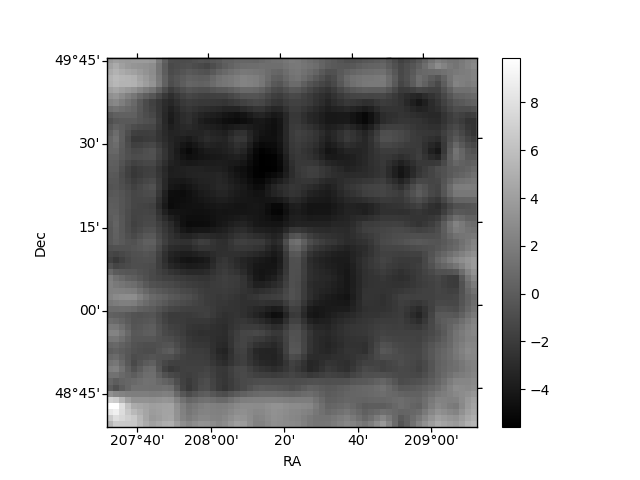
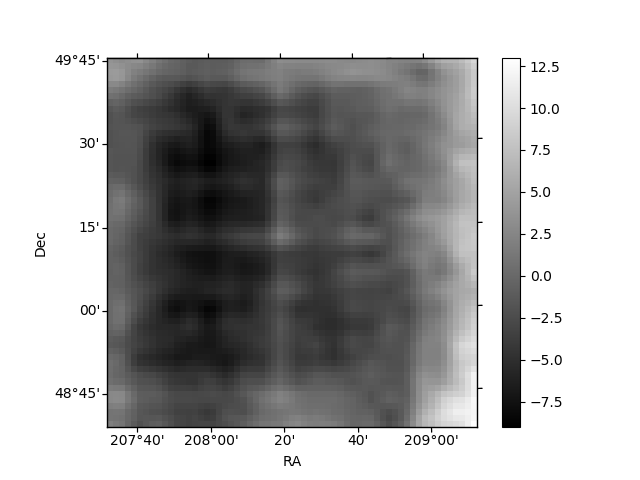
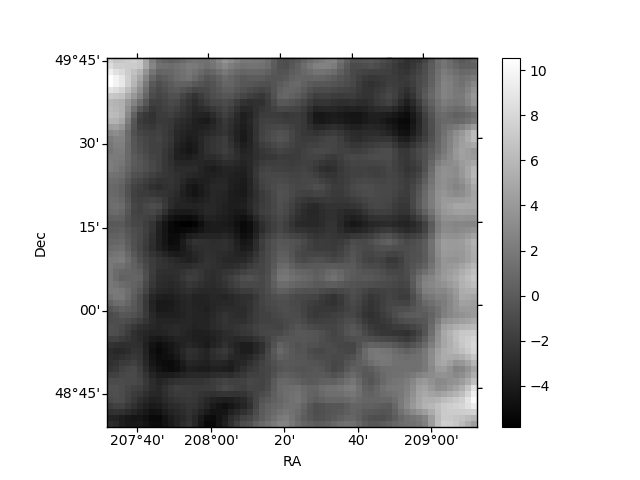
Histogram calculated using DETX and DETY for each event in the final _common_clean file
| Quadrant A | 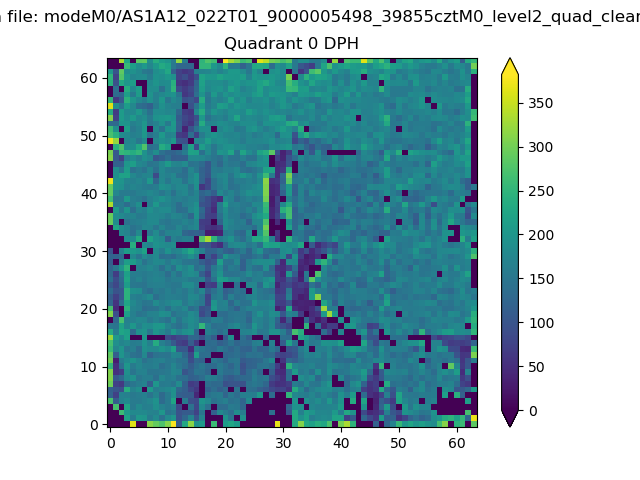 |
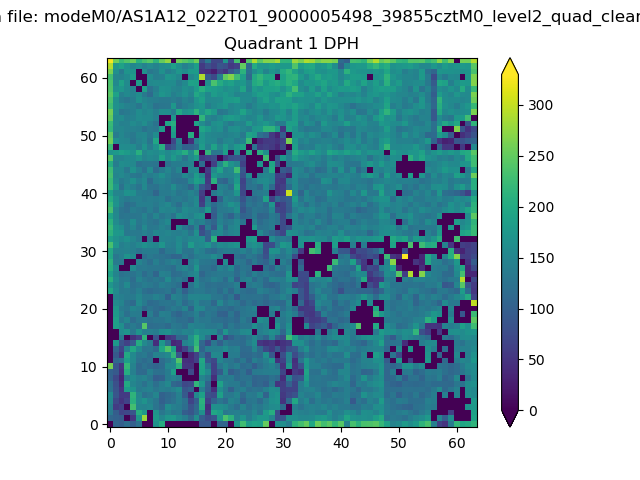 |
Quadrant B |
|---|---|---|---|
| Quadrant D | 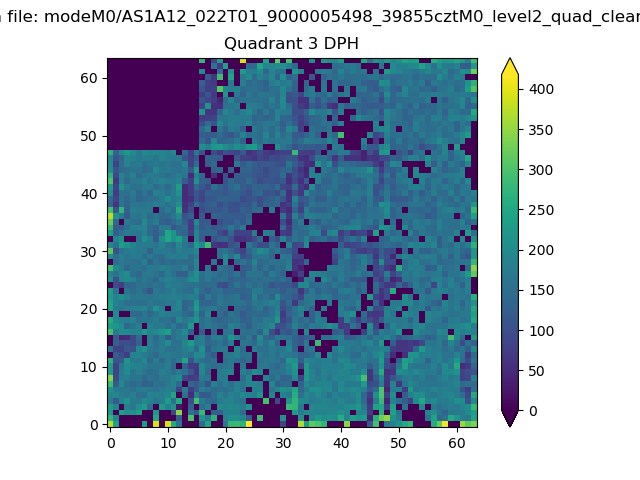 |
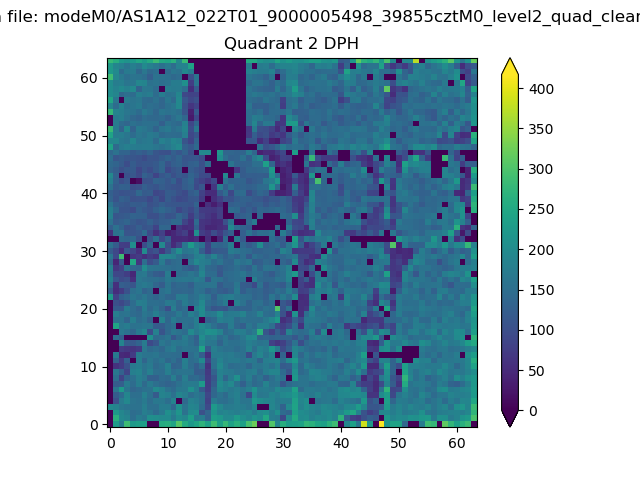 |
Quadrant C |
| Plot type | Count rate plots | Images |
|---|---|---|
| Comparison with Poisson distribution Blue bars denote a histogram of data divided into 1 sec bins. Red curve is a Poisson curve with rate = median count rate of data. |
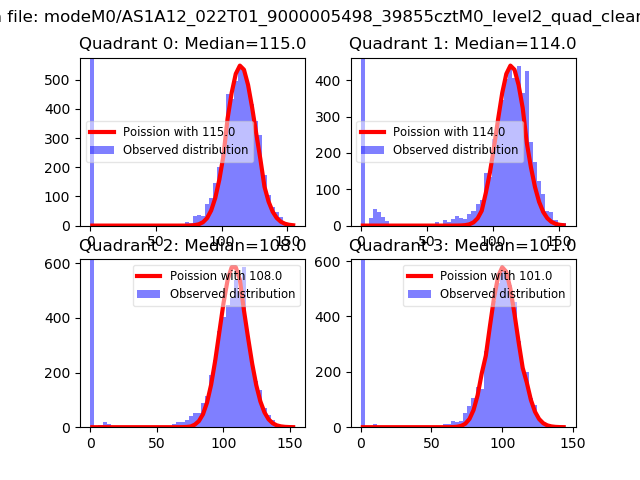 |
 |
| Quadrant-wise count rates Data is divided into 100 sec bins |
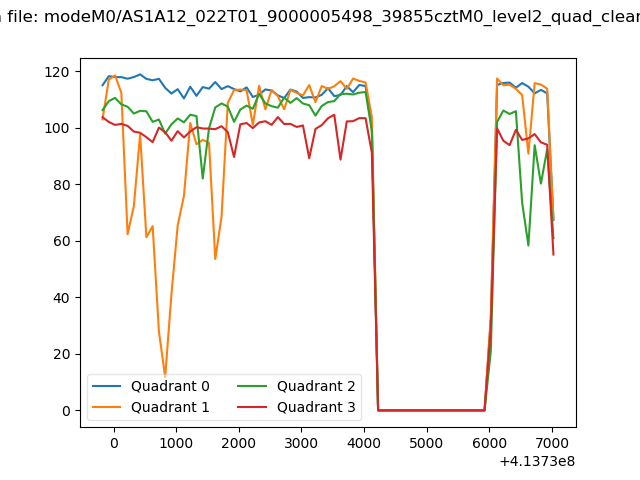 |
|
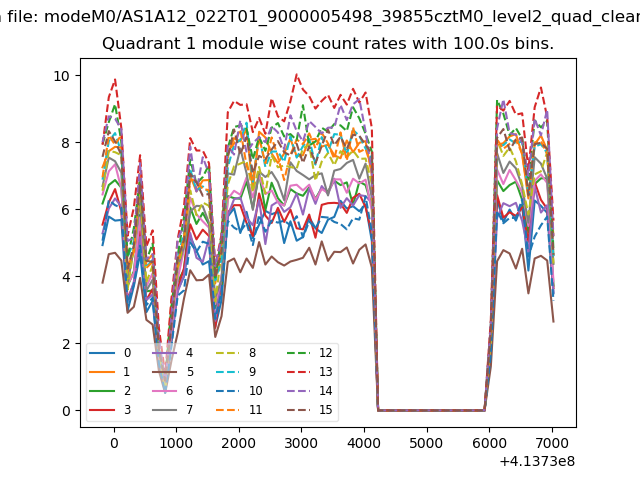
| Module-wise count rates for Quadrant A Data is divided into 100 sec bins |
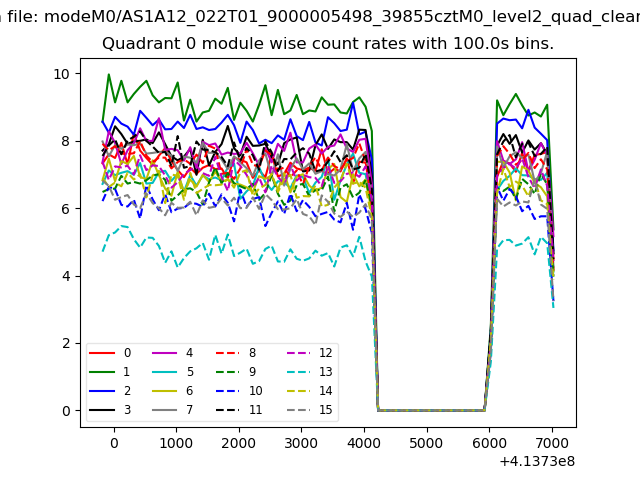 |
 |
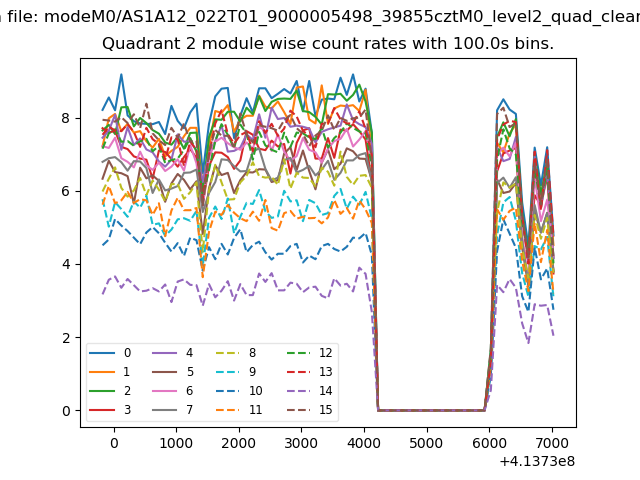
| Module-wise count rates for Quadrant B Data is divided into 100 sec bins |
 |
 |
| Module-wise count rates for Quadrant C Data is divided into 100 sec bins |
 |
 |
| Module-wise count rates for Quadrant D Data is divided into 100 sec bins |
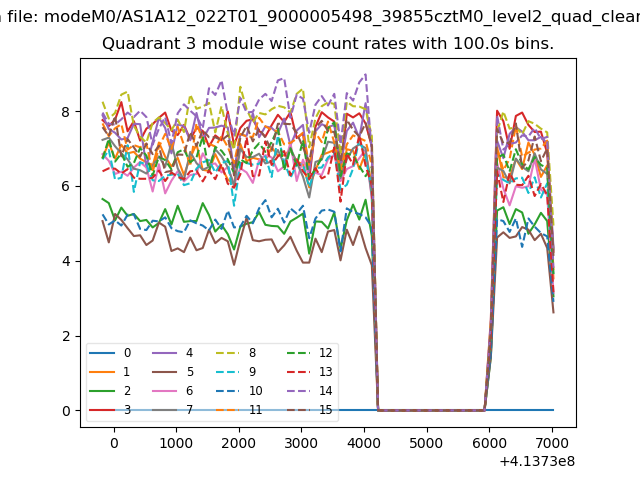 |
 |
| Parameter | Plot |
|---|---|
| CZT HV Monitor | 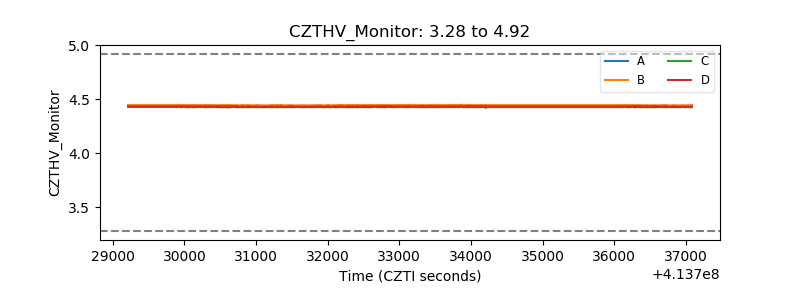 |
| D_VDD | 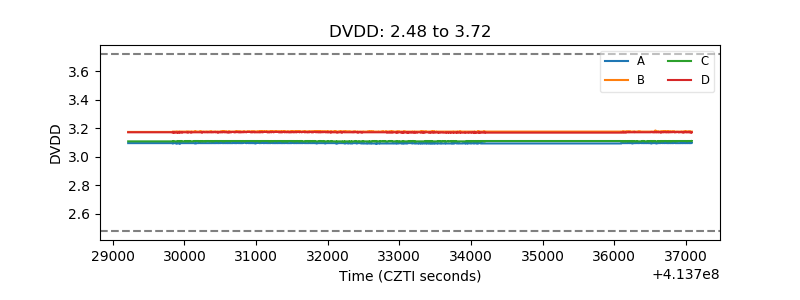 |
| Temperature 1 | 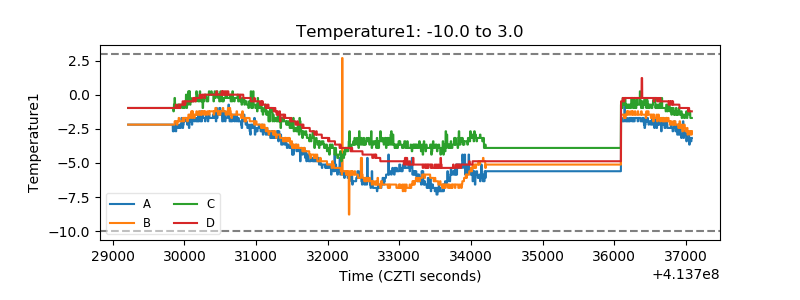 |
| Veto HV Monitor | 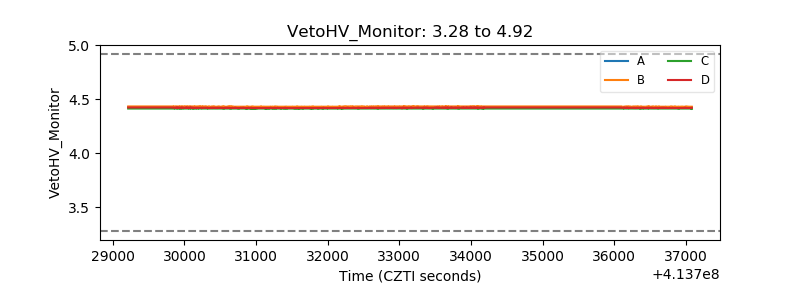 |
| Veto LLD | 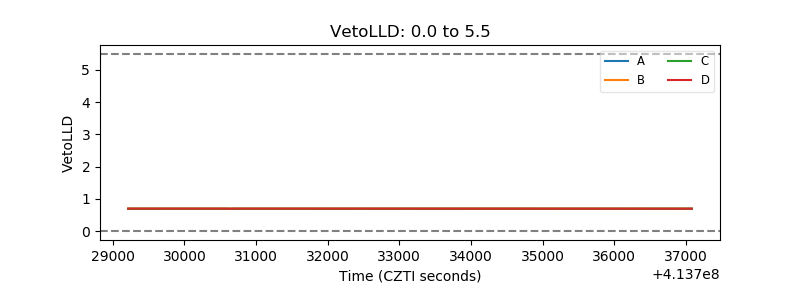 |
| Alpha Counter |  |
| _CPM_Rate | 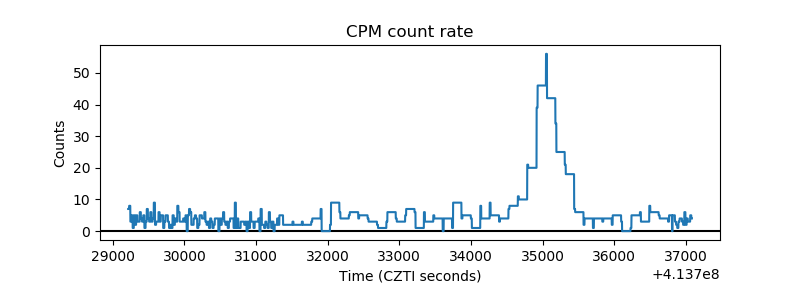 |
| CZT Counter | 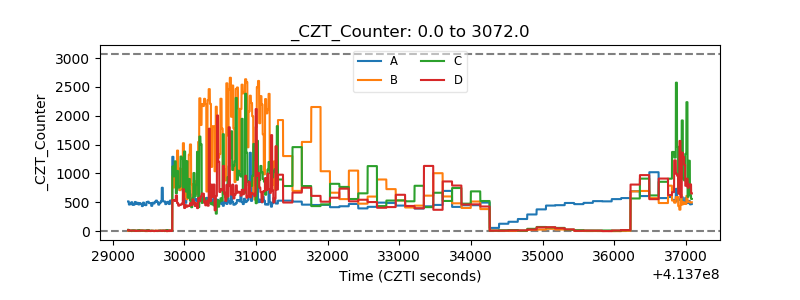 |
| +2.5 Volts monitor | 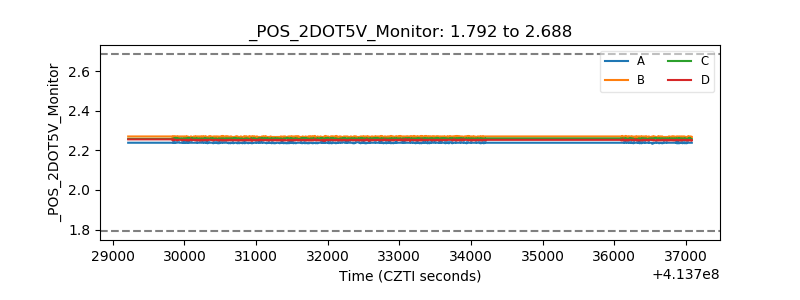 |
| +5 Volts monitor | 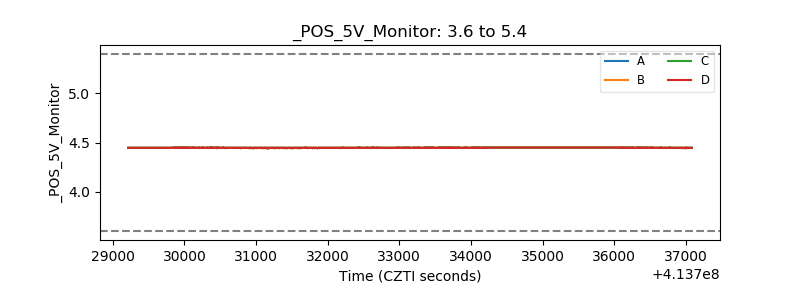 |
| _ROLL_ROT | 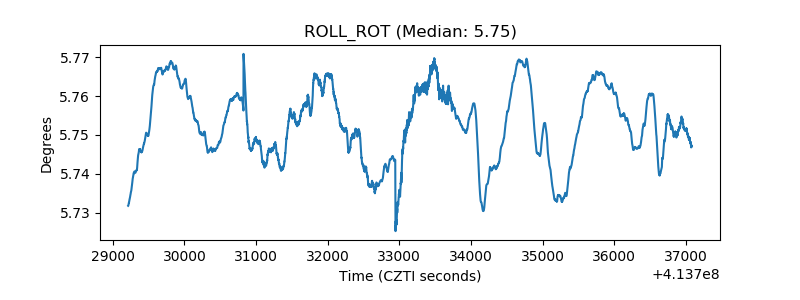 |
| _Roll_DEC | 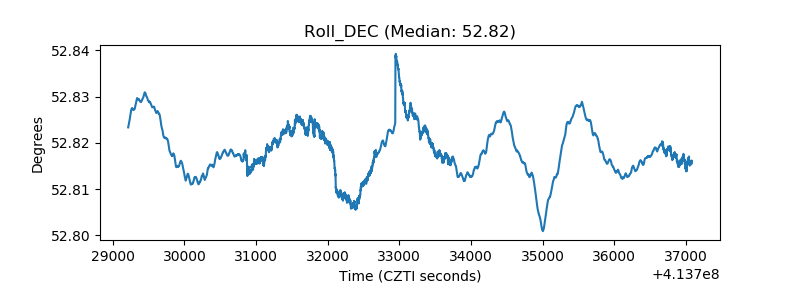 |
| _Roll_RA | 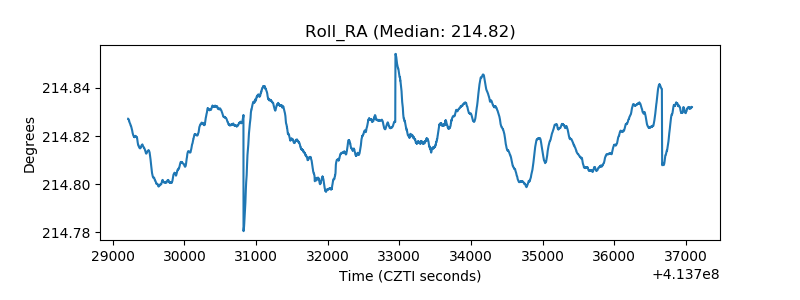 |
| Veto Counter | 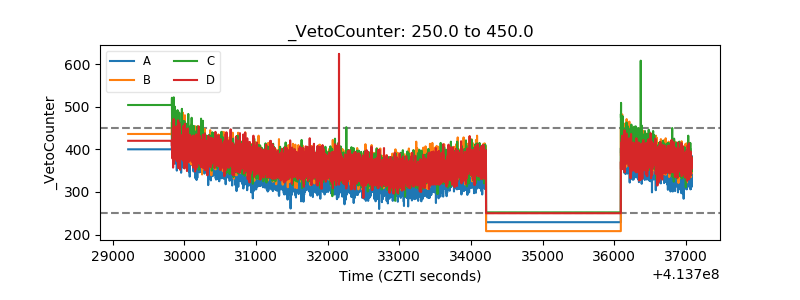 |