| Param | Original file | Final file |
|---|---|---|
| Filename | modeM0/AS1A12_022T01_9000005498_39856cztM0_level2.fits | modeM0/AS1A12_022T01_9000005498_39856cztM0_level2_quad_clean.evt |
| Size (bytes) | 398,376,000 | 90,270,720 |
| Size | 379.9 MB | 86.1 MB |
| Events in quadrant A | 2,948,673 | 621,128 |
| Events in quadrant B | 3,183,815 | 616,195 |
| Events in quadrant C | 4,338,398 | 567,339 |
| Events in quadrant D | 3,841,734 | 537,978 |
| Mode M0 | |||
|---|---|---|---|
| Quadrant | BADHDUFLAG | Total packets | Discarded packets |
| A | 0 | 12346 | 3 |
| B | 0 | 13268 | 2 |
| C | 0 | 16541 | 2 |
| D | 0 | 15390 | 2 |
| Mode M9 | |||
|---|---|---|---|
| Quadrant | BADHDUFLAG | Total packets | Discarded packets |
| A | 0 | 21 | 0 |
| B | 0 | 21 | 0 |
| C | 0 | 21 | 0 |
| D | 0 | 22 | 0 |
| Mode SS | |||
|---|---|---|---|
| Quadrant | BADHDUFLAG | Total packets | Discarded packets |
| A | 0 | 114 | 0 |
| B | 0 | 114 | 0 |
| C | 0 | 114 | 0 |
| D | 0 | 114 | 0 |
| Quadrant | Total seconds | Saturated seconds | Saturation percentage |
|---|---|---|---|
| A | 5580 | 15 | 0.268817% |
| B | 5580 | 156 | 2.795699% |
| C | 5580 | 329 | 5.896057% |
| D | 5580 | 201 | 3.602151% |
Noise dominated data is calculated using 1-second bins in cleaned event files. If a bin has >2000 counts, and if more than 50% of those come from <1% of pixels, then it is considered to be noise-dominated and hence unusable.
| Quadrant | # 1 sec bins | Bins with >0 counts | Bins with >2000 counts | High rate bins dominated by noise | Noise dominated (total time) | Noise dominated (detector-on time) | Marked lightcurve |
|---|---|---|---|---|---|---|---|
| A | 7134 | 5581 | 9 | 9 | 0.13% | 0.16% | 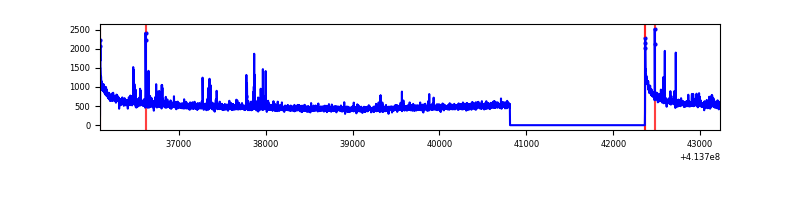 |
| B | 7134 | 5581 | 113 | 113 | 1.58% | 2.02% | 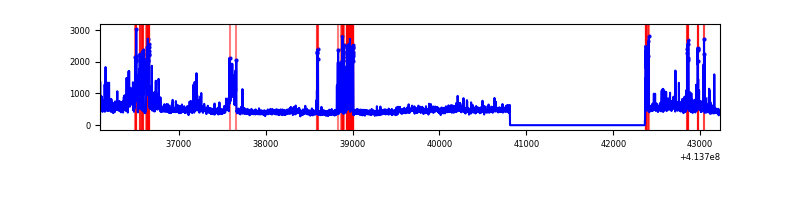 |
| C | 7134 | 5581 | 294 | 294 | 4.12% | 5.27% | 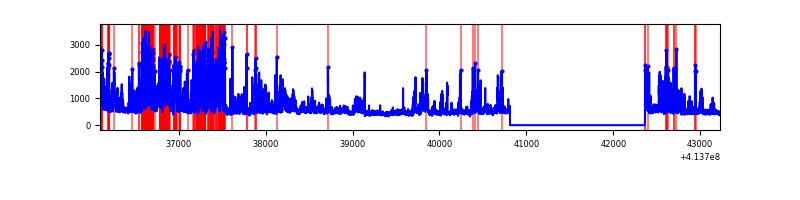 |
| D | 7134 | 5581 | 178 | 178 | 2.50% | 3.19% | 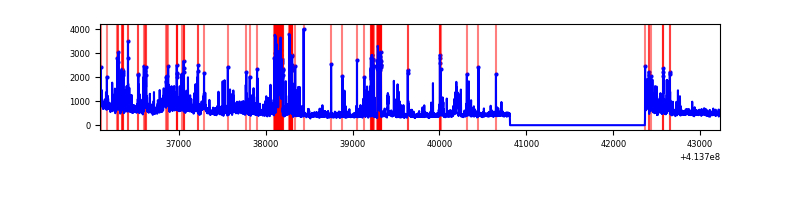 |
Top three noisy pixels from each quadrant. If the there are fewer than three noisy pixels in the level2.evt file, extra rows are filled as -1
| Pixel properties | Quadrant properties | ||||||
|---|---|---|---|---|---|---|---|
| Quadrant | DetID | PixID | Counts | Sigma | Mean | Median | Sigma |
| A | 10 | 83 | 502261 | 4057.88 | 604 | 591 | 123.6 |
| A | 13 | 248 | 91183 | 732.77 | 604 | 591 | 123.6 |
| A | 13 | 254 | 10453 | 79.77 | 604 | 591 | 123.6 |
| B | 4 | 170 | 570613 | 4953.64 | 597 | 581 | 115.1 |
| B | 0 | 230 | 63226 | 544.39 | 597 | 581 | 115.1 |
| B | 4 | 171 | 54340 | 467.17 | 597 | 581 | 115.1 |
| C | 9 | 187 | 1213363 | 8965.75 | 575 | 578 | 135.3 |
| C | 15 | 208 | 534277 | 3945.47 | 575 | 578 | 135.3 |
| C | 15 | 214 | 231838 | 1709.63 | 575 | 578 | 135.3 |
| D | 2 | 250 | 516620 | 3572.12 | 582 | 564 | 144.5 |
| D | 1 | 52 | 234112 | 1616.61 | 582 | 564 | 144.5 |
| D | 12 | 227 | 221869 | 1531.87 | 582 | 564 | 144.5 |
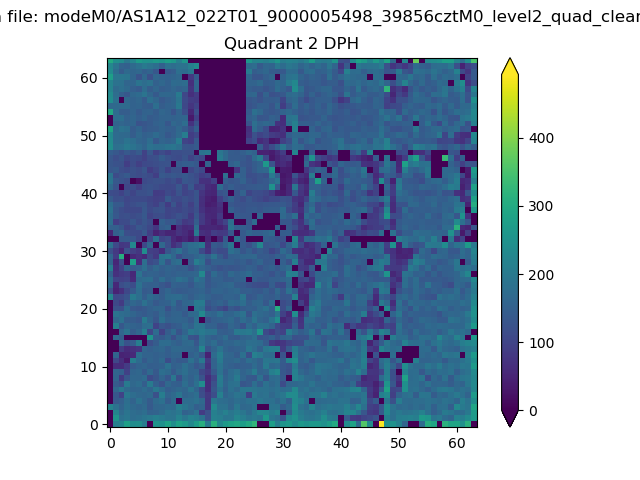
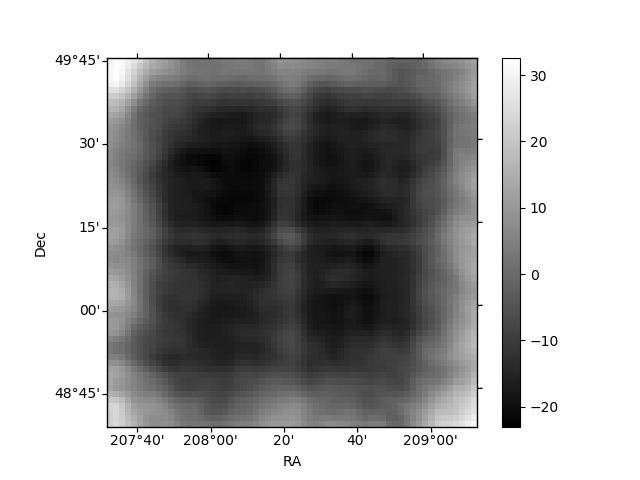
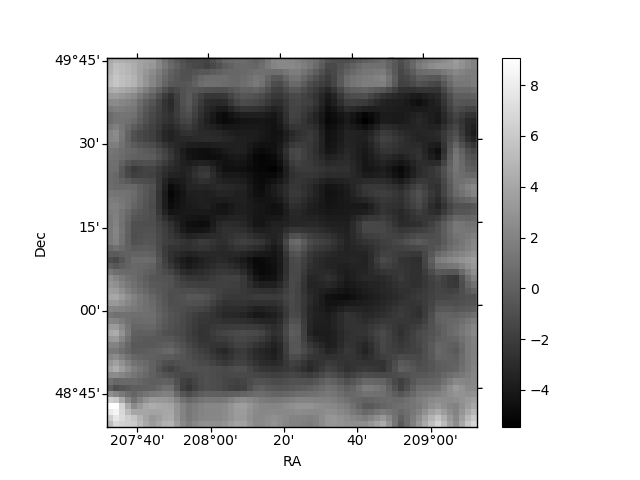
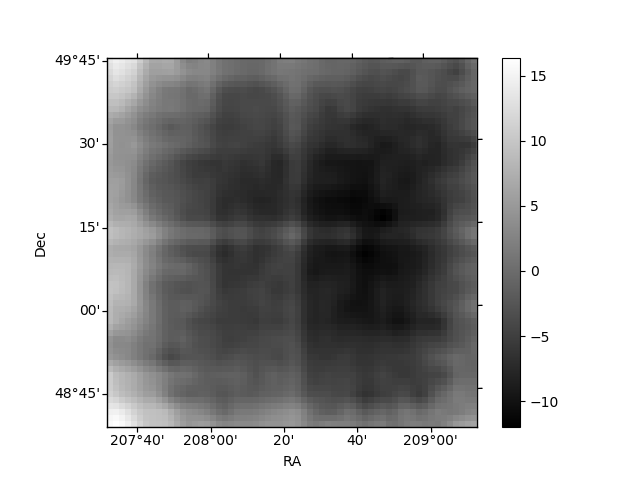
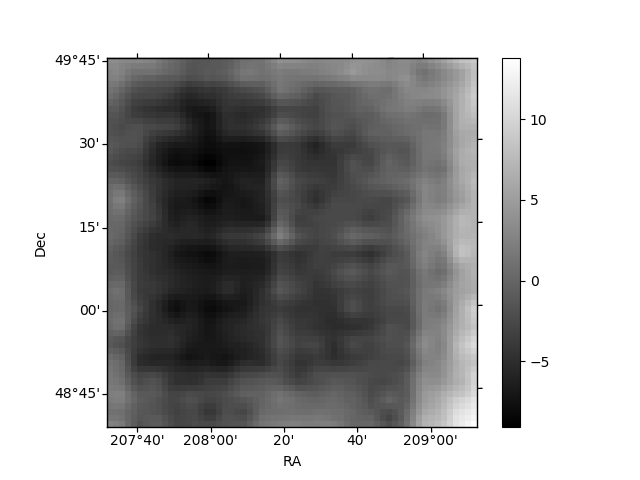
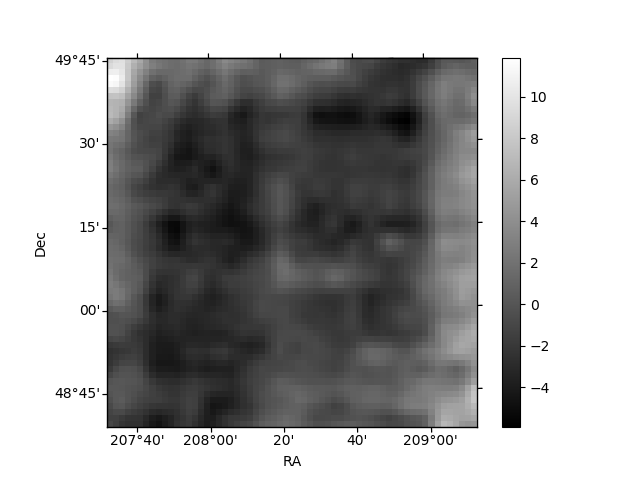
Histogram calculated using DETX and DETY for each event in the final _common_clean file
| Quadrant A | 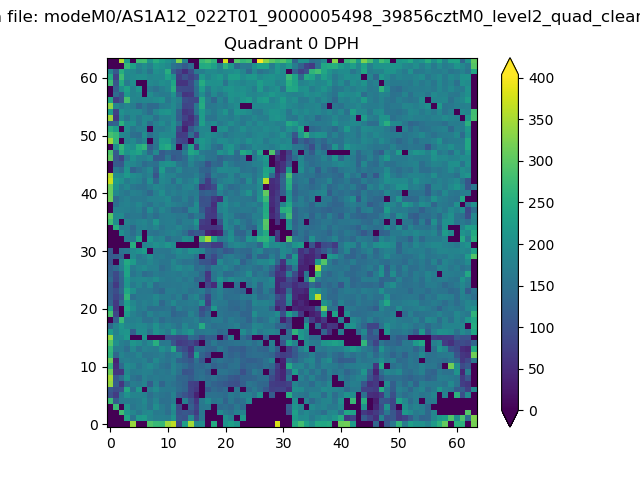 |
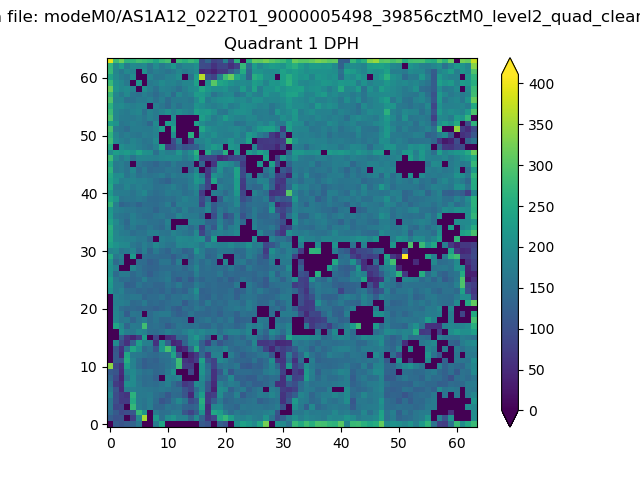 |
Quadrant B |
|---|---|---|---|
| Quadrant D | 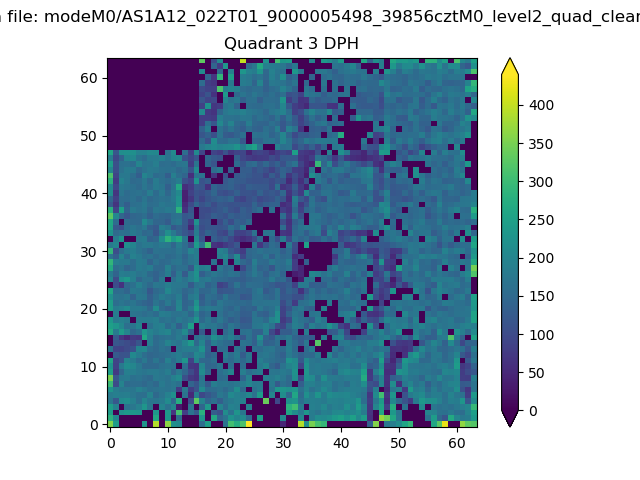 |
 |
Quadrant C |
| Plot type | Count rate plots | Images |
|---|---|---|
| Comparison with Poisson distribution Blue bars denote a histogram of data divided into 1 sec bins. Red curve is a Poisson curve with rate = median count rate of data. |
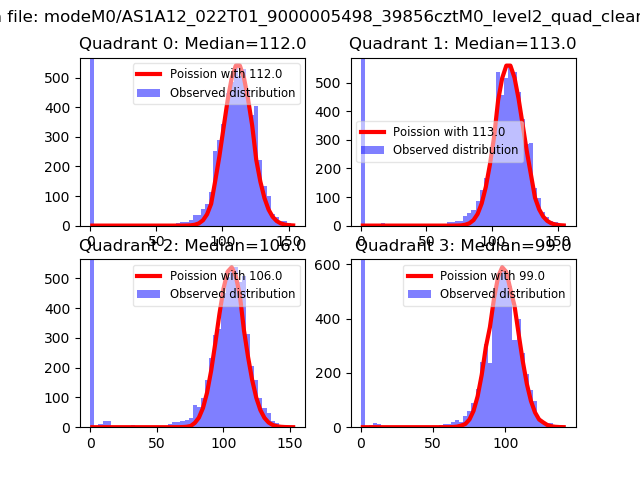 |
 |
| Quadrant-wise count rates Data is divided into 100 sec bins |
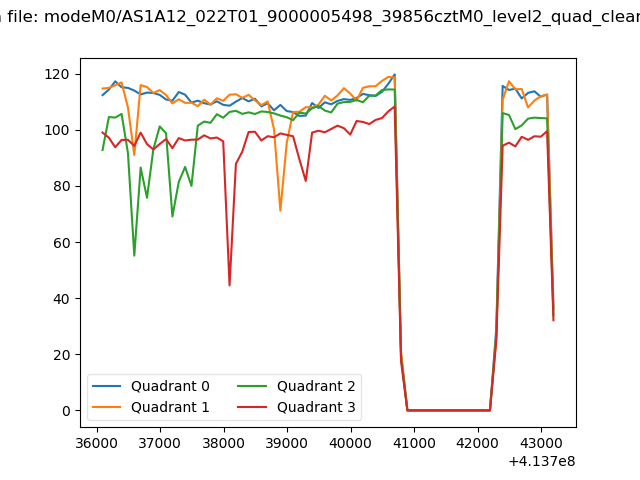 |
|
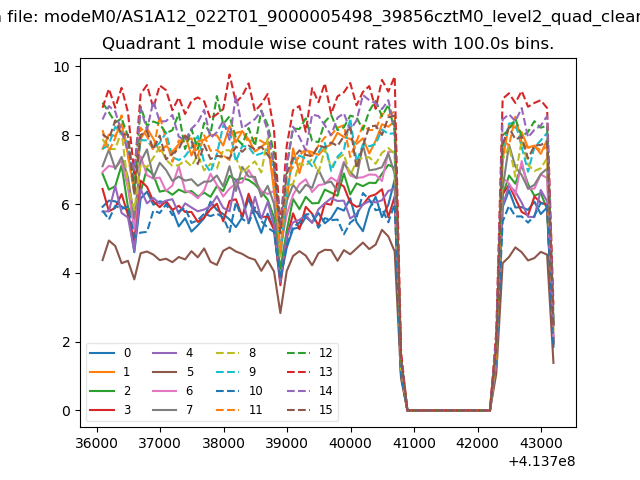
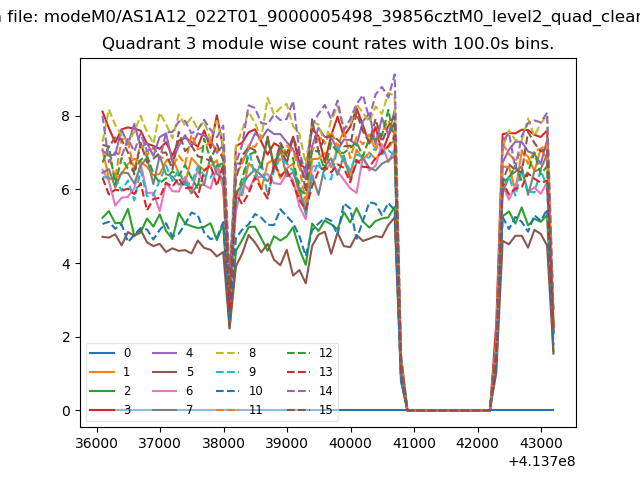
| Module-wise count rates for Quadrant A Data is divided into 100 sec bins |
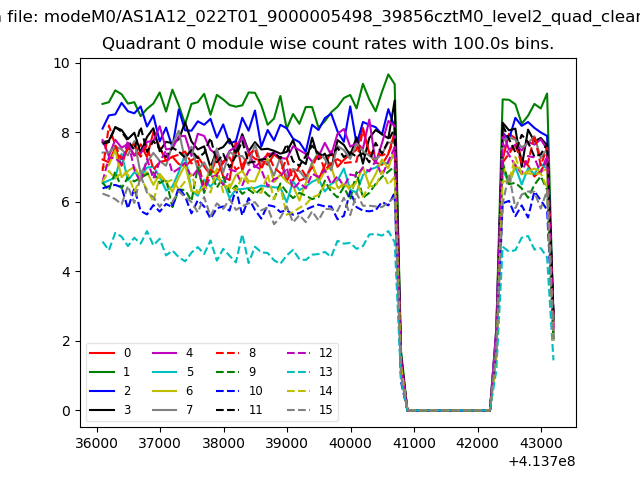 |
 |
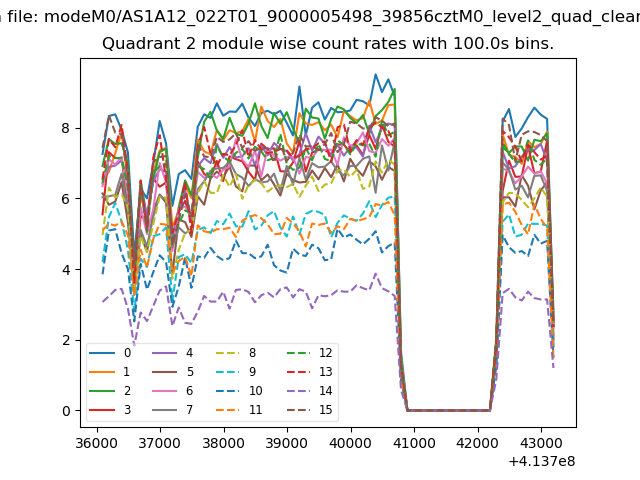
| Module-wise count rates for Quadrant B Data is divided into 100 sec bins |
 |
 |
| Module-wise count rates for Quadrant C Data is divided into 100 sec bins |
 |
 |
| Module-wise count rates for Quadrant D Data is divided into 100 sec bins |
 |
 |
| Parameter | Plot |
|---|---|
| CZT HV Monitor | 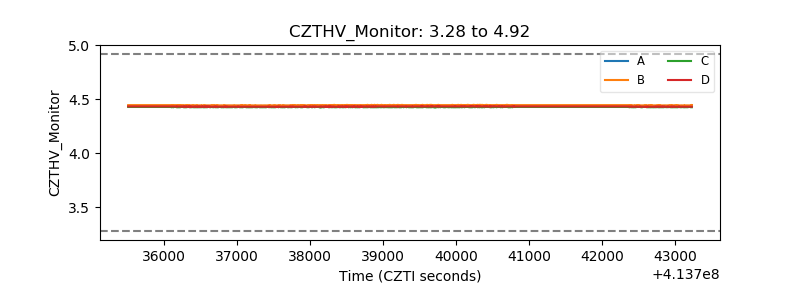 |
| D_VDD | 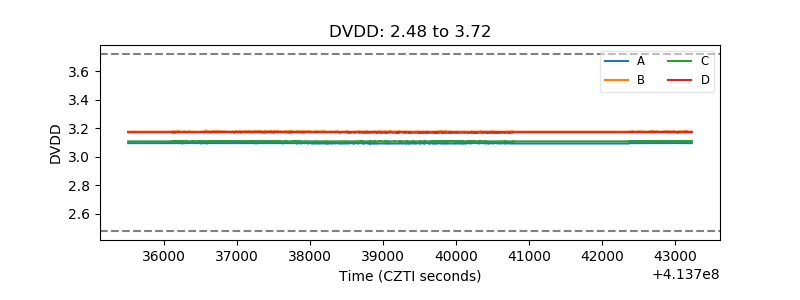 |
| Temperature 1 | 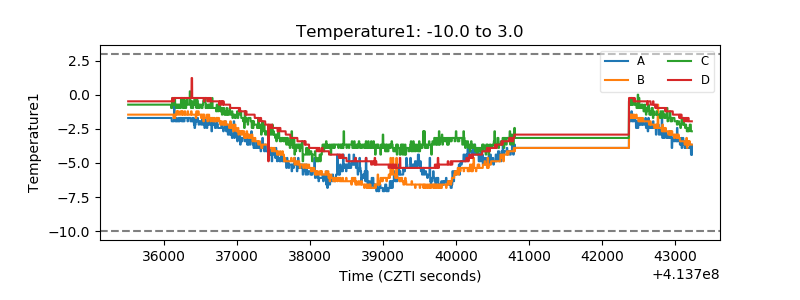 |
| Veto HV Monitor | 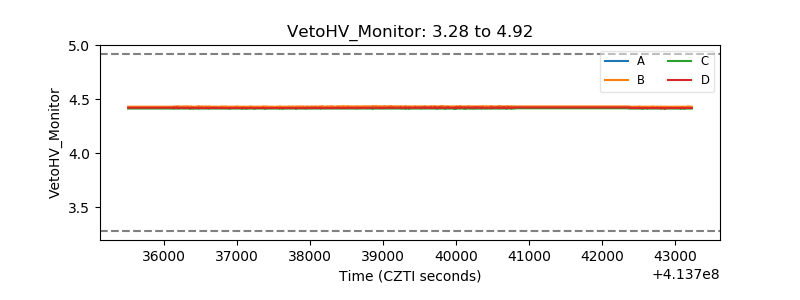 |
| Veto LLD | 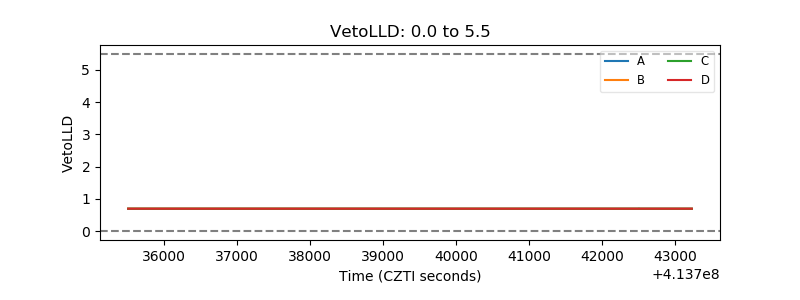 |
| Alpha Counter | 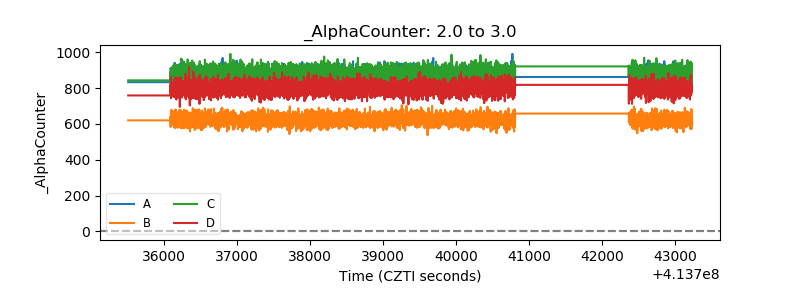 |
| _CPM_Rate | 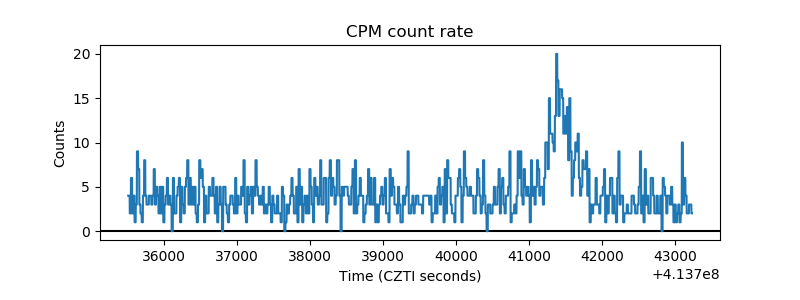 |
| CZT Counter | 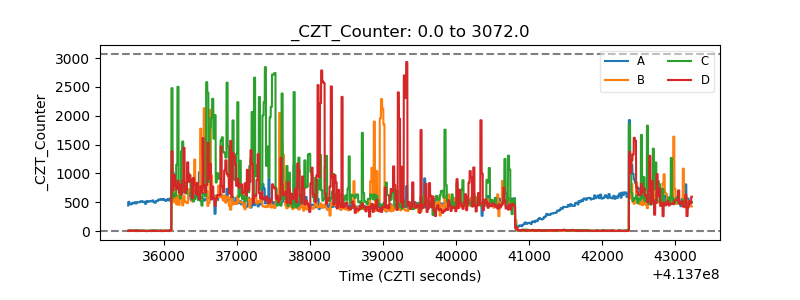 |
| +2.5 Volts monitor | 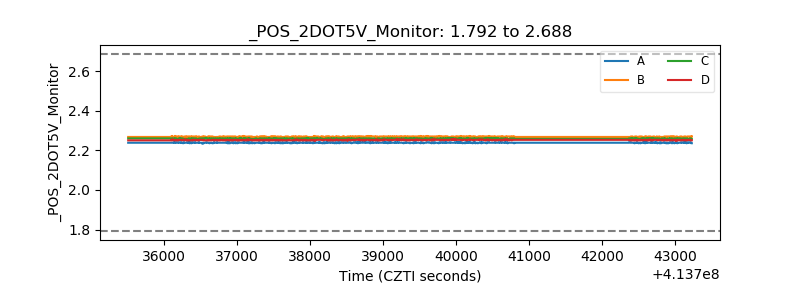 |
| +5 Volts monitor | 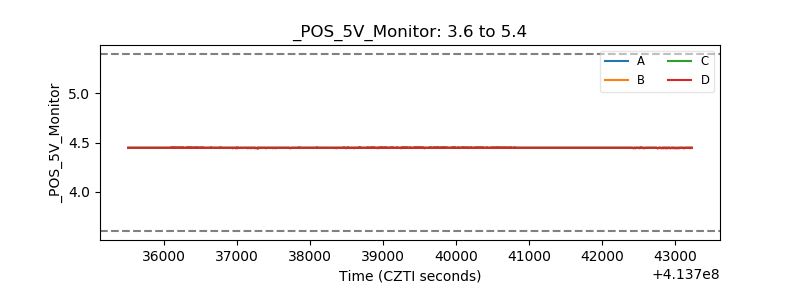 |
| _ROLL_ROT | 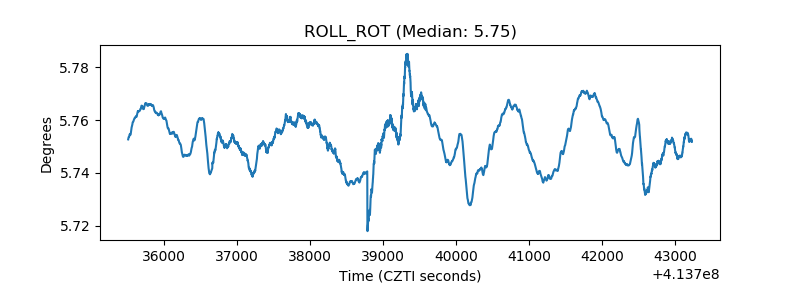 |
| _Roll_DEC | 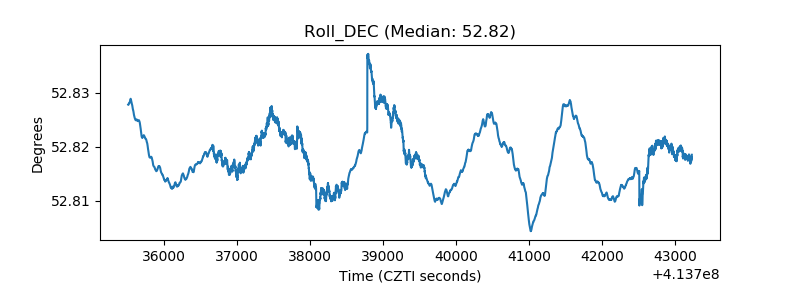 |
| _Roll_RA | 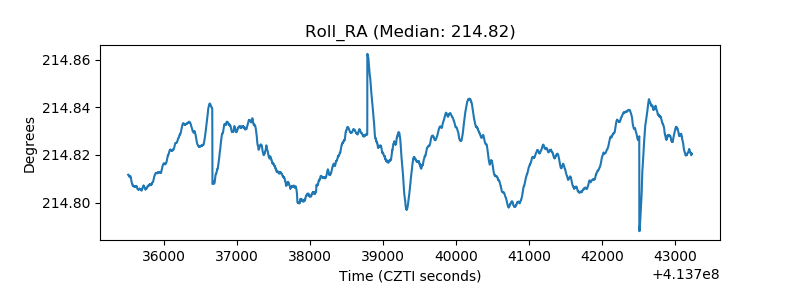 |
| Veto Counter | 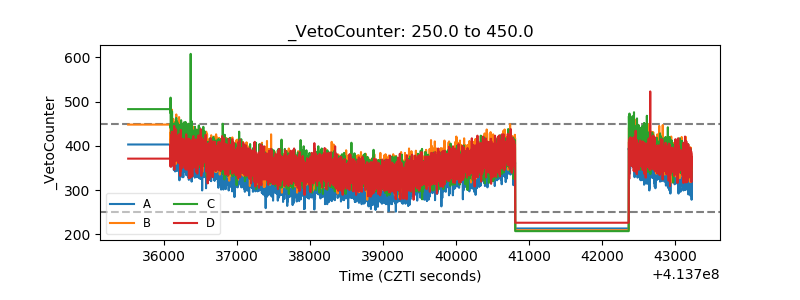 |