| Param | Original file | Final file |
|---|---|---|
| Filename | modeM0/AS1A12_022T01_9000005498_39857cztM0_level2.fits | modeM0/AS1A12_022T01_9000005498_39857cztM0_level2_quad_clean.evt |
| Size (bytes) | 405,126,720 | 91,866,240 |
| Size | 386.4 MB | 87.6 MB |
| Events in quadrant A | 3,053,315 | 636,573 |
| Events in quadrant B | 4,602,200 | 571,231 |
| Events in quadrant C | 3,220,964 | 611,022 |
| Events in quadrant D | 3,667,398 | 556,067 |
| Mode M0 | |||
|---|---|---|---|
| Quadrant | BADHDUFLAG | Total packets | Discarded packets |
| A | 0 | 12816 | 3 |
| B | 0 | 17732 | 2 |
| C | 0 | 13359 | 2 |
| D | 0 | 15039 | 2 |
| Mode M9 | |||
|---|---|---|---|
| Quadrant | BADHDUFLAG | Total packets | Discarded packets |
| A | 0 | 28 | 0 |
| B | 0 | 28 | 0 |
| C | 0 | 28 | 0 |
| D | 0 | 29 | 0 |
| Mode SS | |||
|---|---|---|---|
| Quadrant | BADHDUFLAG | Total packets | Discarded packets |
| A | 0 | 118 | 0 |
| B | 0 | 118 | 0 |
| C | 0 | 118 | 0 |
| D | 0 | 118 | 0 |
| Quadrant | Total seconds | Saturated seconds | Saturation percentage |
|---|---|---|---|
| A | 5816 | 20 | 0.343879% |
| B | 5816 | 788 | 13.548831% |
| C | 5816 | 51 | 0.876891% |
| D | 5816 | 197 | 3.387208% |
Noise dominated data is calculated using 1-second bins in cleaned event files. If a bin has >2000 counts, and if more than 50% of those come from <1% of pixels, then it is considered to be noise-dominated and hence unusable.
| Quadrant | # 1 sec bins | Bins with >0 counts | Bins with >2000 counts | High rate bins dominated by noise | Noise dominated (total time) | Noise dominated (detector-on time) | Marked lightcurve |
|---|---|---|---|---|---|---|---|
| A | 7159 | 5817 | 13 | 13 | 0.18% | 0.22% | 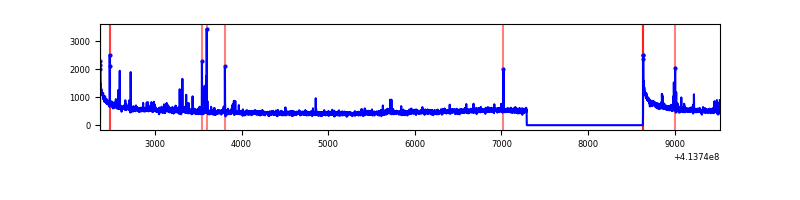 |
| B | 7159 | 5817 | 443 | 443 | 6.19% | 7.62% | 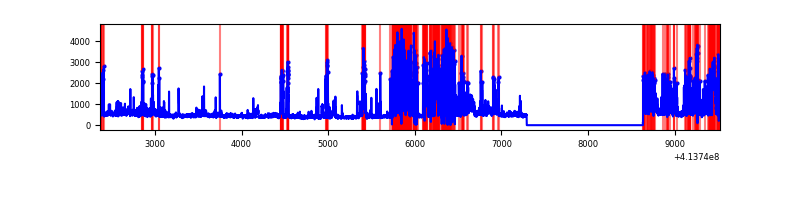 |
| C | 7159 | 5817 | 41 | 41 | 0.57% | 0.70% | 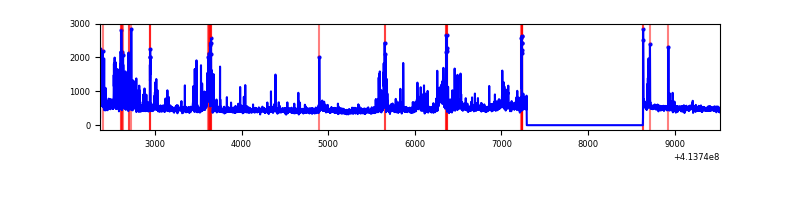 |
| D | 7159 | 5817 | 169 | 169 | 2.36% | 2.91% | 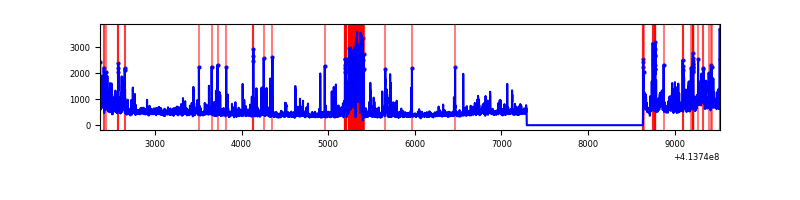 |
Top three noisy pixels from each quadrant. If the there are fewer than three noisy pixels in the level2.evt file, extra rows are filled as -1
| Pixel properties | Quadrant properties | ||||||
|---|---|---|---|---|---|---|---|
| Quadrant | DetID | PixID | Counts | Sigma | Mean | Median | Sigma |
| A | 10 | 83 | 508257 | 3932.26 | 630 | 616 | 129.1 |
| A | 13 | 248 | 75594 | 580.79 | 630 | 616 | 129.1 |
| A | 13 | 254 | 11939 | 87.71 | 630 | 616 | 129.1 |
| B | 4 | 171 | 1877465 | 16667.37 | 577 | 562 | 112.6 |
| B | 5 | 207 | 91123 | 804.2 | 577 | 562 | 112.6 |
| B | 0 | 229 | 80625 | 710.98 | 577 | 562 | 112.6 |
| C | 9 | 187 | 523318 | 3683.72 | 611 | 615 | 141.9 |
| C | 15 | 214 | 243336 | 1710.56 | 611 | 615 | 141.9 |
| C | 12 | 249 | 35384 | 245.03 | 611 | 615 | 141.9 |
| D | 2 | 249 | 378021 | 2525.16 | 605 | 585 | 149.5 |
| D | 7 | 38 | 253915 | 1694.86 | 605 | 585 | 149.5 |
| D | 12 | 227 | 148852 | 991.95 | 605 | 585 | 149.5 |
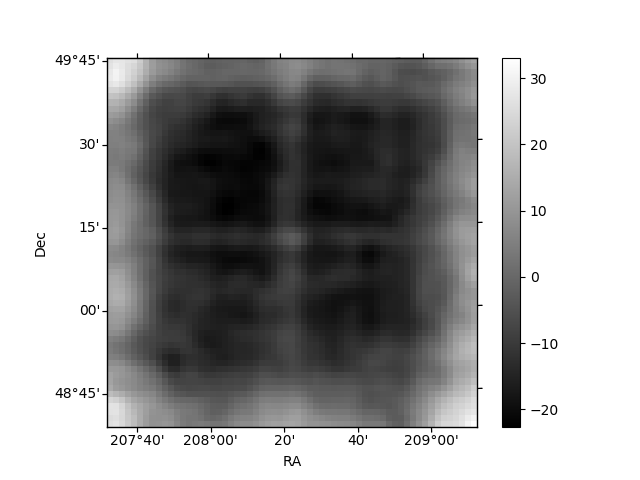
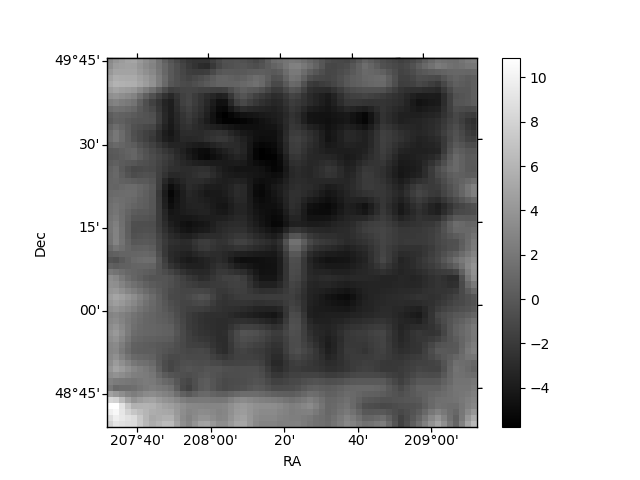
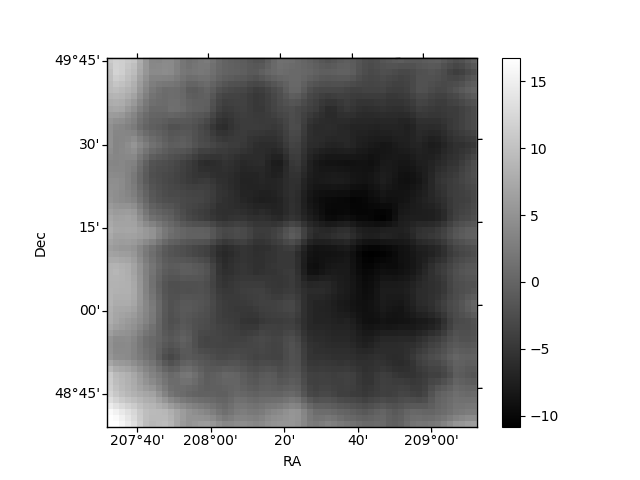
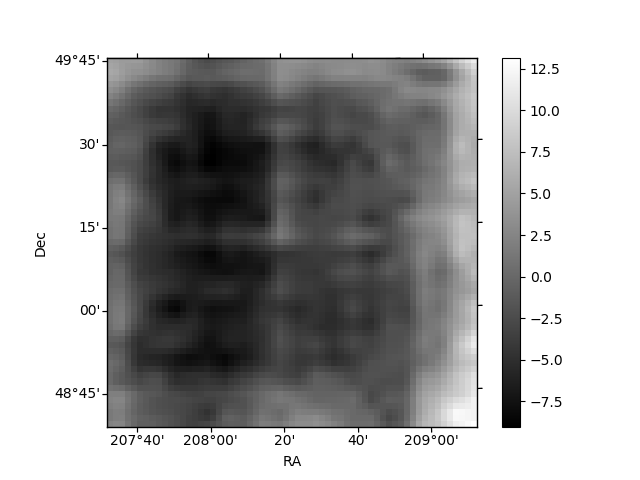
Histogram calculated using DETX and DETY for each event in the final _common_clean file
| Quadrant A | 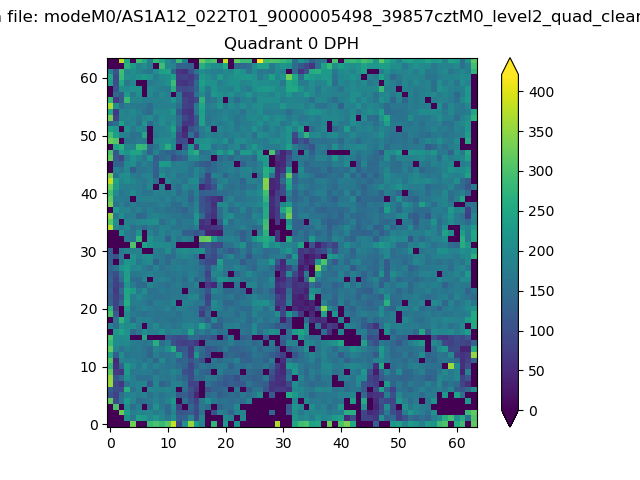 |
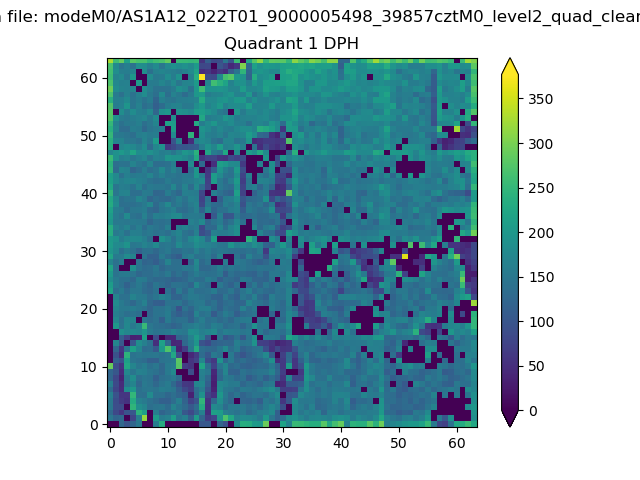 |
Quadrant B |
|---|---|---|---|
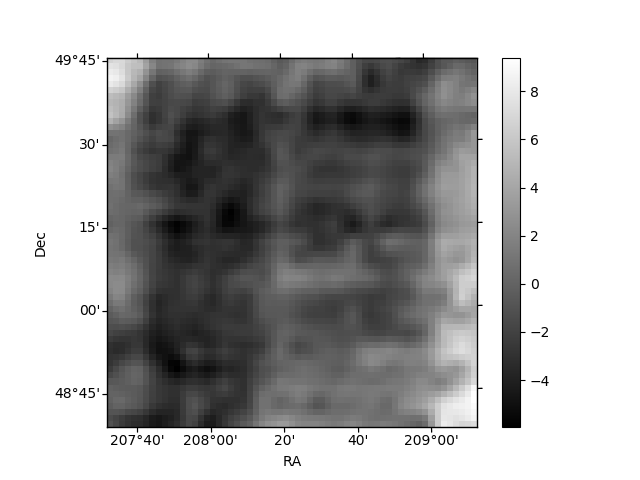
| Quadrant D | 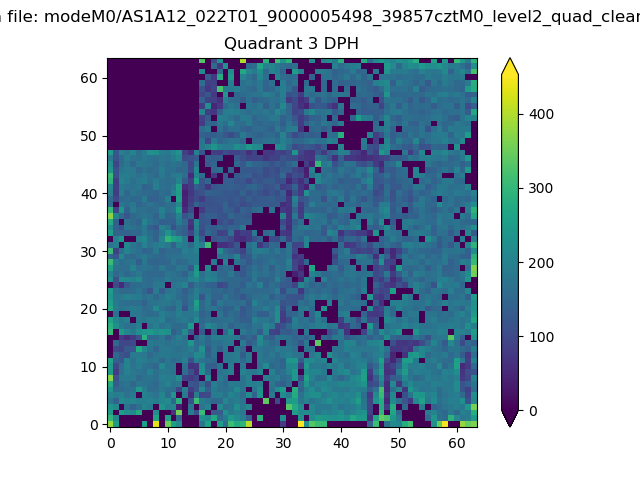 |
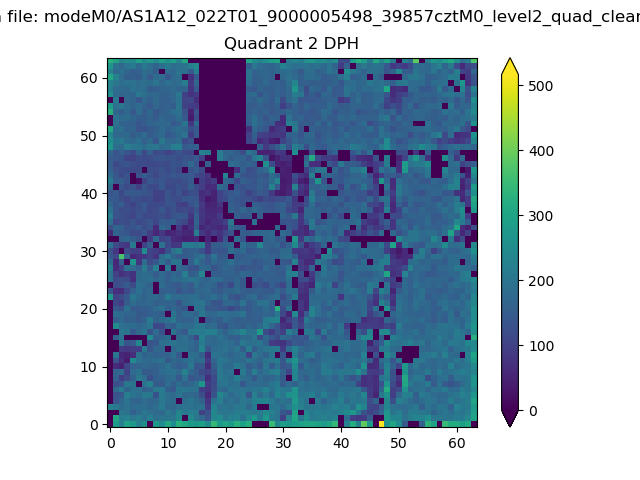 |
Quadrant C |
| Plot type | Count rate plots | Images |
|---|---|---|
| Comparison with Poisson distribution Blue bars denote a histogram of data divided into 1 sec bins. Red curve is a Poisson curve with rate = median count rate of data. |
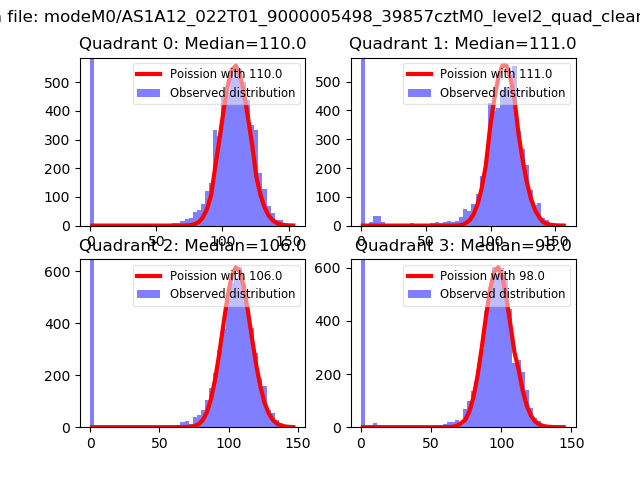 |
 |
| Quadrant-wise count rates Data is divided into 100 sec bins |
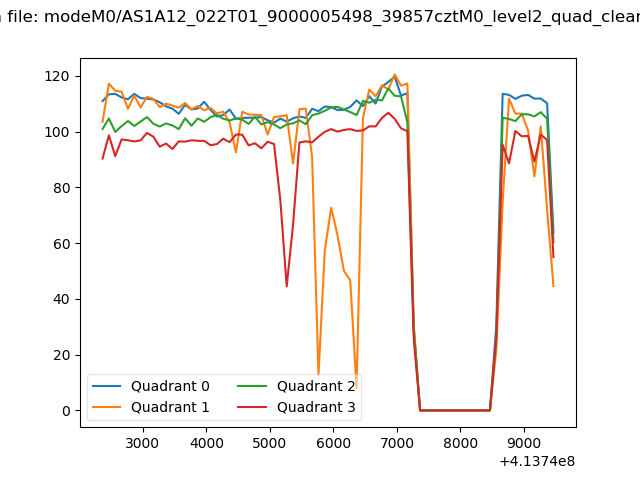 |
|
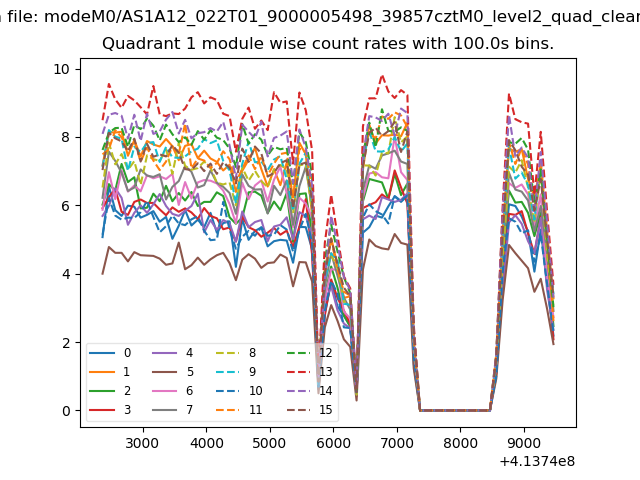
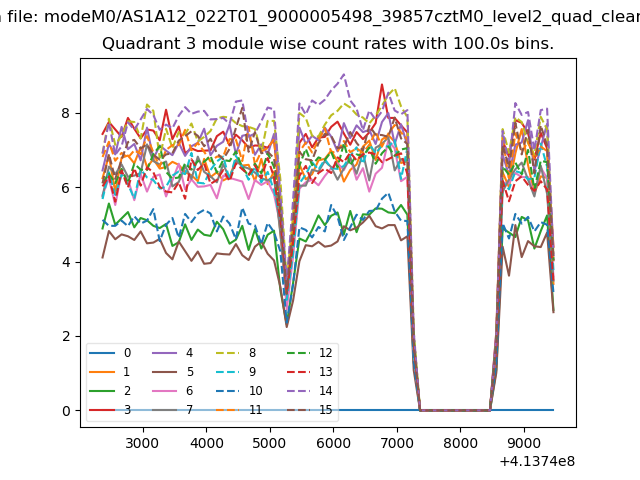
| Module-wise count rates for Quadrant A Data is divided into 100 sec bins |
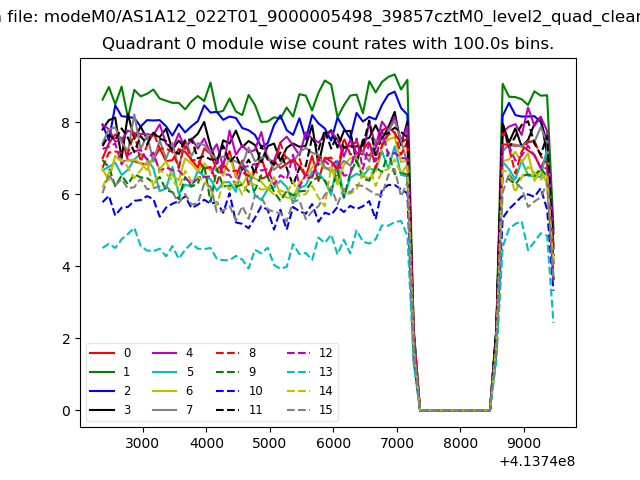 |
 |
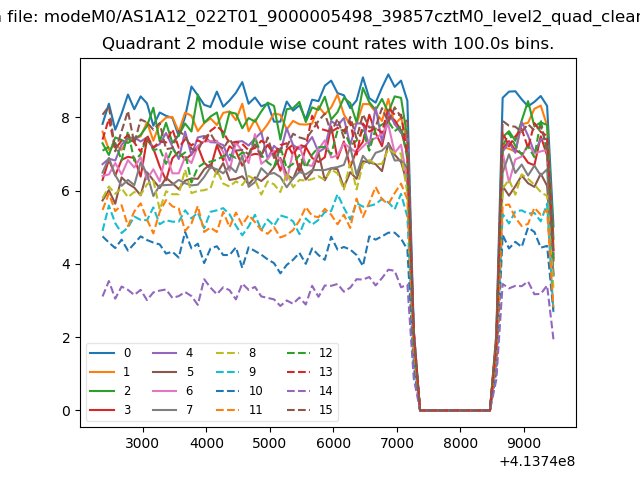
| Module-wise count rates for Quadrant B Data is divided into 100 sec bins |
 |
 |
| Module-wise count rates for Quadrant C Data is divided into 100 sec bins |
 |
 |
| Module-wise count rates for Quadrant D Data is divided into 100 sec bins |
 |
 |
| Parameter | Plot |
|---|---|
| CZT HV Monitor | 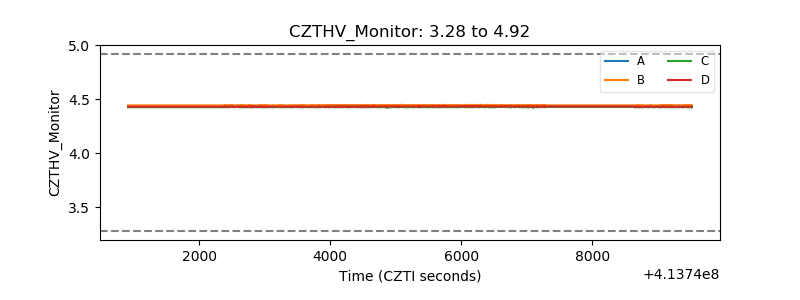 |
| D_VDD | 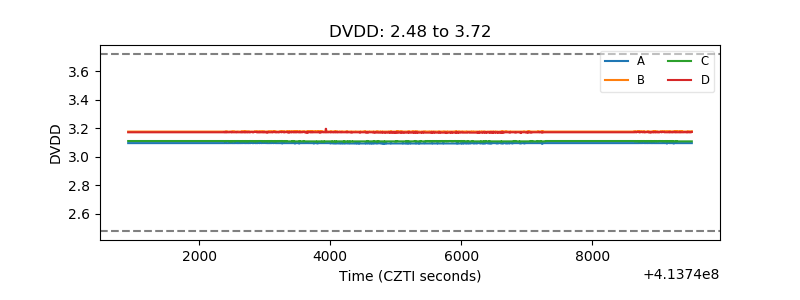 |
| Temperature 1 | 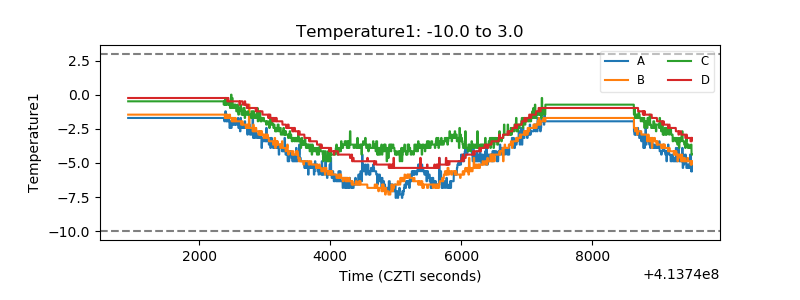 |
| Veto HV Monitor | 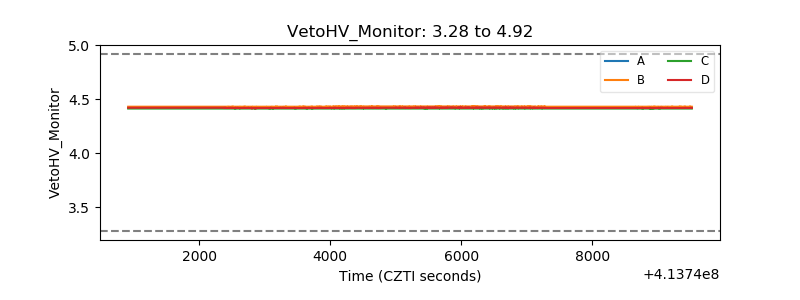 |
| Veto LLD | 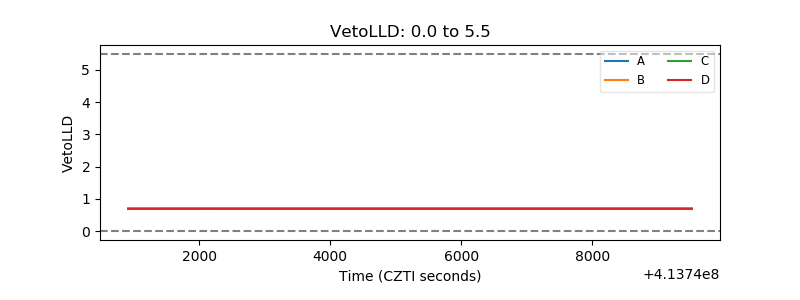 |
| Alpha Counter | 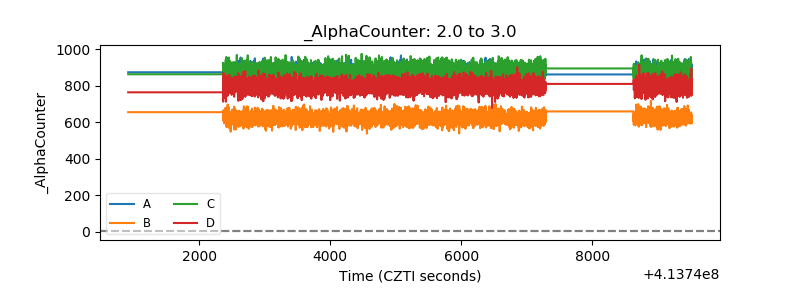 |
| _CPM_Rate | 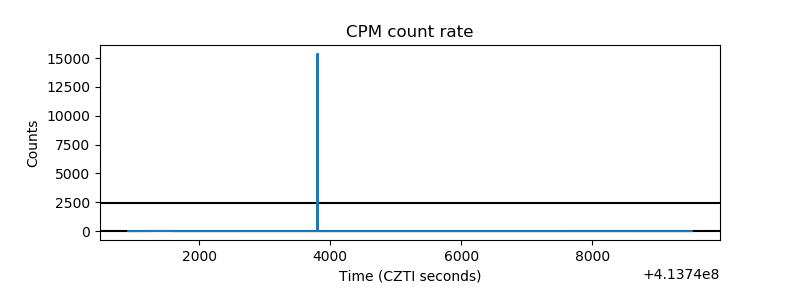 |
| CZT Counter | 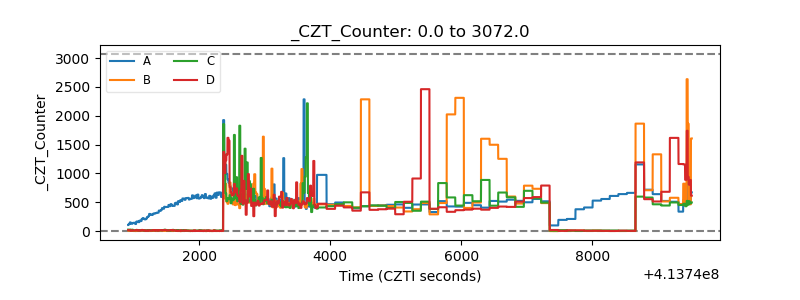 |
| +2.5 Volts monitor | 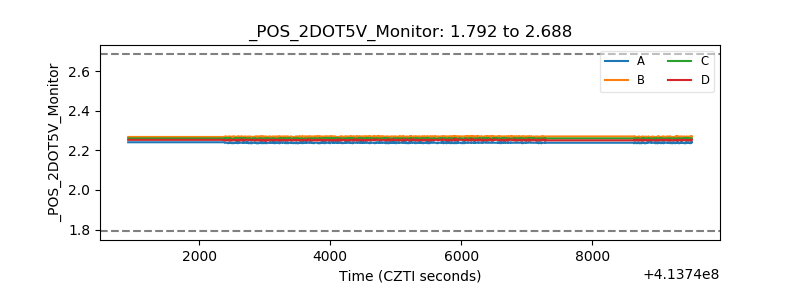 |
| +5 Volts monitor | 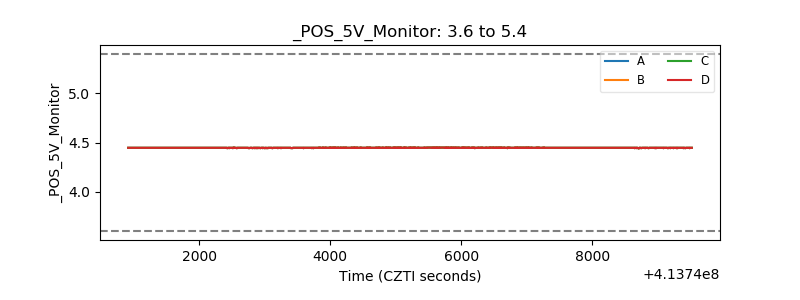 |
| _ROLL_ROT | 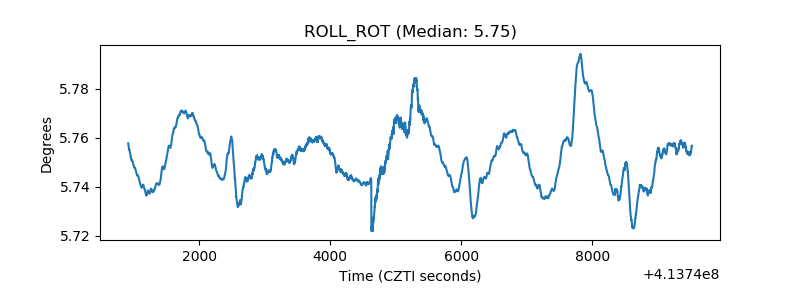 |
| _Roll_DEC | 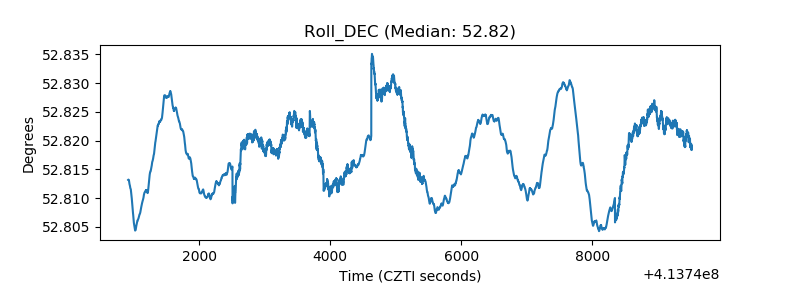 |
| _Roll_RA | 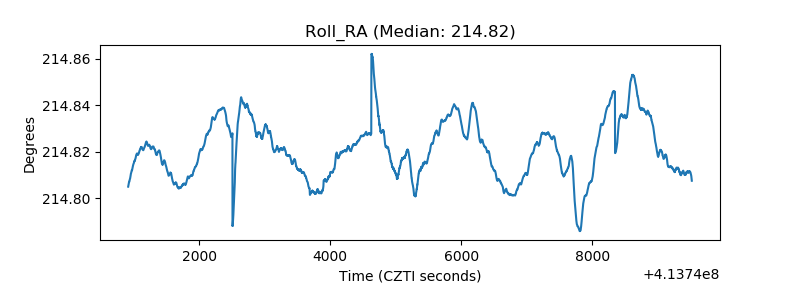 |
| Veto Counter | 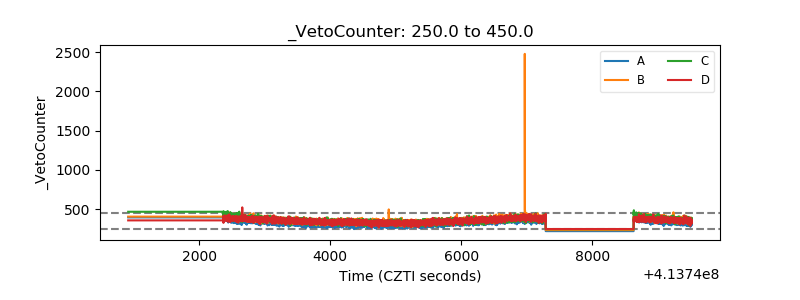 |