| Param | Original file | Final file |
|---|---|---|
| Filename | modeM0/AS1A12_022T01_9000005498_39860cztM0_level2.fits | modeM0/AS1A12_022T01_9000005498_39860cztM0_level2_quad_clean.evt |
| Size (bytes) | 179,700,480 | 45,048,960 |
| Size | 171.4 MB | 43.0 MB |
| Events in quadrant A | 1,473,423 | 298,939 |
| Events in quadrant B | 1,684,737 | 303,134 |
| Events in quadrant C | 1,675,679 | 289,522 |
| Events in quadrant D | 1,595,096 | 269,460 |
| Mode M0 | |||
|---|---|---|---|
| Quadrant | BADHDUFLAG | Total packets | Discarded packets |
| A | 0 | 6411 | 2 |
| B | 0 | 7159 | 1 |
| C | 0 | 6915 | 1 |
| D | 0 | 6952 | 1 |
| Mode M9 | |||
|---|---|---|---|
| Quadrant | BADHDUFLAG | Total packets | Discarded packets |
| A | 0 | 5 | 0 |
| B | 0 | 5 | 0 |
| C | 0 | 5 | 0 |
| D | 0 | 6 | 0 |
| Mode SS | |||
|---|---|---|---|
| Quadrant | BADHDUFLAG | Total packets | Discarded packets |
| A | 0 | 58 | 0 |
| B | 0 | 58 | 0 |
| C | 0 | 58 | 0 |
| D | 0 | 58 | 0 |
| Quadrant | Total seconds | Saturated seconds | Saturation percentage |
|---|---|---|---|
| A | 2839 | 23 | 0.810144% |
| B | 2839 | 56 | 1.972526% |
| C | 2839 | 79 | 2.782670% |
| D | 2839 | 69 | 2.430433% |
Noise dominated data is calculated using 1-second bins in cleaned event files. If a bin has >2000 counts, and if more than 50% of those come from <1% of pixels, then it is considered to be noise-dominated and hence unusable.
| Quadrant | # 1 sec bins | Bins with >0 counts | Bins with >2000 counts | High rate bins dominated by noise | Noise dominated (total time) | Noise dominated (detector-on time) | Marked lightcurve |
|---|---|---|---|---|---|---|---|
| A | 2839 | 2839 | 23 | 23 | 0.81% | 0.81% | 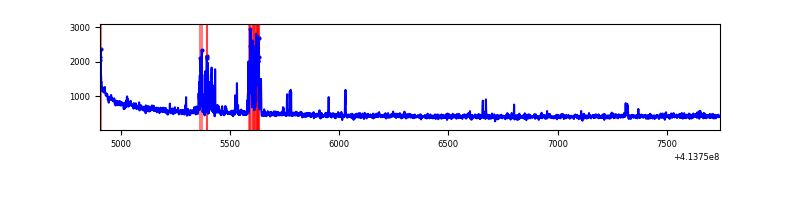 |
| B | 2839 | 2839 | 29 | 29 | 1.02% | 1.02% | 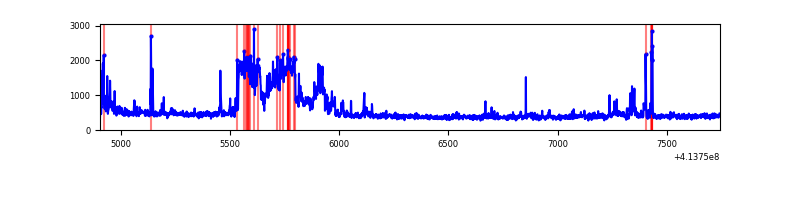 |
| C | 2839 | 2839 | 73 | 73 | 2.57% | 2.57% | 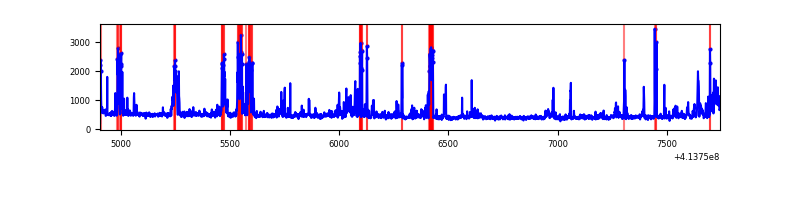 |
| D | 2839 | 2839 | 61 | 61 | 2.15% | 2.15% | 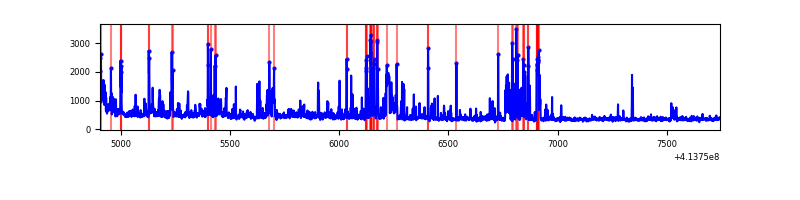 |
Top three noisy pixels from each quadrant. If the there are fewer than three noisy pixels in the level2.evt file, extra rows are filled as -1
| Pixel properties | Quadrant properties | ||||||
|---|---|---|---|---|---|---|---|
| Quadrant | DetID | PixID | Counts | Sigma | Mean | Median | Sigma |
| A | 10 | 83 | 241274 | 4106.77 | 283 | 276 | 58.7 |
| A | 13 | 248 | 111076 | 1888.11 | 283 | 276 | 58.7 |
| A | 10 | 255 | 9538 | 157.83 | 283 | 276 | 58.7 |
| B | 4 | 170 | 409415 | 7294.47 | 284 | 277 | 56.1 |
| B | 0 | 229 | 64324 | 1141.89 | 284 | 277 | 56.1 |
| B | 0 | 230 | 31441 | 555.62 | 284 | 277 | 56.1 |
| C | 9 | 187 | 443439 | 6635.47 | 278 | 279 | 66.8 |
| C | 15 | 214 | 117244 | 1751.33 | 278 | 279 | 66.8 |
| C | 1 | 16 | 17686 | 260.64 | 278 | 279 | 66.8 |
| D | 13 | 249 | 228620 | 3323.6 | 275 | 267 | 68.7 |
| D | 12 | 227 | 80637 | 1169.76 | 275 | 267 | 68.7 |
| D | 12 | 233 | 59327 | 859.6 | 275 | 267 | 68.7 |
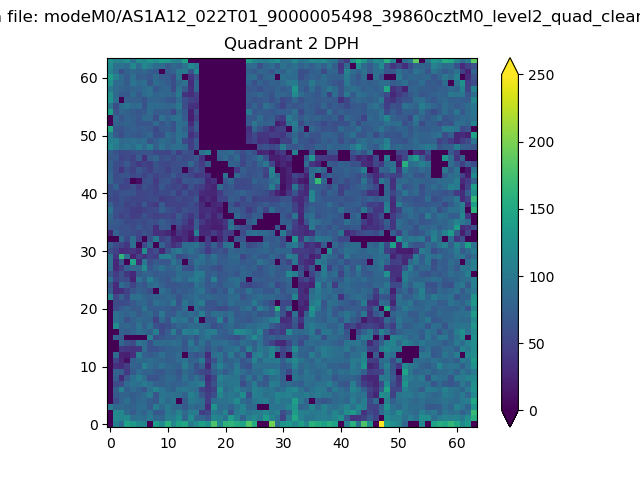
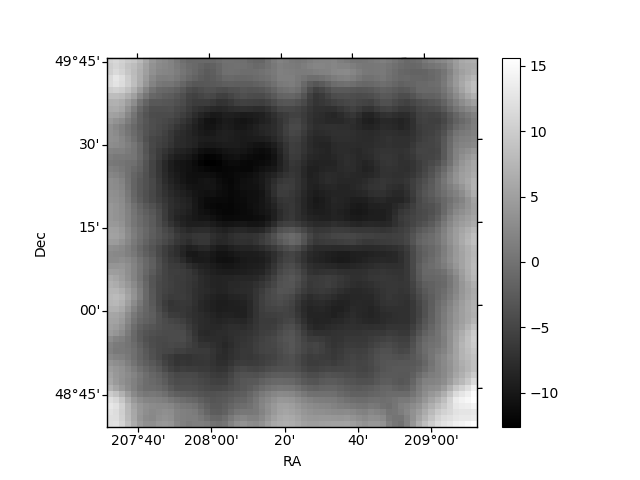
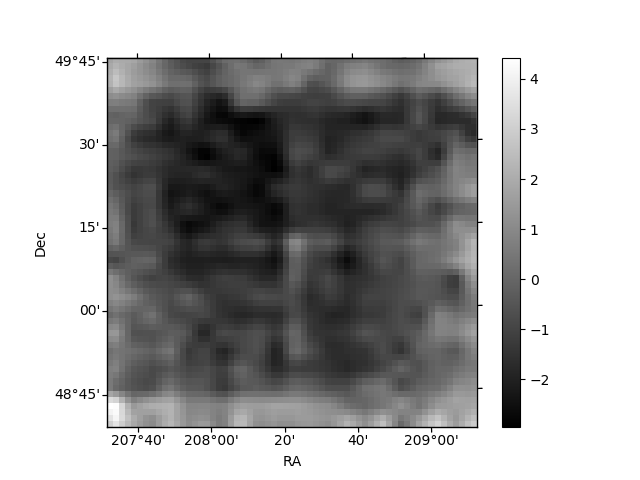
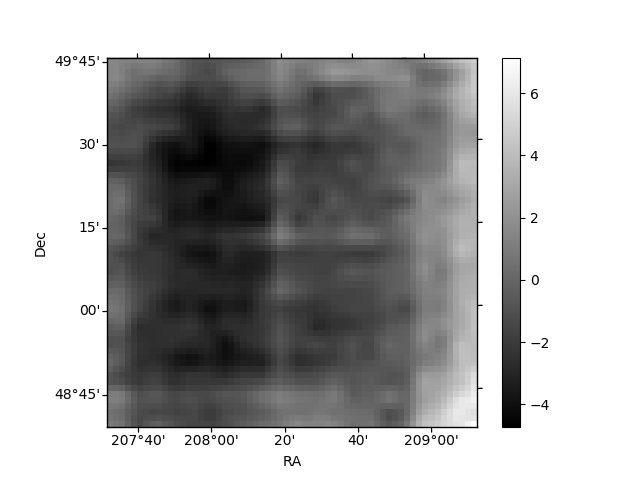
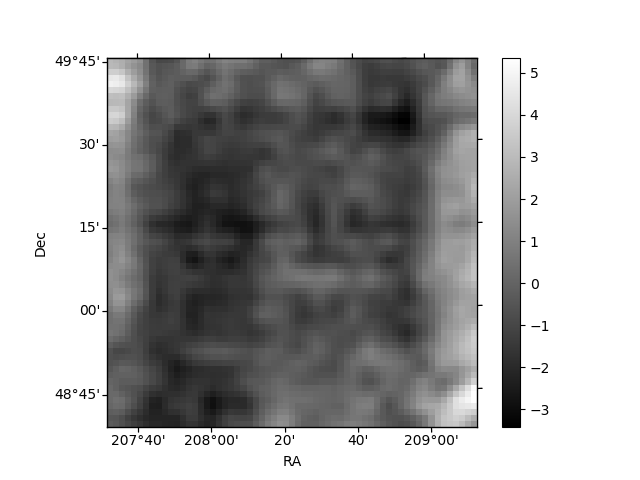
Histogram calculated using DETX and DETY for each event in the final _common_clean file
| Quadrant A | 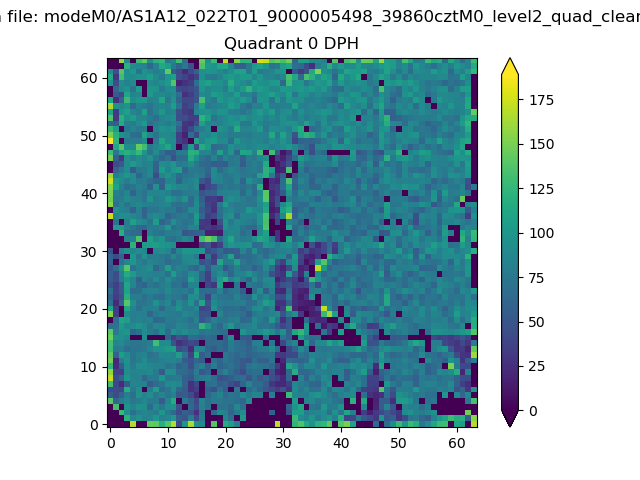 |
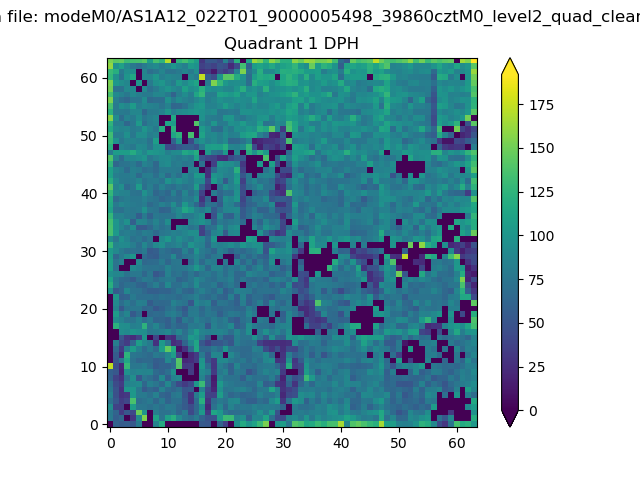 |
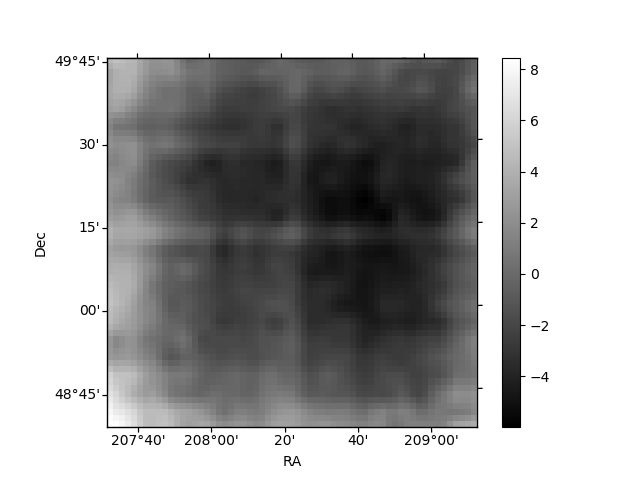
Quadrant B |
|---|---|---|---|
| Quadrant D | 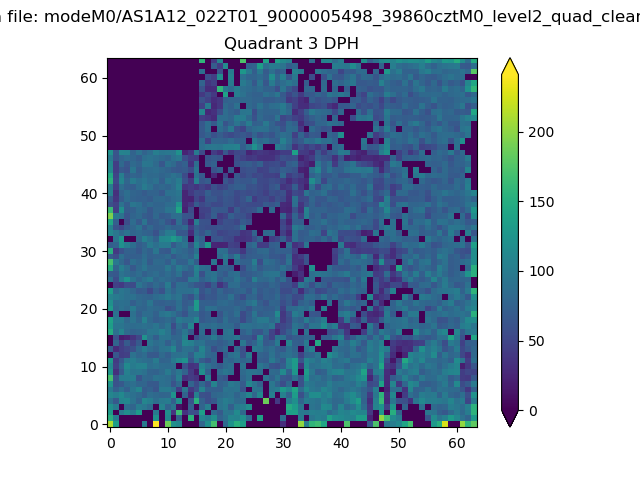 |
 |
Quadrant C |
| Plot type | Count rate plots | Images |
|---|---|---|
| Comparison with Poisson distribution Blue bars denote a histogram of data divided into 1 sec bins. Red curve is a Poisson curve with rate = median count rate of data. |
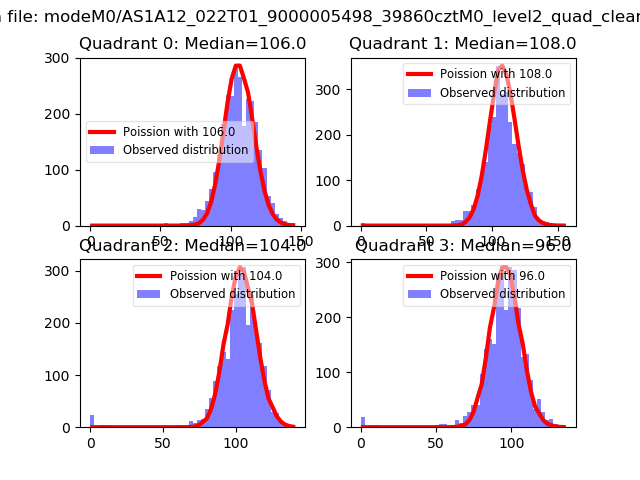 |
 |
| Quadrant-wise count rates Data is divided into 100 sec bins |
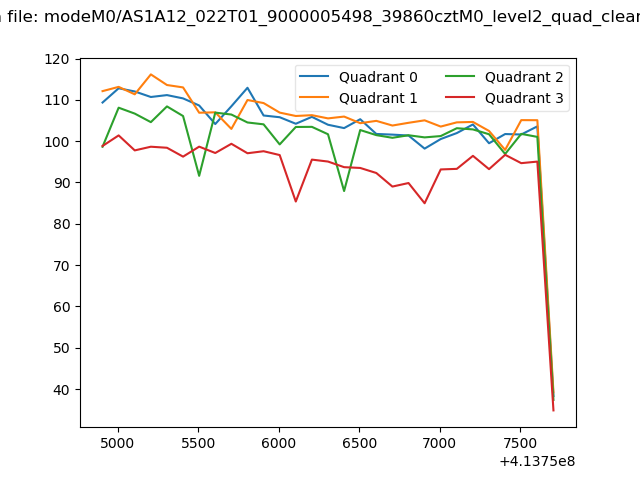 |
|
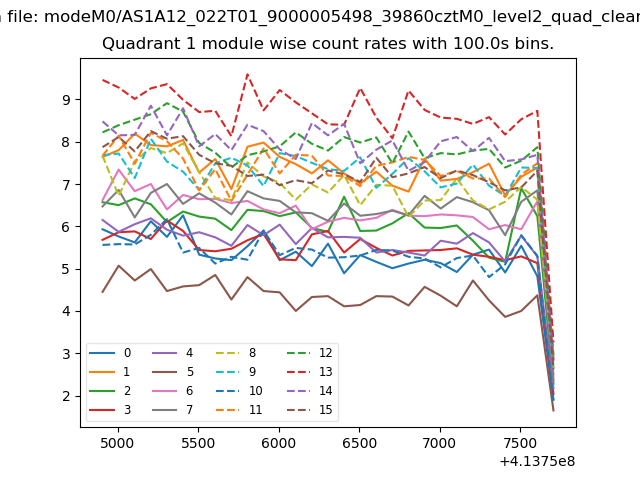
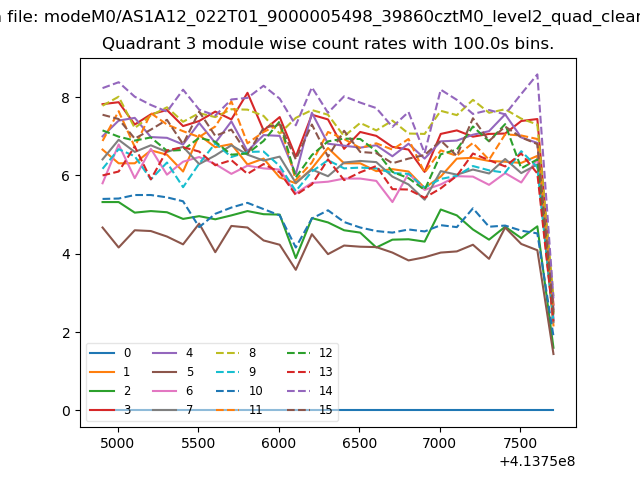
| Module-wise count rates for Quadrant A Data is divided into 100 sec bins |
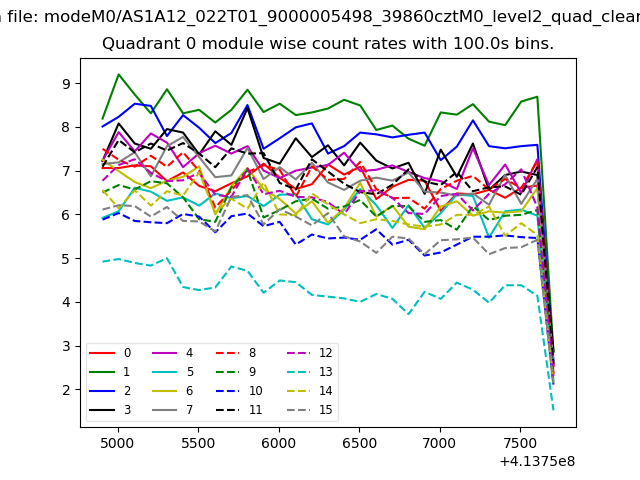 |
 |
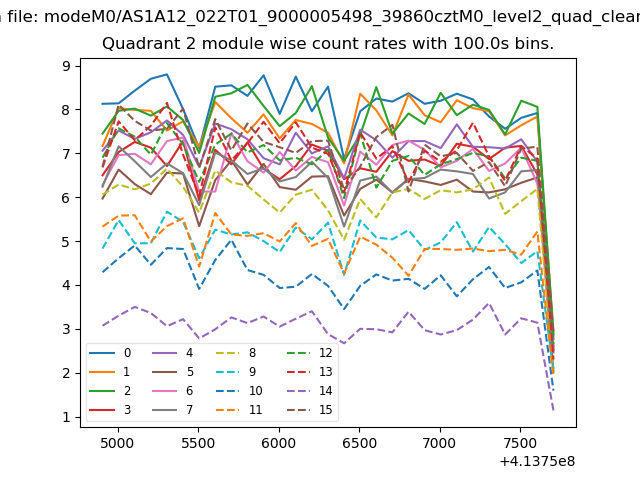
| Module-wise count rates for Quadrant B Data is divided into 100 sec bins |
 |
 |
| Module-wise count rates for Quadrant C Data is divided into 100 sec bins |
 |
 |
| Module-wise count rates for Quadrant D Data is divided into 100 sec bins |
 |
 |
| Parameter | Plot |
|---|---|
| CZT HV Monitor | 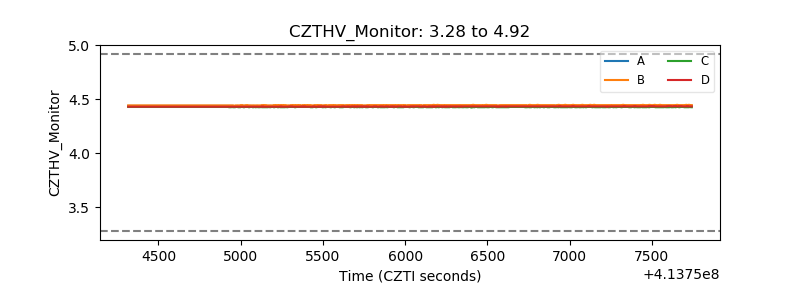 |
| D_VDD | 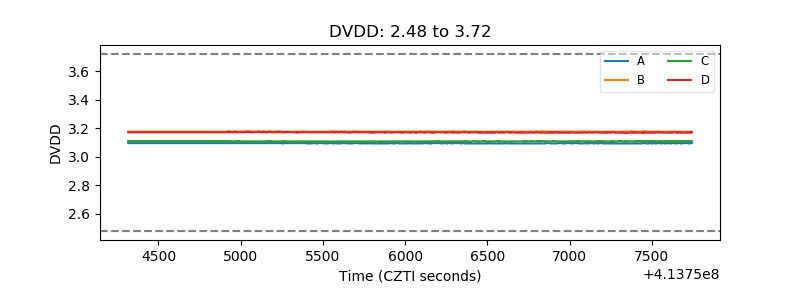 |
| Temperature 1 | 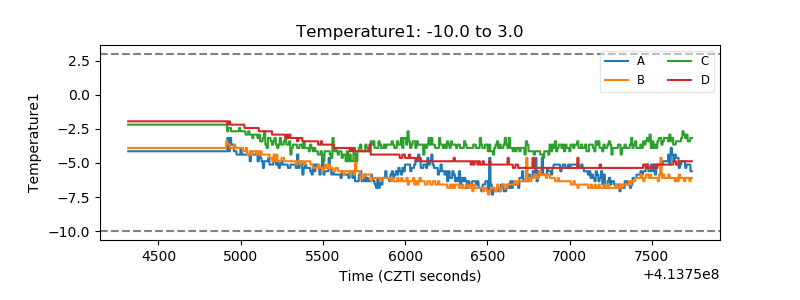 |
| Veto HV Monitor | 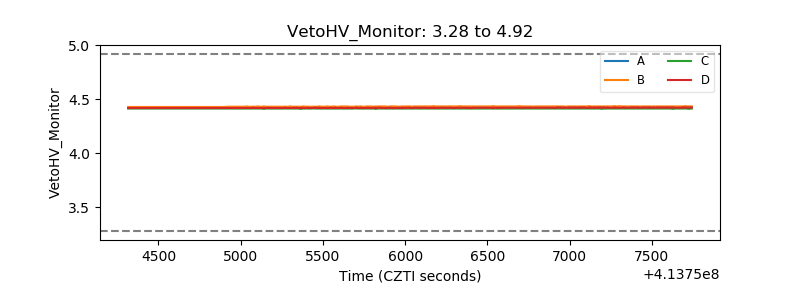 |
| Veto LLD | 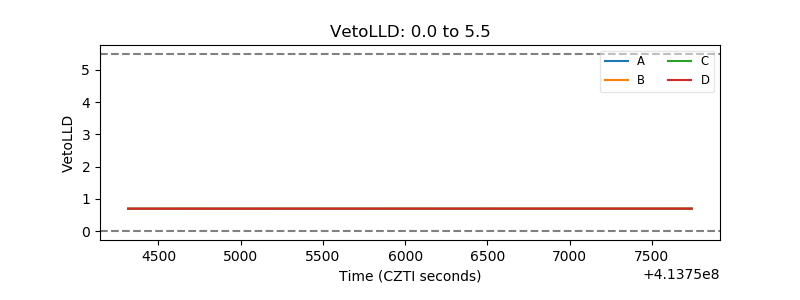 |
| Alpha Counter | 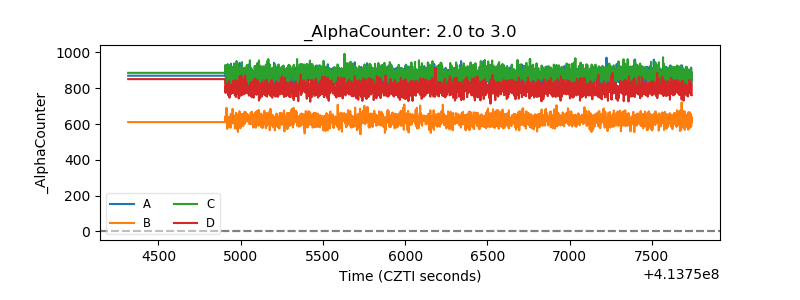 |
| _CPM_Rate | 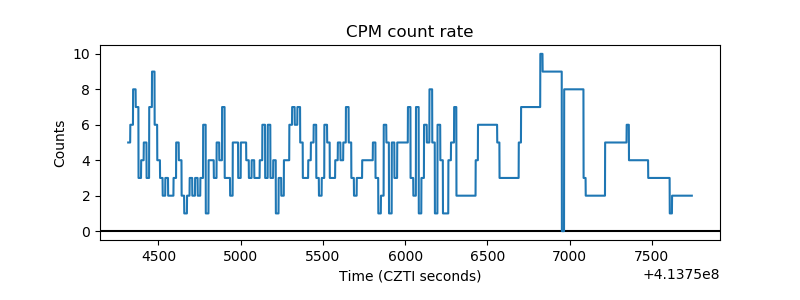 |
| CZT Counter | 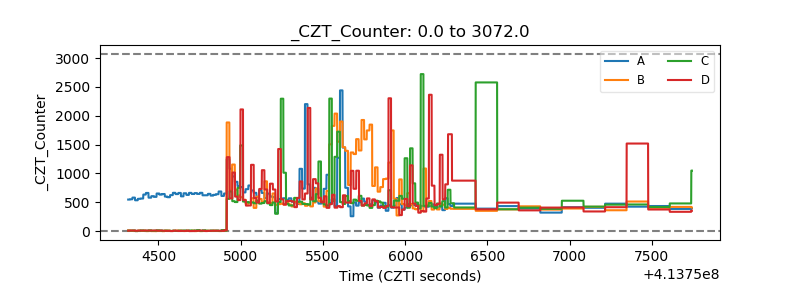 |
| +2.5 Volts monitor | 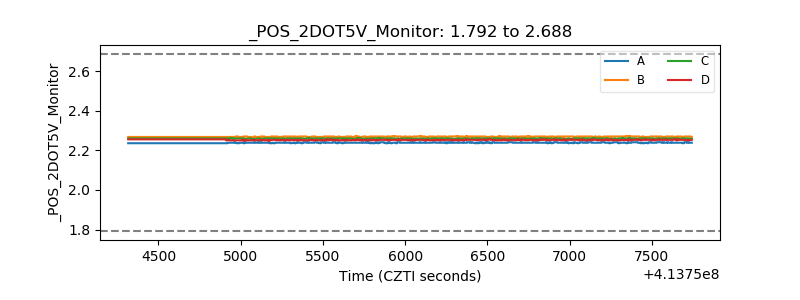 |
| +5 Volts monitor | 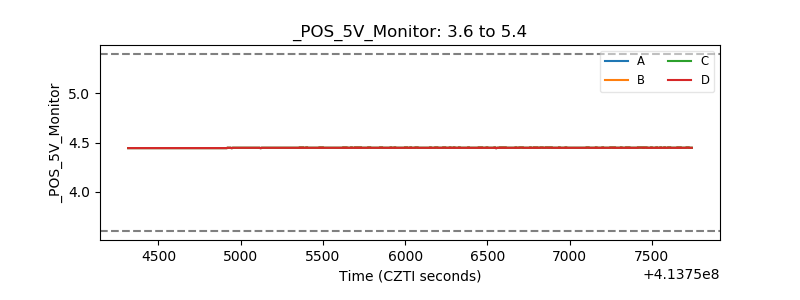 |
| _ROLL_ROT | 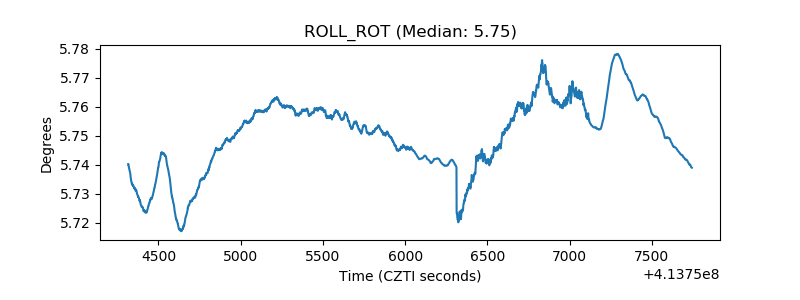 |
| _Roll_DEC | 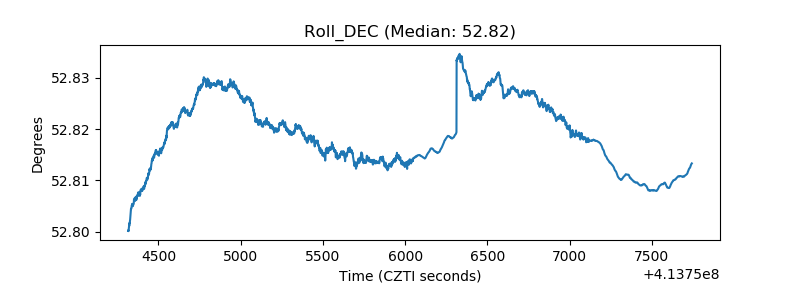 |
| _Roll_RA | 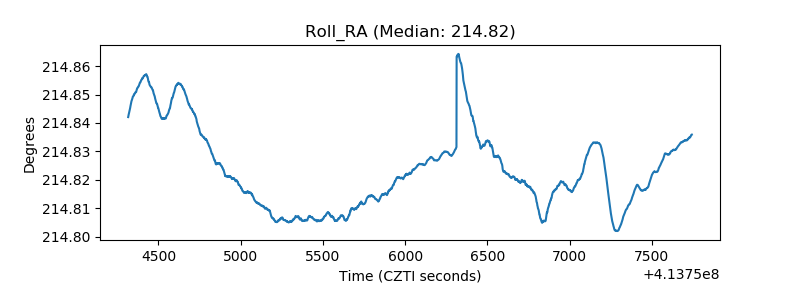 |
| Veto Counter | 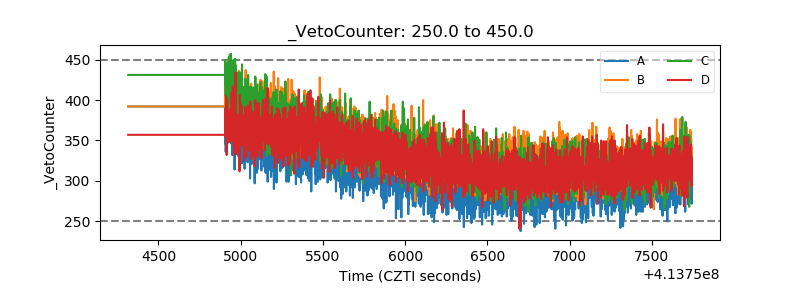 |